Milestone - FAF
Introduction
This manual provides an overview of Scylla Intrusion Detection System (IDS) Plugin for Milestone Video Management System (VMS) and instructions on how to use it.
This plugin adds additional functionality to Milestone Video Management System to support Scylla Intrusion Detection System.
The AI-based Scylla IDS system is dedicated to supporting existing intrusion detection solutions that are based on non-managed motion detection. The main goal of Scylla IDS is to add smart identification features to otherwise “blind” and not accurate embedded alarm systems of cameras thus reducing the number of false positive alarms. In the core of Scylla IDS is the state-of-the-art “person/car detection and classification algorithm” that double checks the scenery for people/cars and filters out the cases where the detection does not contain subjects of interest. In current implementation the analysis takes place on a cloud-based server, but local deployment of the AI-core engine is also possible.
Scylla IDS Plugin Setup
Tested Environment:
Milestone XProtect Management Client 2024 R2
Windows 11
Scylla IDS plugin setup file for Milestone can be downloaded from Scylla's Cloud Dashboard or Milestone Marketplace. Plugin connects to Scylla IDS web server to perform image/video processing.
To setup Scylla IDS plugin, do the following:
- Open the Scylla_IDS_Milestone_Setup file. Click Next.
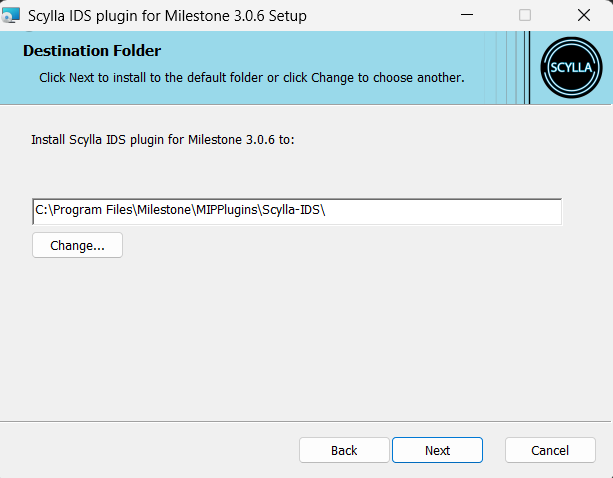
- Specify the installation path. All plugins developed for Milestone VMS need to be installed in “MIPPlugins” folder (for example default Milestone path for 64 bit operating system is C:\Program Files\Milestone, so plugin installation folder in this case is C:\Program Files\Milestone\MIPPlugins\Scylla-IDS). Click Next.
-
Click Install.
-
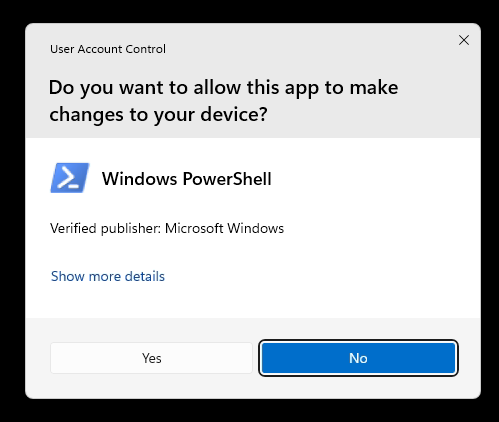
Click Yes to allow administrator permissions for file installation.
-
Click Finish.
Scylla IDS Plugin Configuration
- Navigate to Plugin page
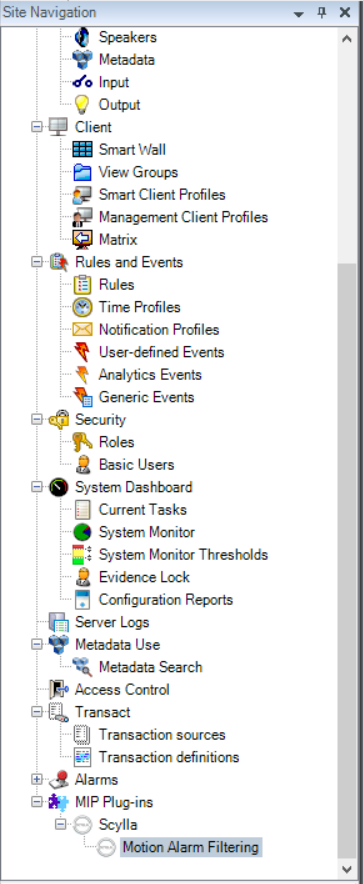
Run as administrator XProtect Management Client and go to MIP Plugins→Scylla→Motion Alarm Filtering.
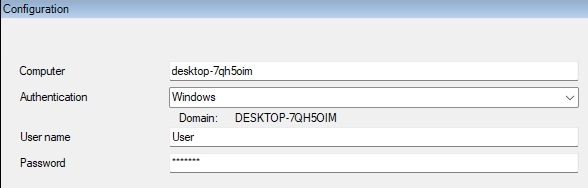
On the right side you will see a Configuration Page with Authentication and Configuration sections.
2.Select Authentication Type
In the Authentication section provide your computer name and choose the authentication method :
- Windows – Enter the Windows username and password.
- Basic – Enter the Milestone user credentials.
- Ensure that the selected Milestone user has sufficient permissions to access the plugin. Windows – Enter the Windows username and password.
Basic – Enter the Milestone user credentials.
- Ensure that the selected Milestone user has sufficient permissions to access the plugin. Ensure that the selected Milestone user has sufficient permissions to access the plugin.
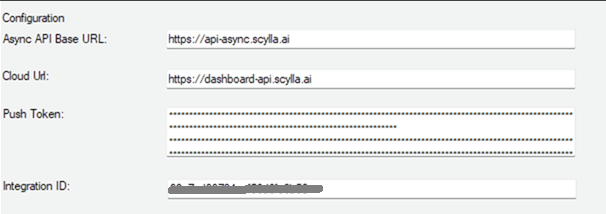
3.Configure integration settings
Under the Configuration tab, enter the following details:
- Push Token
- Integration ID Push Token
Integration ID
You can find both values on your Scylla Dashboard. (Refer to the relevant section of the original guide for detailed steps.)
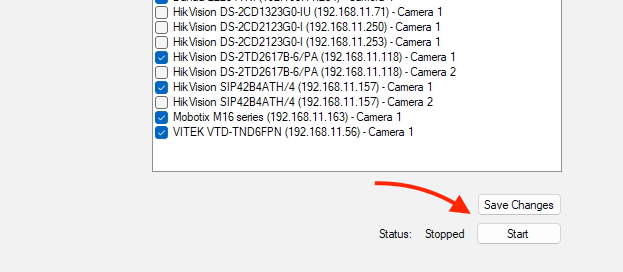
4.Set video clip duration and select cameras
Next, specify:
- The duration of the video clip (from 1-9 seconds).
- The cameras from which you wish to receive alarms on the Scylla Dashboard. The duration of the video clip (from 1-9 seconds).
The cameras from which you wish to receive alarms on the Scylla Dashboard.
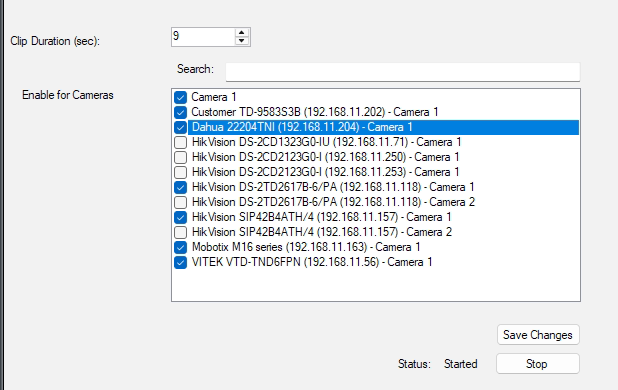
Click Save Changes.
Click the Save Changes button.
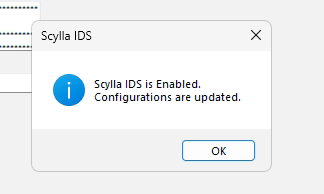
Click Ok on the confirmation pop up message.
5.Motions Settings
- Go to Devices → Cameras.
- Select the camera(s) previously enabled in the Scylla plugin.
- In the Camera Properties window, open the Motion tab.
- Enable “Manual Sensitivity” checkbox Go to Devices → Cameras.
Select the camera(s) previously enabled in the Scylla plugin.
In the Camera Properties window, open the Motion tab.
Enable “Manual Sensitivity” checkbox
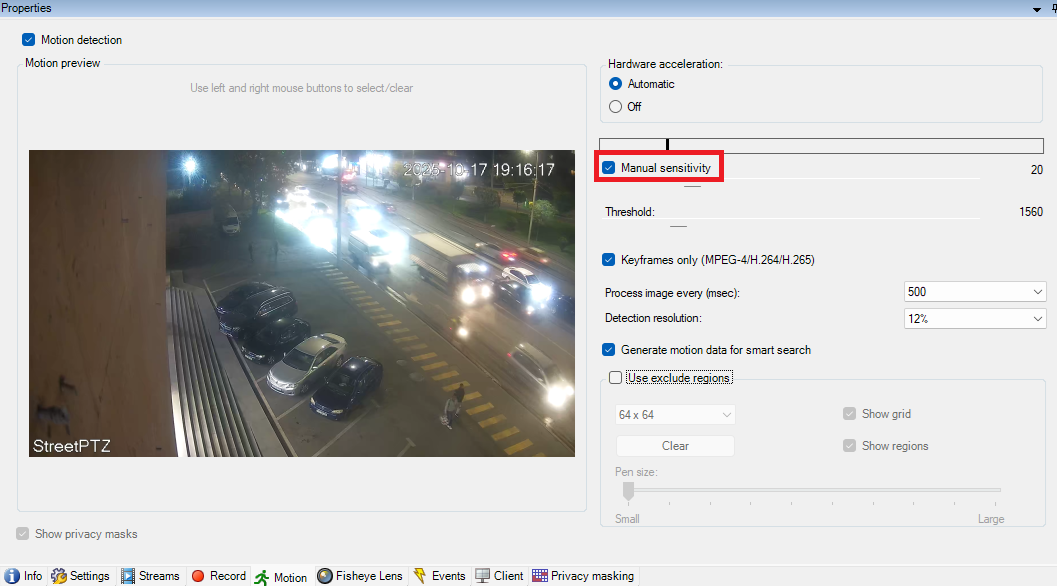
- Now change the sensitivity and threshold using the slider .
- First slider is the sensitivity (the minimum change required in order to react) which means the lower the value the more sensitive.
- Second slider is the threshold ,represented by the black line , if the detection passes this threshold this means motion is detected (line will become red)-> the lower the value (more to the left) , then motion detection will be triggered more easily. Now change the sensitivity and threshold using the slider .
First slider is the sensitivity (the minimum change required in order to react) which means the lower the value the more sensitive.
Second slider is the threshold ,represented by the black line , if the detection passes this threshold this means motion is detected (line will become red)-> the lower the value (more to the left) , then motion detection will be triggered more easily.

- Change these values based on the camera view and area of interest where motion should be detected to remove unnecessary motion detections. Change these values based on the camera view and area of interest where motion should be detected to remove unnecessary motion detections.
6.Turn on motion detection exclude regions for each camera
Before running the plugin, exclude regions must be enabled for all selected cameras.
- Go to Devices → Cameras.
- Select the camera(s) previously enabled in the Scylla plugin.
- In the Camera Properties window, open the Motion tab.
- Click Enable Motion Detection.
- Set the Grid Size to 64x64.
- Save the changes. Go to Devices → Cameras.
Select the camera(s) previously enabled in the Scylla plugin.
In the Camera Properties window, open the Motion tab.
Click Enable Motion Detection.
Set the Grid Size to 64x64.
Save the changes.
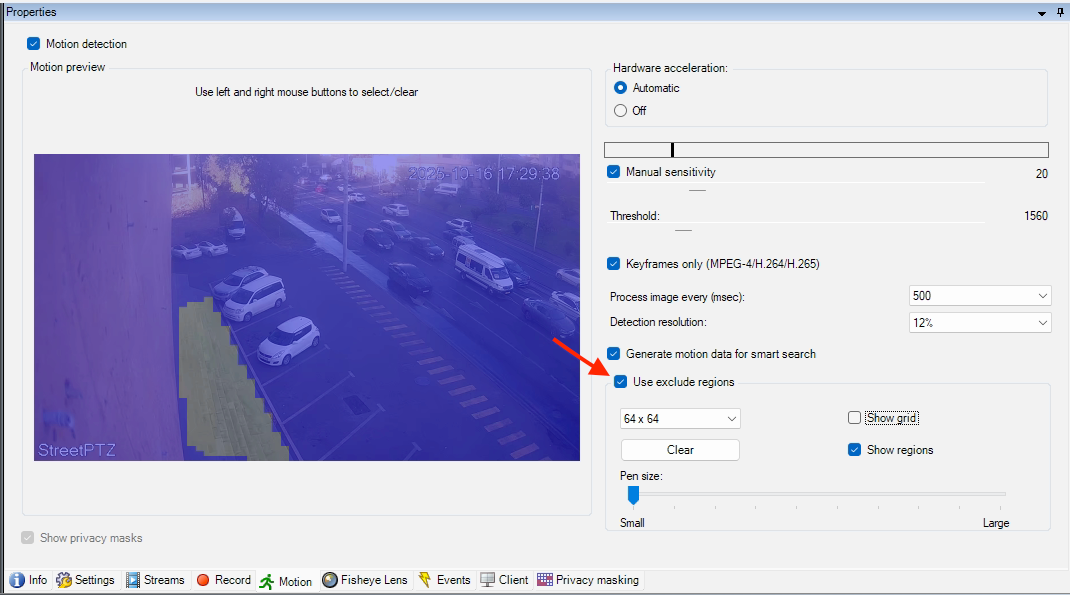
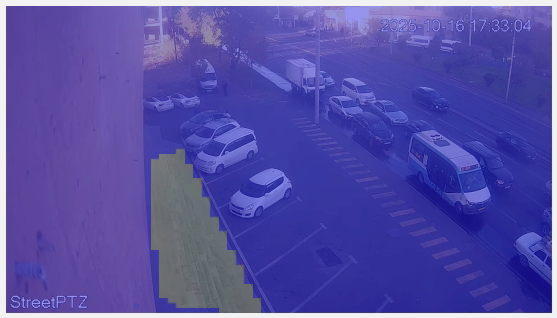
This ensures that the motion mask drawn in the Scylla Dashboard also gets applied on Milestone camera, reducing false alarms.
Repeat these steps for all cameras configured in the Scylla plugin.
Example:
Start the Plugin
Once configuration is complete:
- Navigate back to MIP Plug-Ins → Scylla → Motion Alarm Filtering.
- Click Start. Navigate back to MIP Plug-Ins → Scylla → Motion Alarm Filtering.
Click Start.
When the Windows confirmation dialog appears, click Yes.
The service will now start and can be stopped the same way at any time using the Stop button.
NOTE: Please don’t start/stop/restart the service from the Services window until necessary.
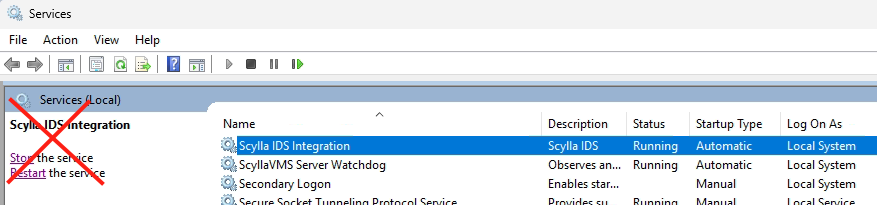
NOTE: In case you start/stop the service , you need to restart the Xprotect management client application to view the status in the plugin page.
Plugin logs
Plugin logs are found in the following path C:\ProgramData\Scylla\IDS plugin for Milestone\Logs
In case of error logs or unusual logs, please contact Scylla support.
Login to Scylla Dashboard
To use Scylla Security Suite, you first need to login to the dashboard.
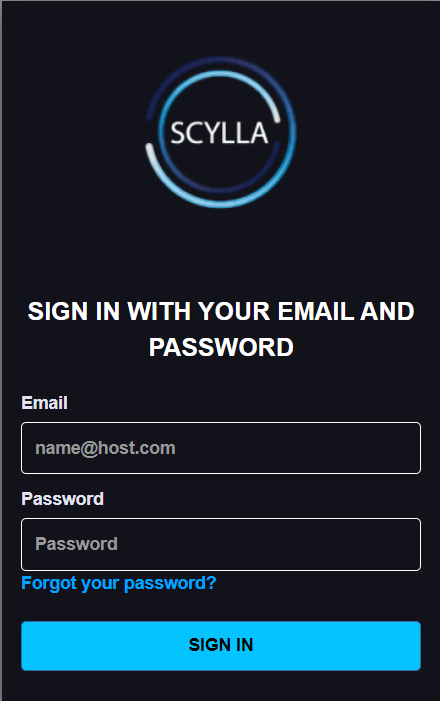
Dashboard is publicly accessible by the following URL: https://dashboard.scylla.ai/login.
If you are already logged in, you will be redirected to the main Dashboard page.
If you are not logged in, you need to enter your Email and Password into the corresponding fields and click the Login button.
NOTE. Please be attentive while entering your username and password into the fields. Make sure you have not copied any additional characters.
After entering your credentials and clicking the Login button you will be redirected to the Dashboard page.
If you see the “Incorrect username or password” message, that means you have entered wrong credentials.
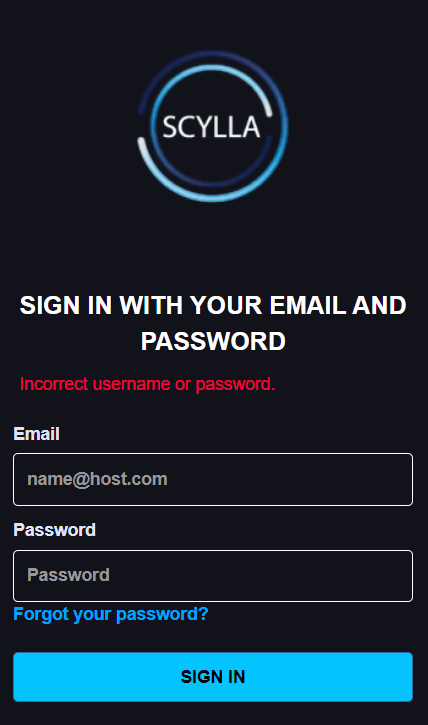
Double-check and reenter your credentials. If this message appears again, contact your administrator, or reset your password. See the Reset Password section for more instructions.
If you are not able to log in and there is no message, try to clean your browser’s cache and try again. See this article for detailed instructions on how to clean your browser’s cache. If cleaning the cache does not solve the problem, you are always welcome to submit a request on the Help Center.
Reset Password
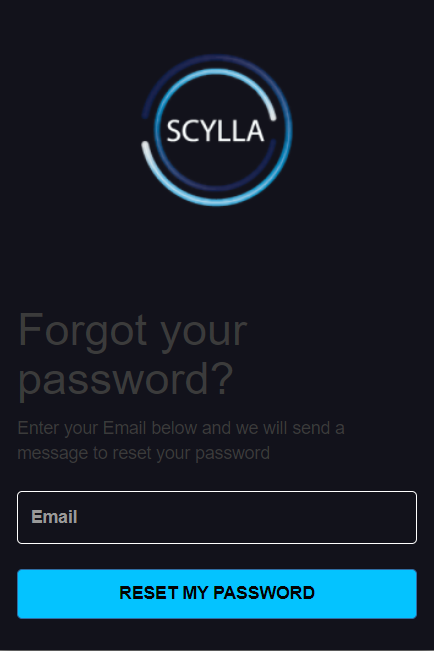
To reset your password, click the Forgot your password? button on the Login page.
Then enter your email and click on Reset my password button to receive your reset code.
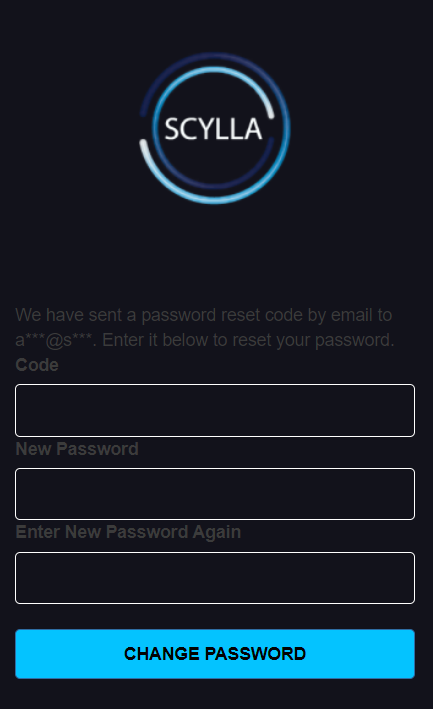
Then fill all fields with the required information and click the CHANGE PASSWORD button.
Scylla Security Suite
Sites
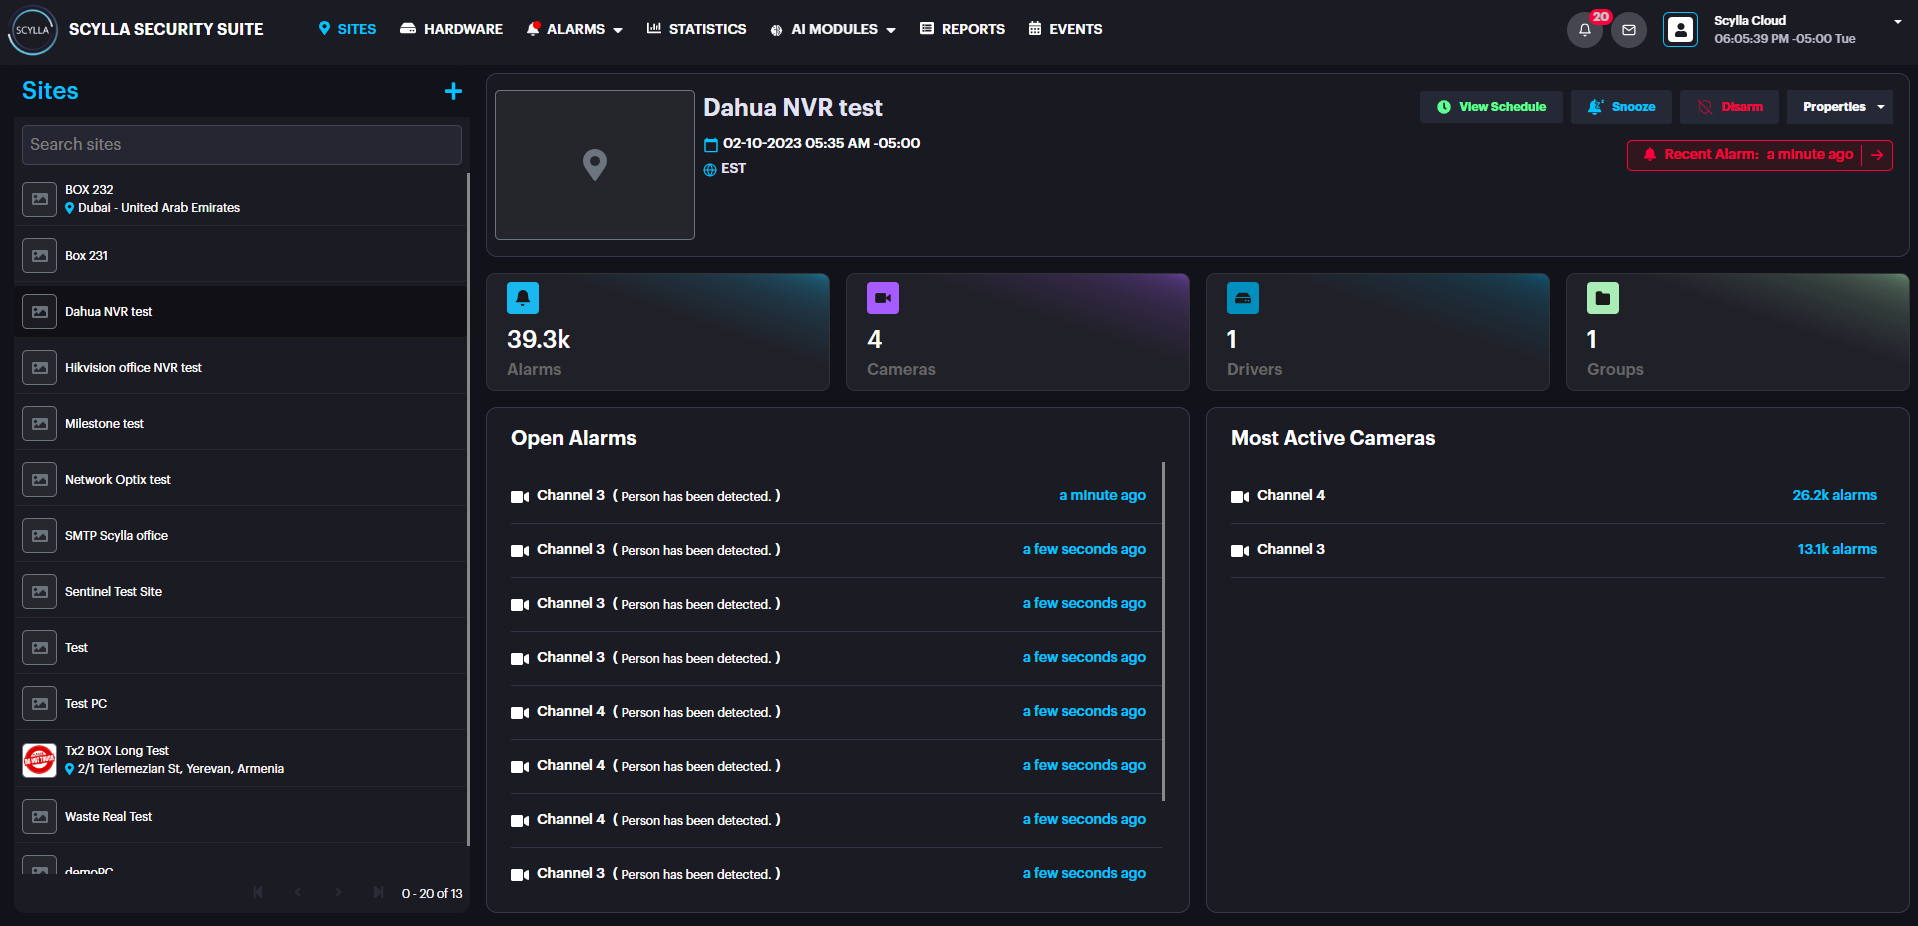
On the Sites page you can see the list of sites on the left side.
Select the desired site to see the following stats and options:
- Site name and creation date
- Recent alarm — info about the most recent alarm (in red message)
- Snooze — select the type of alarm notification’s snooze action and the duration
- View Schedule- Info about the schedule of the selected site
- Disarm — disarm the detections from selected Site by specified duration or disarm/arm manually
- Alarms — number of recent alarms
- Cameras — number of connected cameras
- Drivers- number of drivers
- Groups — number of groups
- Open Alarms — window containing the most recent alarms. Click on the specific alarm to see the detailed information only for this alarm occurrence.
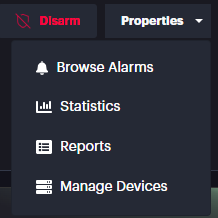
- Properties window:
- Browse Alarms — opens the Browse Alarms History page with all alarms for this specific site
- Statistics — opens the Statistics page for this specific site
- Reports — opens the Reports page for this specific site
- Manage Devices — opens the Manage Devices menu for this specific site
- Most Active Cameras — list of most active cameras and a total number of their alarms. Click on the camera to see its detailed information and settings from the Hardware menu Site name and creation date
Recent alarm — info about the most recent alarm (in red message)
Snooze — select the type of alarm notification’s snooze action and the duration
View Schedule- Info about the schedule of the selected site
Disarm — disarm the detections from selected Site by specified duration or disarm/arm manually
Alarms — number of recent alarms
Cameras — number of connected cameras
Drivers- number of drivers
Groups — number of groups
Open Alarms — window containing the most recent alarms. Click on the specific alarm to see the detailed information only for this alarm occurrence.
Properties window:
- Browse Alarms — opens the Browse Alarms History page with all alarms for this specific site
- Statistics — opens the Statistics page for this specific site
- Reports — opens the Reports page for this specific site
- Manage Devices — opens the Manage Devices menu for this specific site Browse Alarms — opens the Browse Alarms History page with all alarms for this specific site
Statistics — opens the Statistics page for this specific site
Reports — opens the Reports page for this specific site
Manage Devices — opens the Manage Devices menu for this specific site
Most Active Cameras — list of most active cameras and a total number of their alarms. Click on the camera to see its detailed information and settings from the Hardware menu
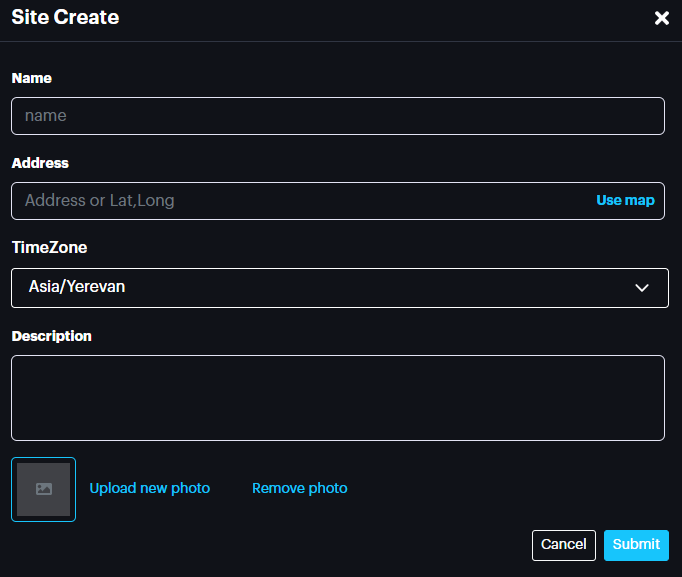
To create a new site, click the Add new site button.

Then, in the Site Create pop-up menu specify the Name, Address, TimeZone, and Description, Upload photo if needed and Click Submit.
![]()
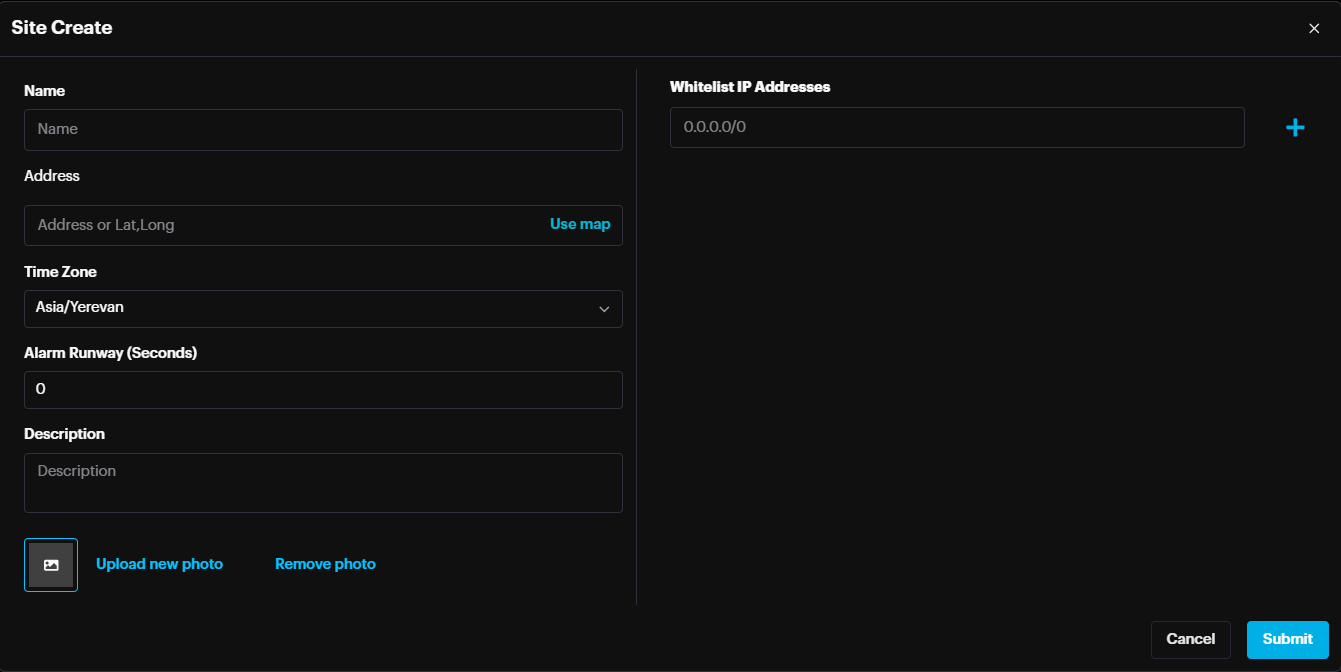
Enter the information into the corresponding fields and click Submit to save.
Manage Devices
On the Site page select the desired site, then click on Manage Devices on the Properties window.

You can also open the specific camera’s settings by clicking the camera in the Most Active Cameras window.
On the Manage Devices menu you can open the existing camera groups to see all cameras and be able to change their settings.
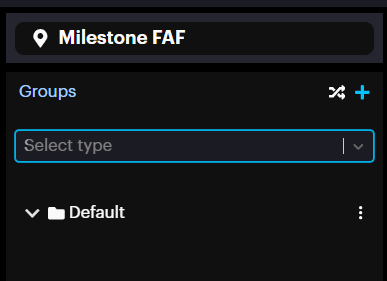
Create Group
![]()
In the opened Group Create pop-up specify the name for a new group and click Submit.

Add New Device
To add new device, click on the More Options button on the desired group and click Add camera.
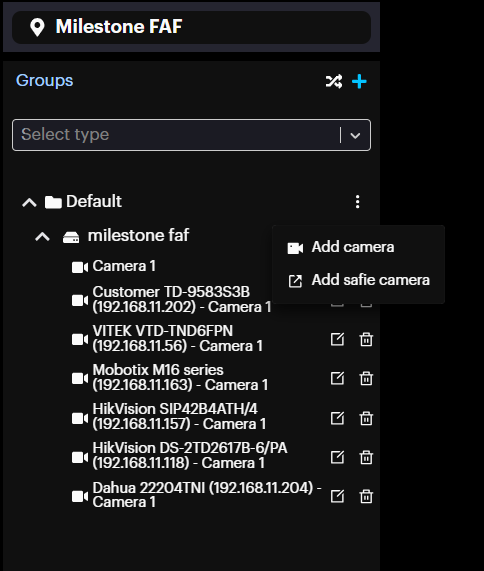
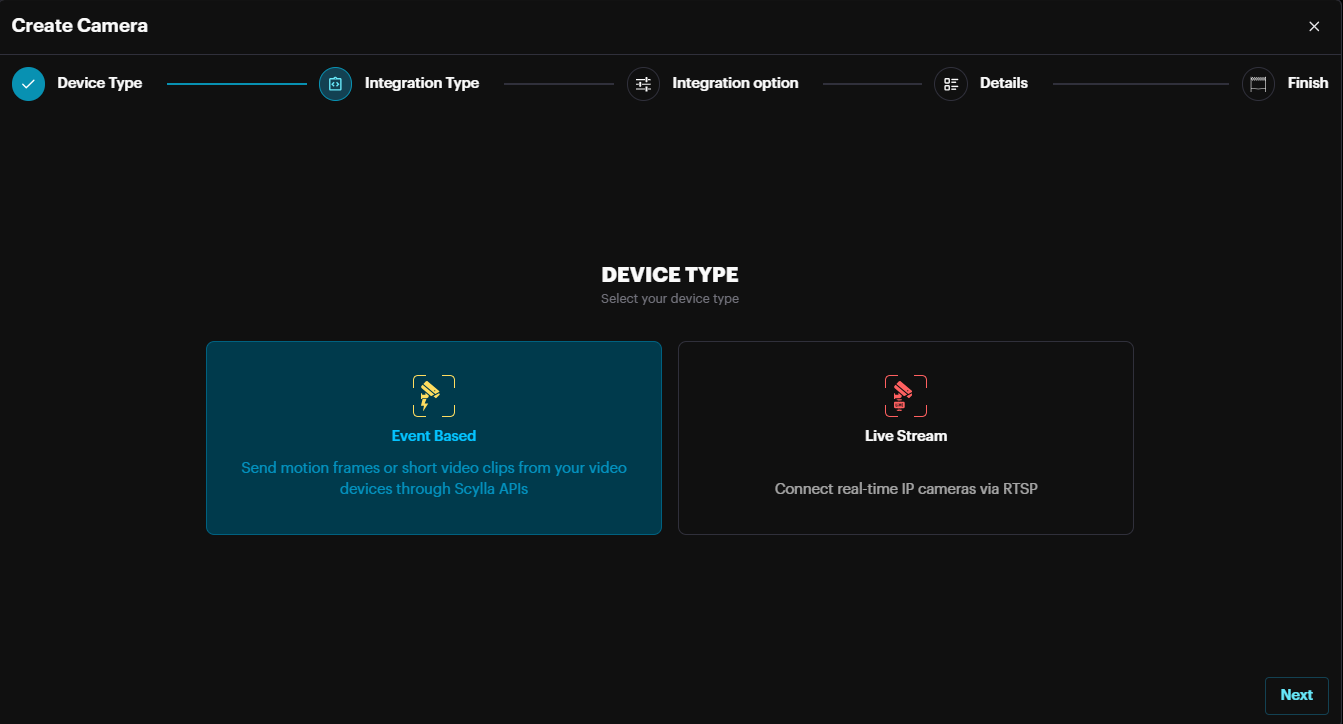
Then on the pop-up menu in the Device Type section select the desired type based on your requirements, goals, and tools (Event Based or Live Stream).
Seelct Event Based & Click Next.
In the Integration Type section select the desired integration type and click Next.
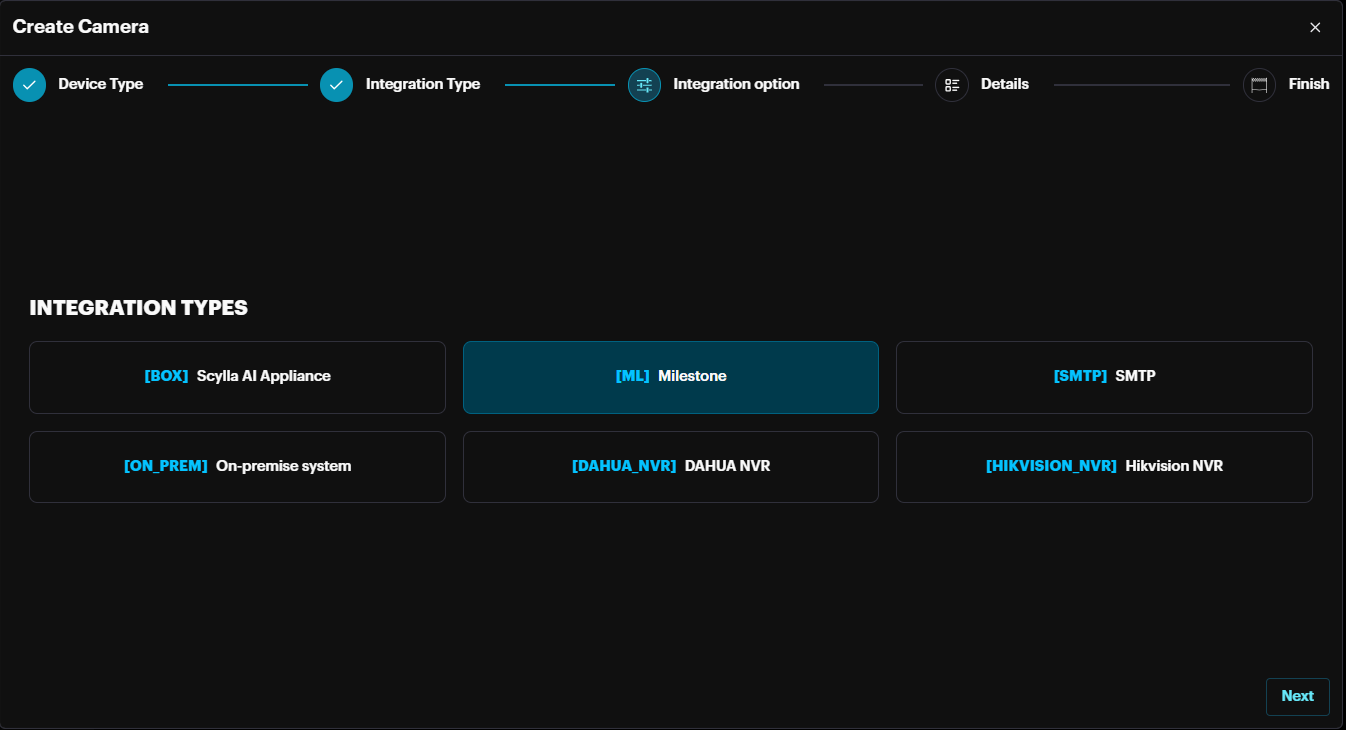
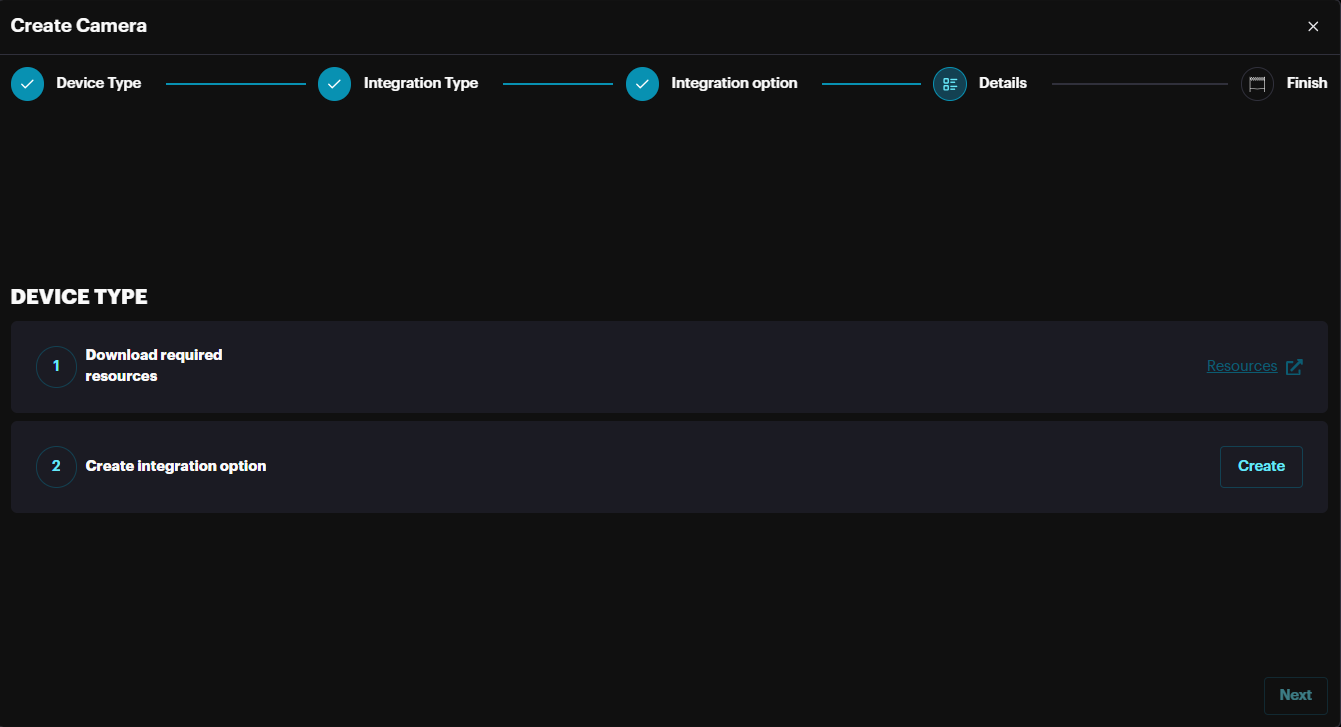
In the Integration Types section, click the Resources button to download the manual for this integration. Then click Create.
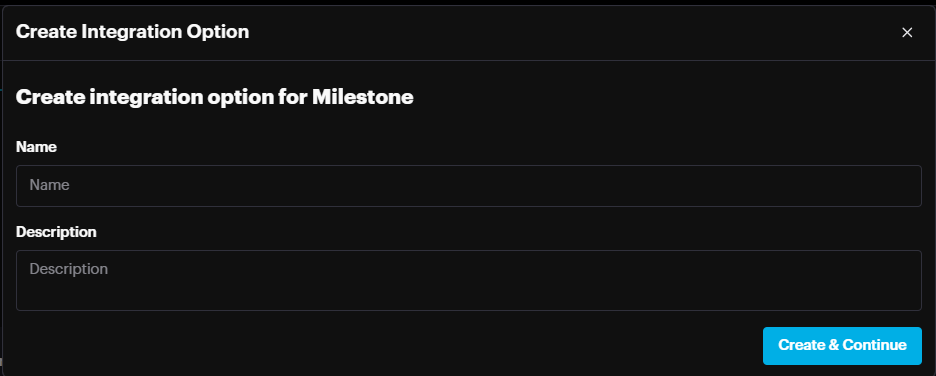
On the Create Integration option pop-up enter the name and click Create & Continue.
Then click Next.
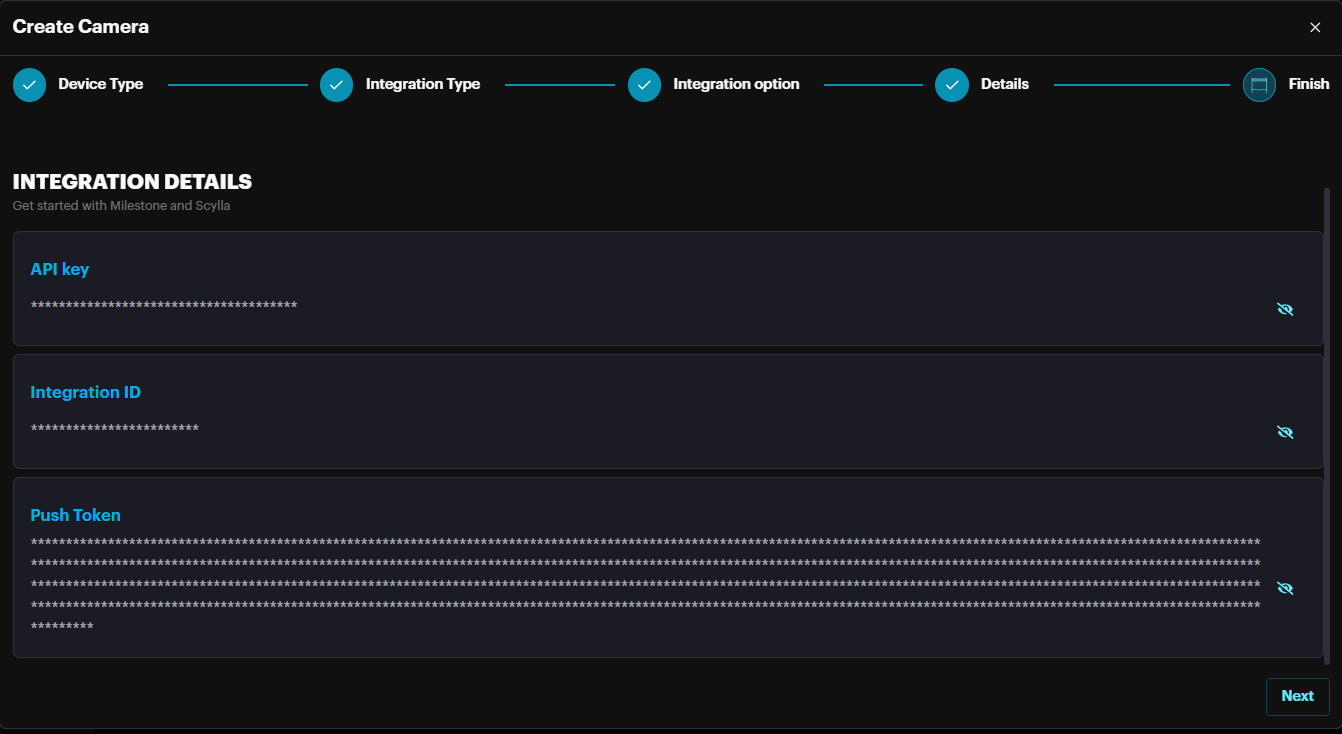
In the Details section the Integration ID and Push Token are displayed. Copy these two (after displaying the values) and paste in the relevant field on Xprotect Management Client -> Scylla -> Motion Alarm filtering page.
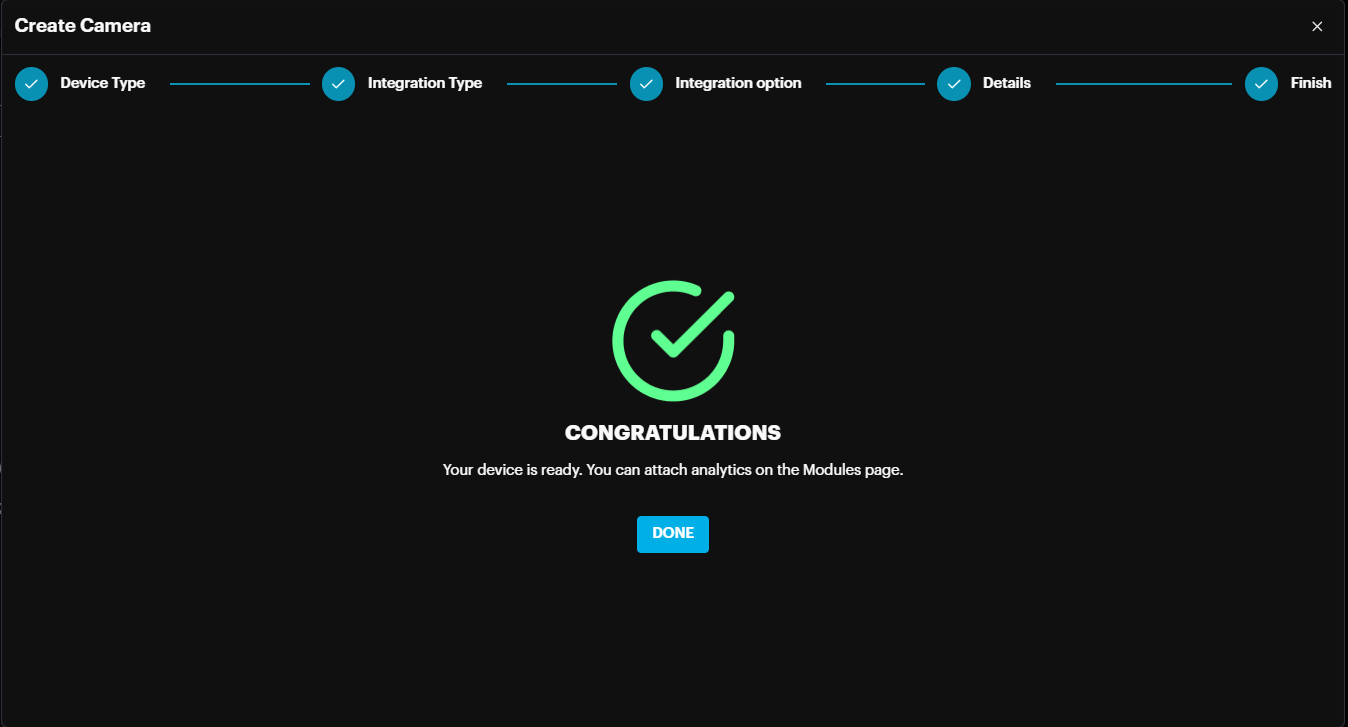
Click Done to finish the creation process.
In case you passed this page and want to get the credentials
Go to More Options -> Credentials.
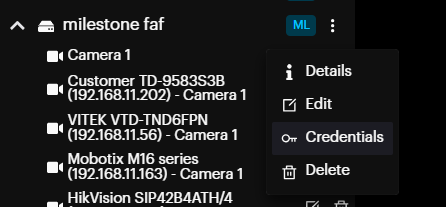
Then copy the Integration ID & Push Token
And insert them into the corresponding fields of your XProtect Management Client. See the Scylla IDS Plugin Configuration section for more information.
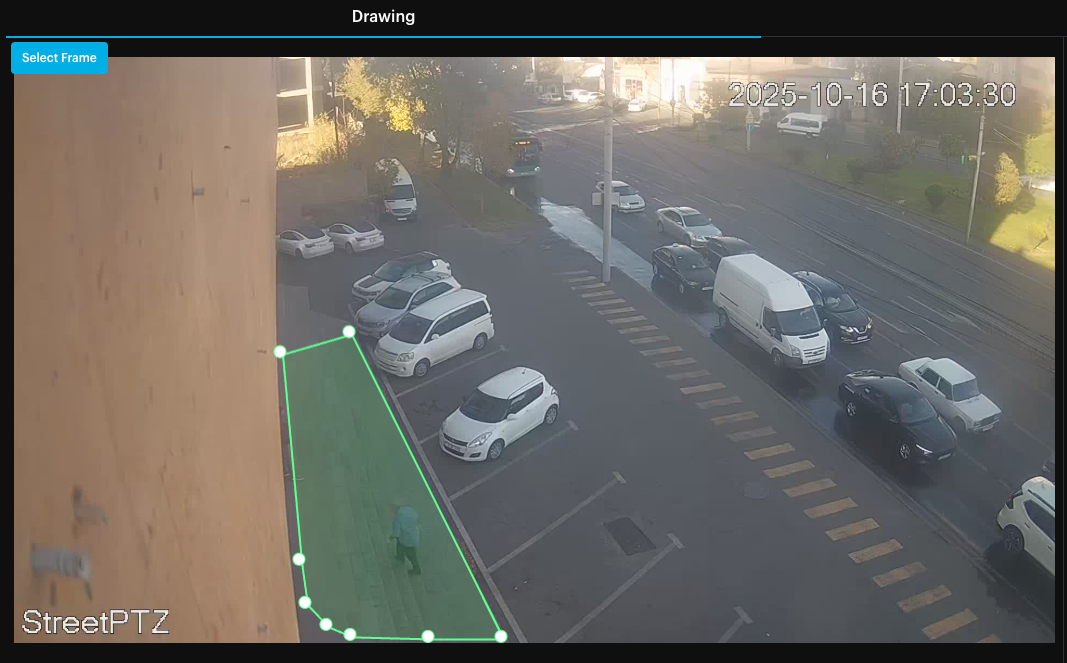
Camera Settings – Drawing active Areas
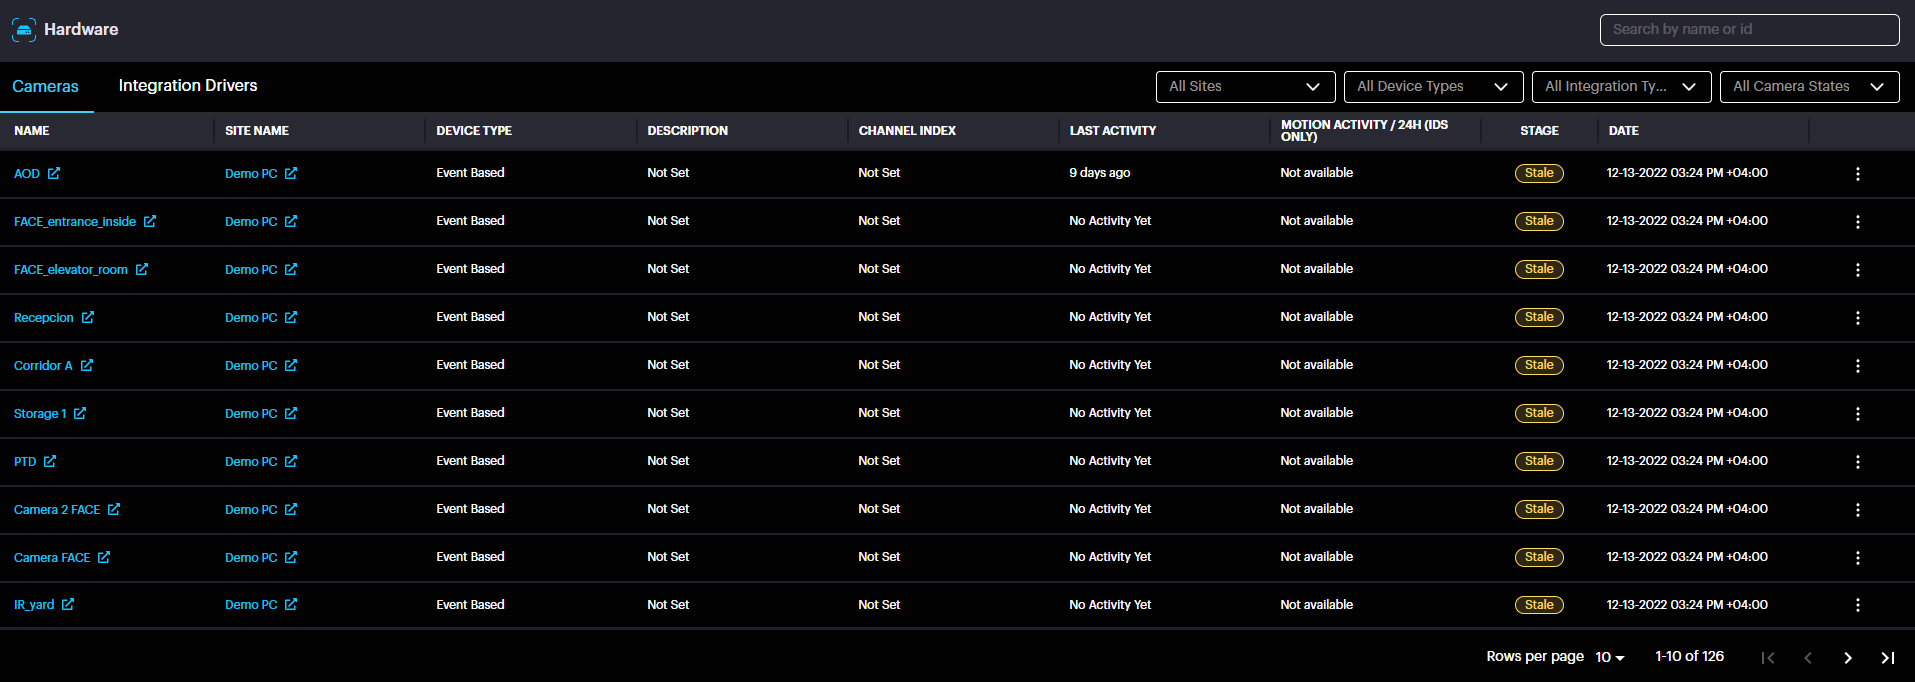
Hardware
On this page you can see the list of all connected Cameras and Integration Drivers, as well as sort Cameras by Sites, Device type, Integration type and Camera State, and sort Integration Drivers by Site and Device Type.
Coordinates
Here you can Draw coordinates for your cameras, which means you will receive the alarms from the zone which you drew for the camera, and this will be synced to Milestone Xprotect.
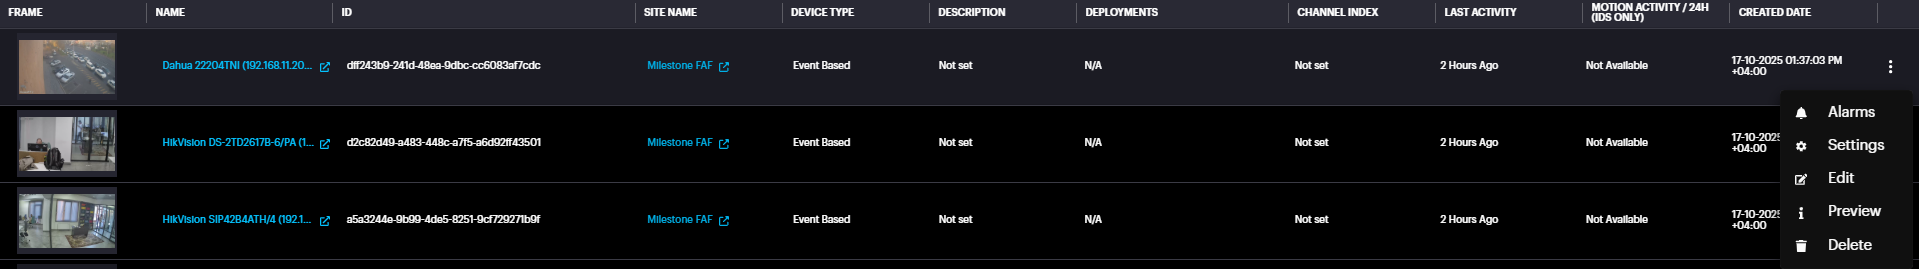
Choose the desirable camera click on three-dots button and click Settings.
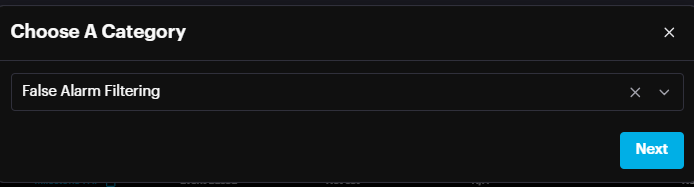
Choose the Category and click Next.
Left-click on the desired starting point for one line, then hover your mouse to the desired ending point and left-click. Now you have drawn one line. Repeat this process to create detection zones in your camera’s frame. Click Erase to delete all zones. Click Refresh to refresh the stream. Click Save to save all drawn zones.
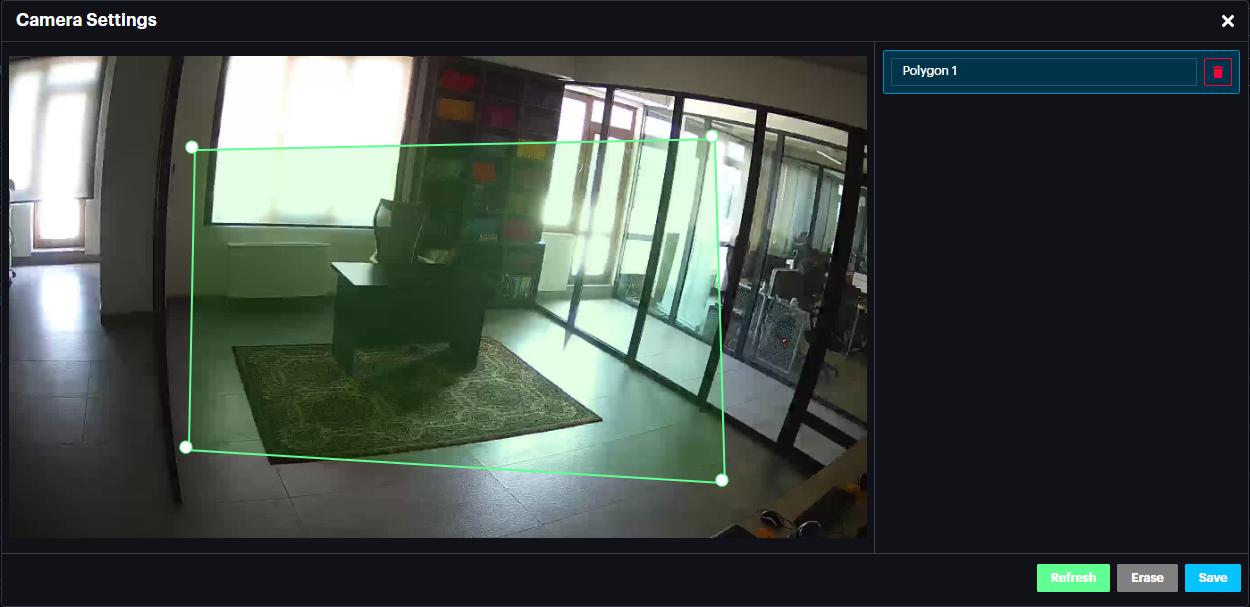
Note: Drawing the active area on Scylla Dashboard will sync to the Milestone Xprotect , you can check the sync which will be reflected in few minutes in Devices->cameras->motion page.
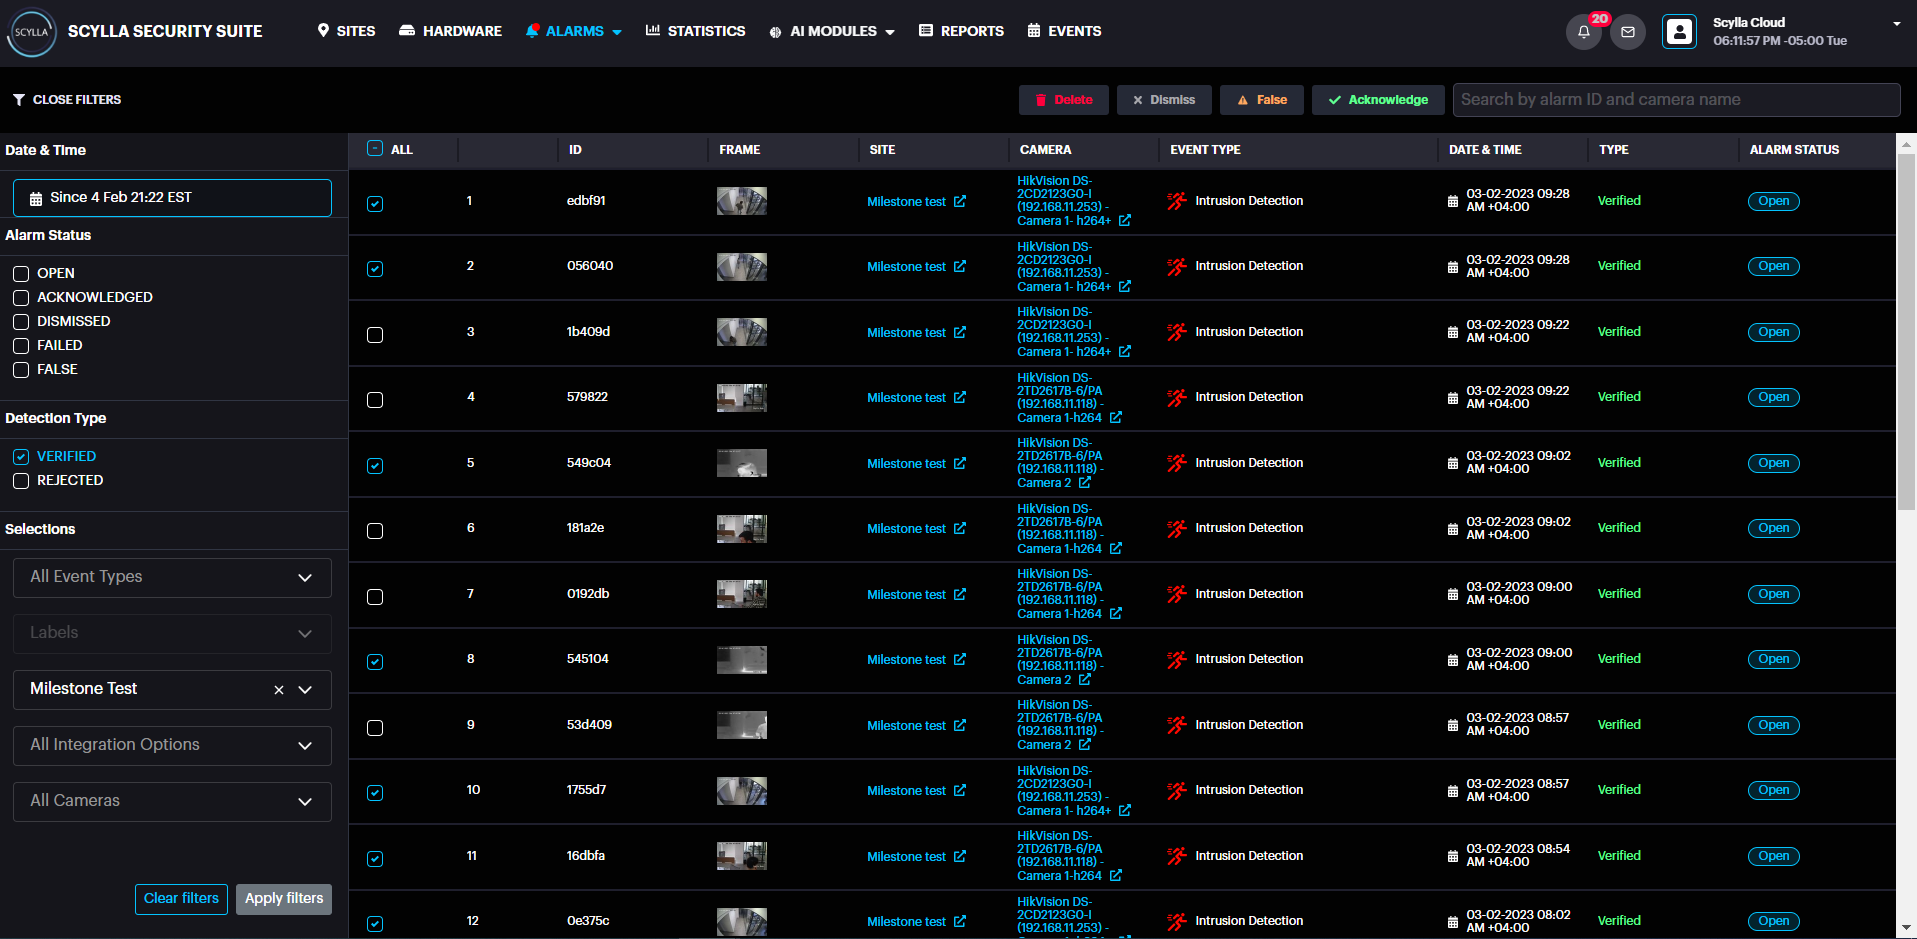
Browse Alarms History
On the Site page select the desired site, then click on Browse Alarms on the Properties window.
Here you can see the detailed information for all alarm occurrences (such as ID, Frame, Camera, Event Type, Date & Time, Type, and Alarm Status).
By default, the last alarm occurrence is selected, and its Detection Details window is open on the right side, and the Filters menu is open on the left side.
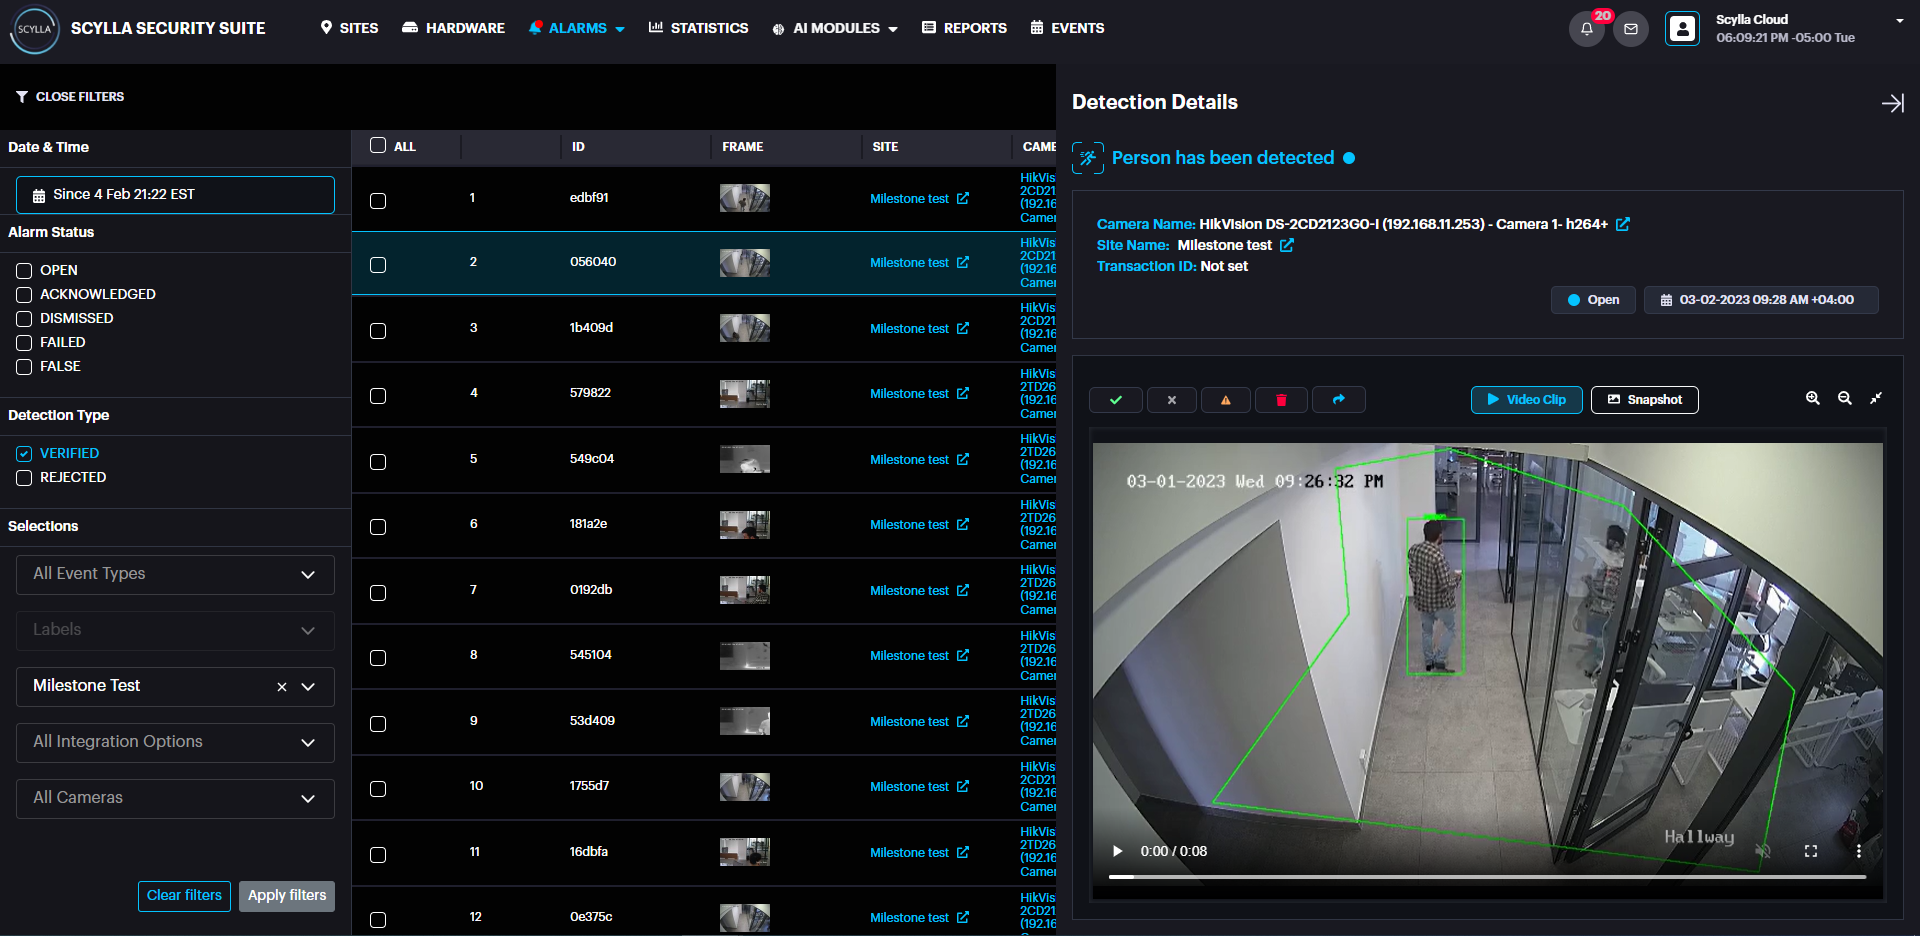
Click the Close Filters button to close the filters menu and click Open Filters button to open it again.
Filters allow you to filter alarms by:
- statuses (open, acknowledged, dismissed, ignored, failed);
- type (verified or rejected);
- event type;
- labels;
- sites;
- integration options;
- cameras;
- date & time (opens the calendar where you can click on the date field and select the desired date or a period). statuses (open, acknowledged, dismissed, ignored, failed);
type (verified or rejected);
event type;
labels;
sites;
integration options;
cameras;
date & time (opens the calendar where you can click on the date field and select the desired date or a period).
![]()
![]()
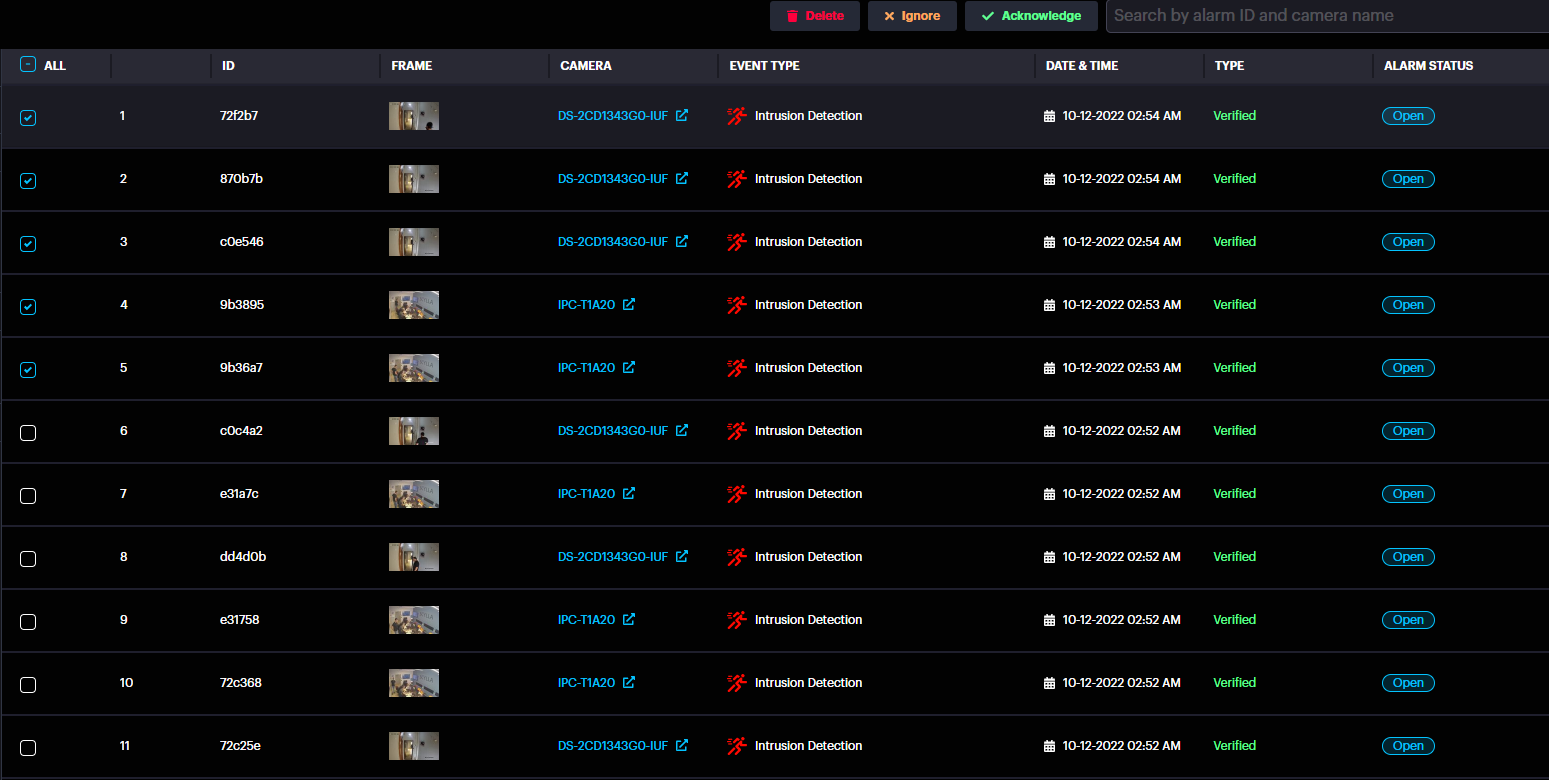
You can also delete multiple alarms by selecting the checkboxes on the left and clicking the Delete button.
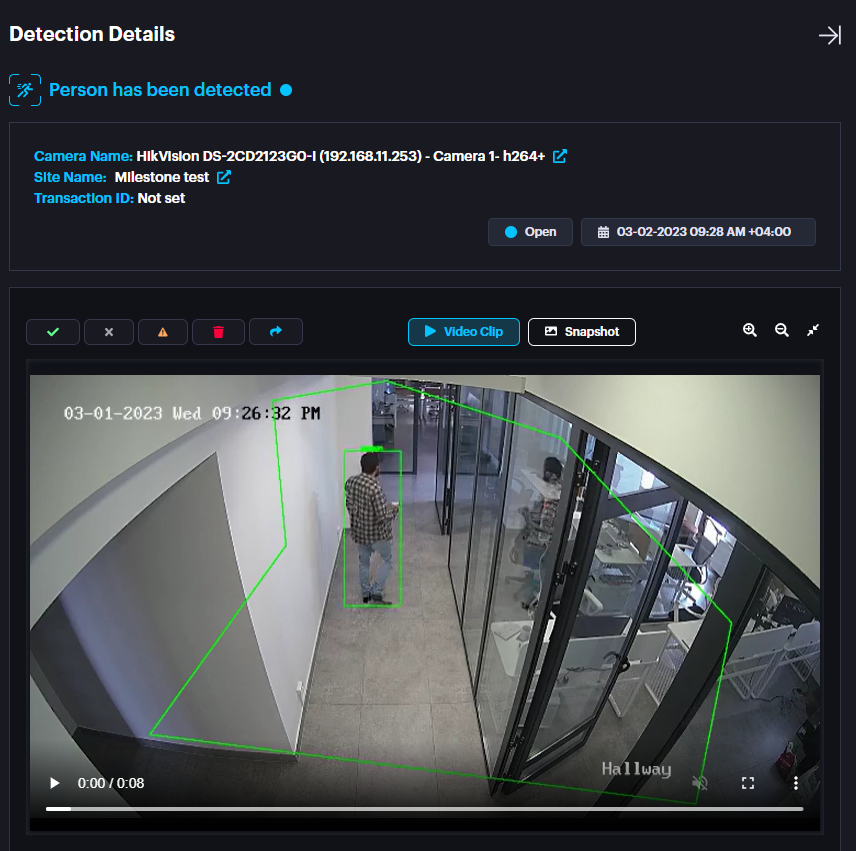
Alarms

Alarm Management
Alarm Management dashboard allows to:
- see all alarms from all integrated devices with detailed information;
- see the snapshot of the detection occurrence;
- see the recording of the alarm (if available);
- acknowledge, Dismiss, Marks as False and Share the alarm;
- search by alarm ID, Event Type and Labels;
- sort alarms by date or a period of time. see all alarms from all integrated devices with detailed information;
see the snapshot of the detection occurrence;
see the recording of the alarm (if available);
acknowledge, Dismiss, Marks as False and Share the alarm;
search by alarm ID, Event Type and Labels;
sort alarms by date or a period of time.
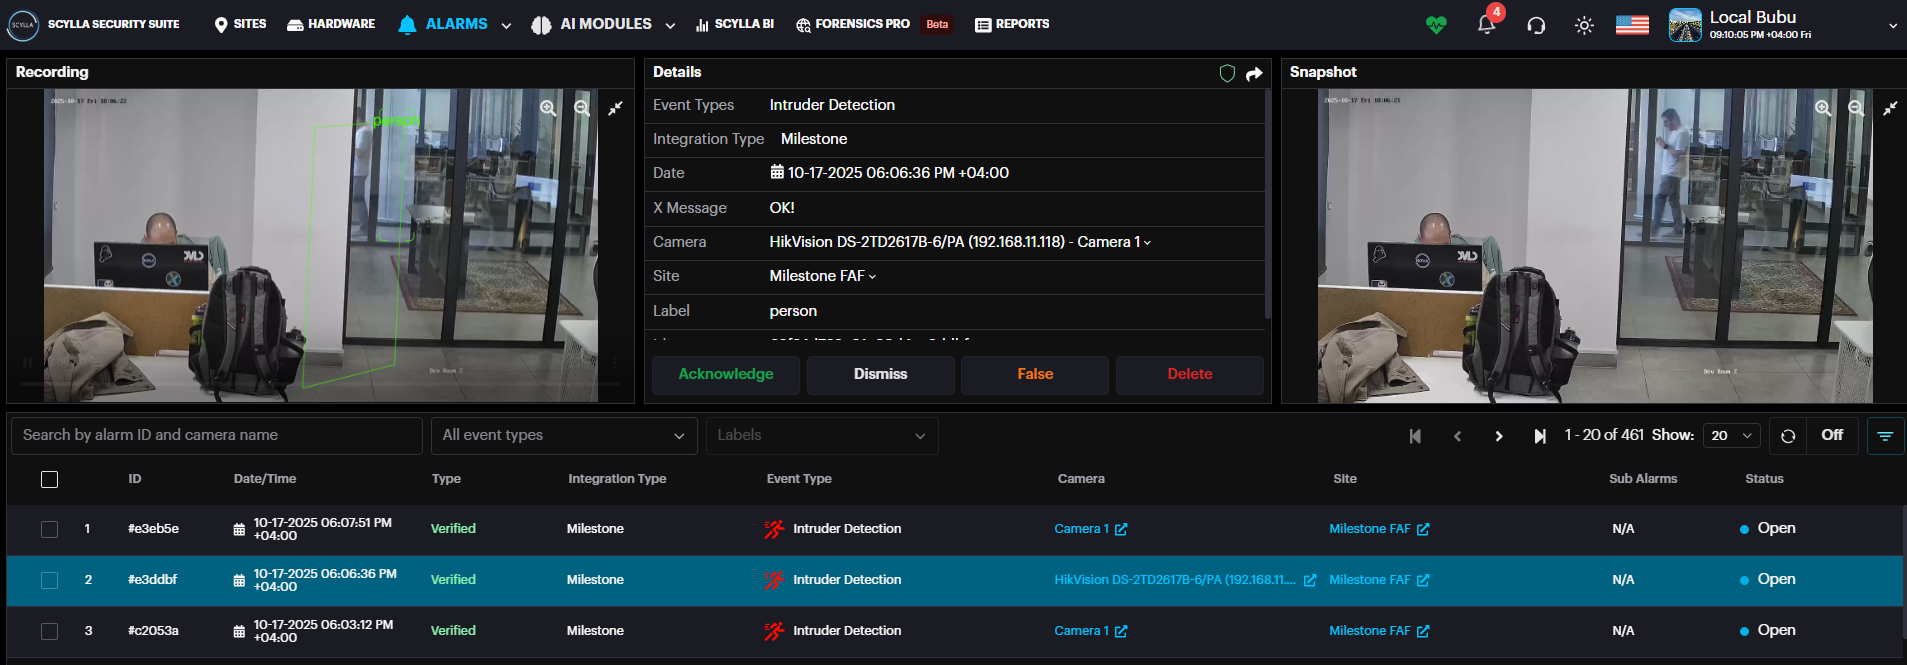
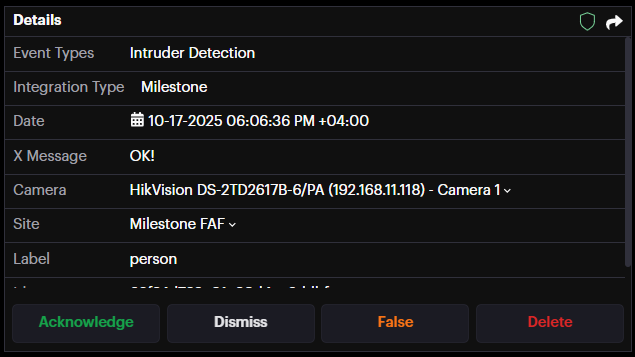
Select the desired alarm. You can see the snapshot of detection occurrence, and a recording (if available).
![]()
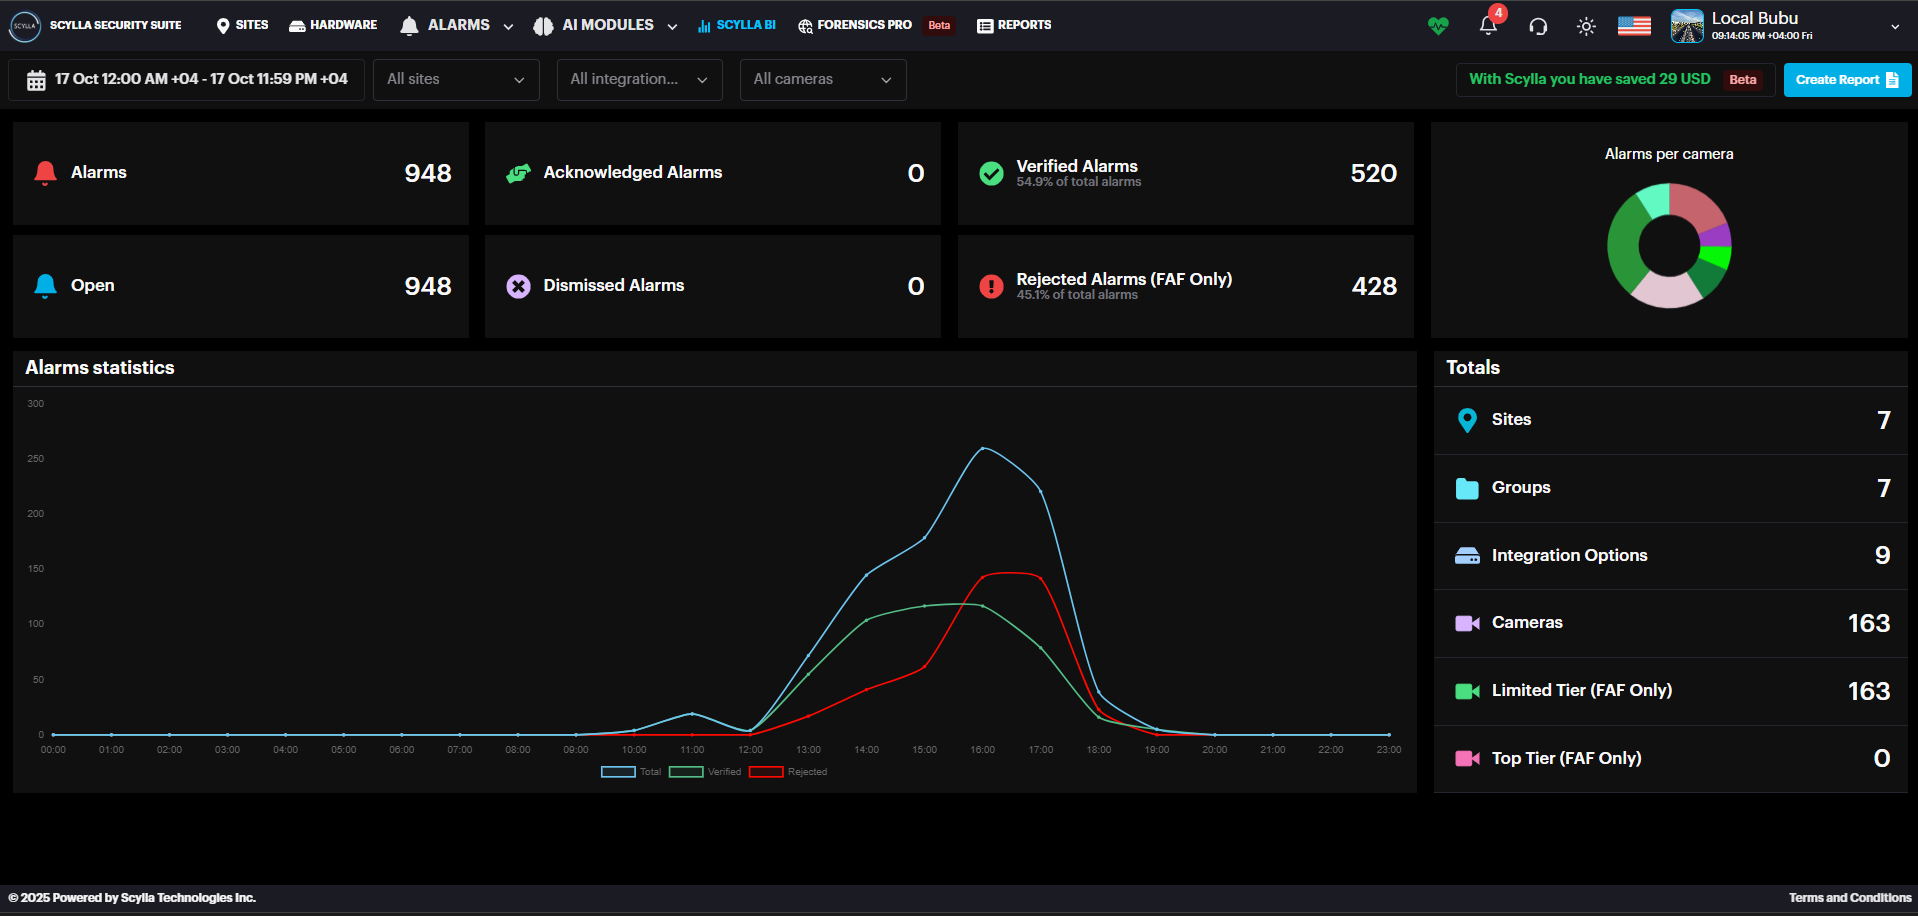
SCYLLA BI
On the SCYLLA BI page you can see the amount of:
- Confirmed alarms
- Rejected alarms
- Acknowledged alarms
- Dismissed alarms
- Alarms
- Open alarms Confirmed alarms
Rejected alarms
Acknowledged alarms
Dismissed alarms
Alarms
Open alarms
On Totals windows you can see the amount of
- Sites
- Groups
- Integration Options
- Cameras Sites
Groups
Integration Options
Cameras
You can also see the Alarms Per Camera ratio.
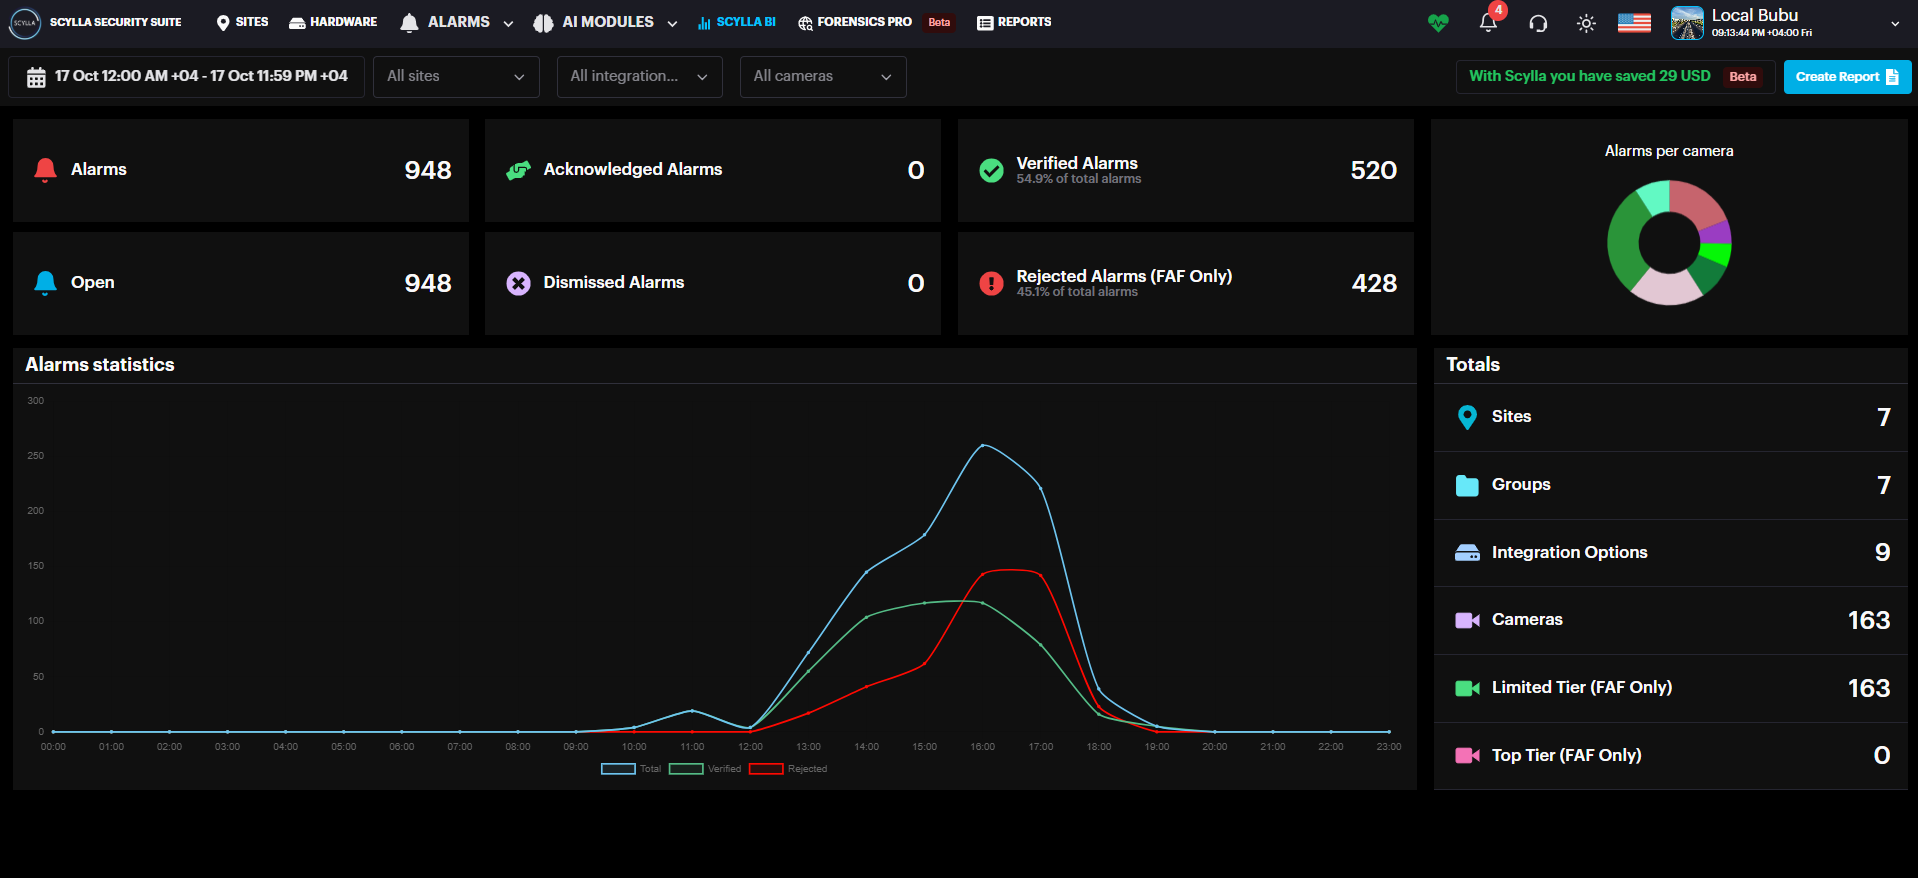
You can filter statistics by selecting a specific site, group, integration option, camera, and a time range (Today, Yesterday, This Week, Last Week, This Month, Last Month) or specify a Custom time range.
Graph displays a total number of alarms (blue), number of confirmed alarms (green), and number of rejected alarms (red).
Reports
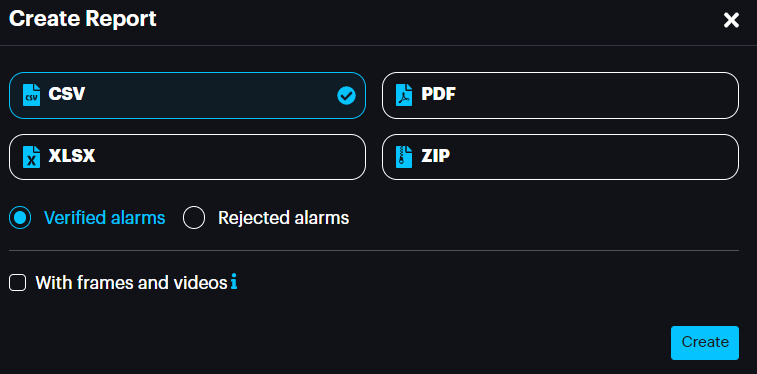
To create a report, go to the Statistics page and click Create Report.
Then, in the Create Report pop-up menu, select the desired report format (CSV, XLSX, PDF, or ZIP).
Select the With frames and videos checkbox if you want to have alert frames and videos of detection occurrences in addition to the report file.
Select either the Rejected alarms or Verified alarms radio button if you want to have rejected alarms or confirmed alarms in addition to the report file.
Click Create.
After the report was created successfully, click Check Reports.

Or go to the Reports page. Here you can see all your generated reports.
You can filter your reports by Type (format: JSON, XLSX, CSV, PDF), Date/Time, Status (Processing, Done, or Failed), and sort by presence of absence of alert frames of detection occurrences and rejected alerts.
![]()
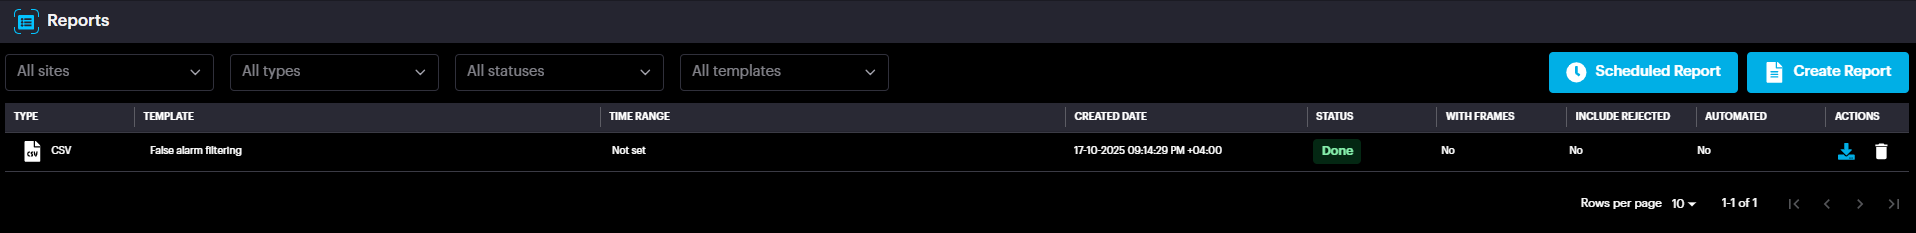
You can also create a report from this page by clicking the Create Report button.
On the Create Report pop-up select the report generation type (once or recurrently), desired date or a period specify settings for your report and click Submit
![]()
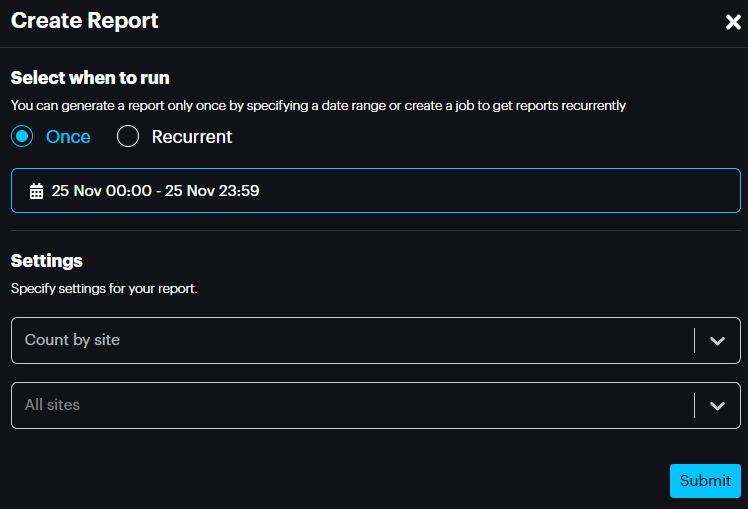
You can also check for the scheduled reports and add a new one by clicking the Scheduled Reports button.
On the Scheduled Reports pop-up click on Add button, then on Create Report page select the report generation type (once or recurrently), settings for your report and click Submit
We value and appreciate your feedback. If you have any questions or suggestions, please contact support@scylla.ai or submit a request to the Scylla Help Center at https://support.scylla.ai/portal/en/home.