User Manual
Introduction
This manual provides an overview of Scylla On-Premises device features and configuration guidelines.
Login
To use Scylla On-Premise server, login to the dashboard. The Dashboard is accessible by typing the IP address of the Asteria L server in your browser’s address bar.
If the user is already authenticated in the browser, the main Dashboard home page will appear.
If not logged in, enter your Username and Password into the corresponding fields and click the Login button.
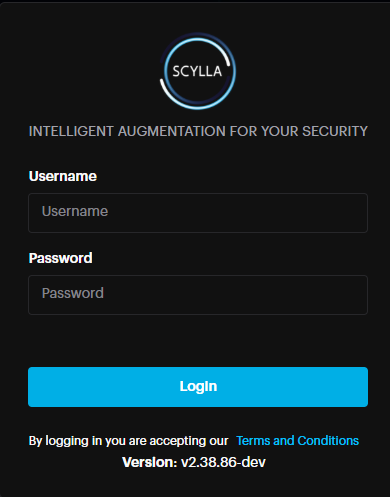
After successfully logging in, you will be redirected to the Dashboard.
If you are not redirected to the Dashboard page, there are two possible reasons:
- NOTE. Please be attentive while entering your username and password into the fields. Make sure to have not copied any additional characters or left leading spaces.Example of leading spaces:Wrong: “ username” has leading spacesCorrect: “username” does not have any leading spaces.The “Invalid credentials” error message appears, either the username or password is incorrect. NOTE. Please be attentive while entering your username and password into the fields. Make sure to have not copied any additional characters or left leading spaces.Example of leading spaces:Wrong: “ username” has leading spacesCorrect: “username” does not have any leading spaces.The “Invalid credentials” error message appears, either the username or password is incorrect.
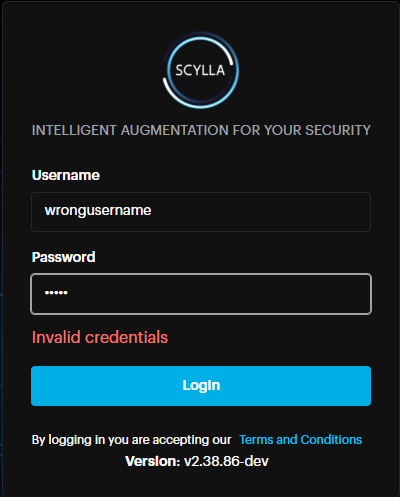
Double-check and reenter your credentials. If this message appears again, contact your administrator.
- If authentication fails but there is no error message, it is recommended to clear the browser’s cache and try again. See this article for detailed instructions on how to clear any browser’s cache. In the even that clearing the cache does not solve the problem, please submit a request on the Help Center. If authentication fails but there is no error message, it is recommended to clear the browser’s cache and try again. See this article for detailed instructions on how to clear any browser’s cache. In the even that clearing the cache does not solve the problem, please submit a request on the Help Center.
Scylla Security Suite
Home Page
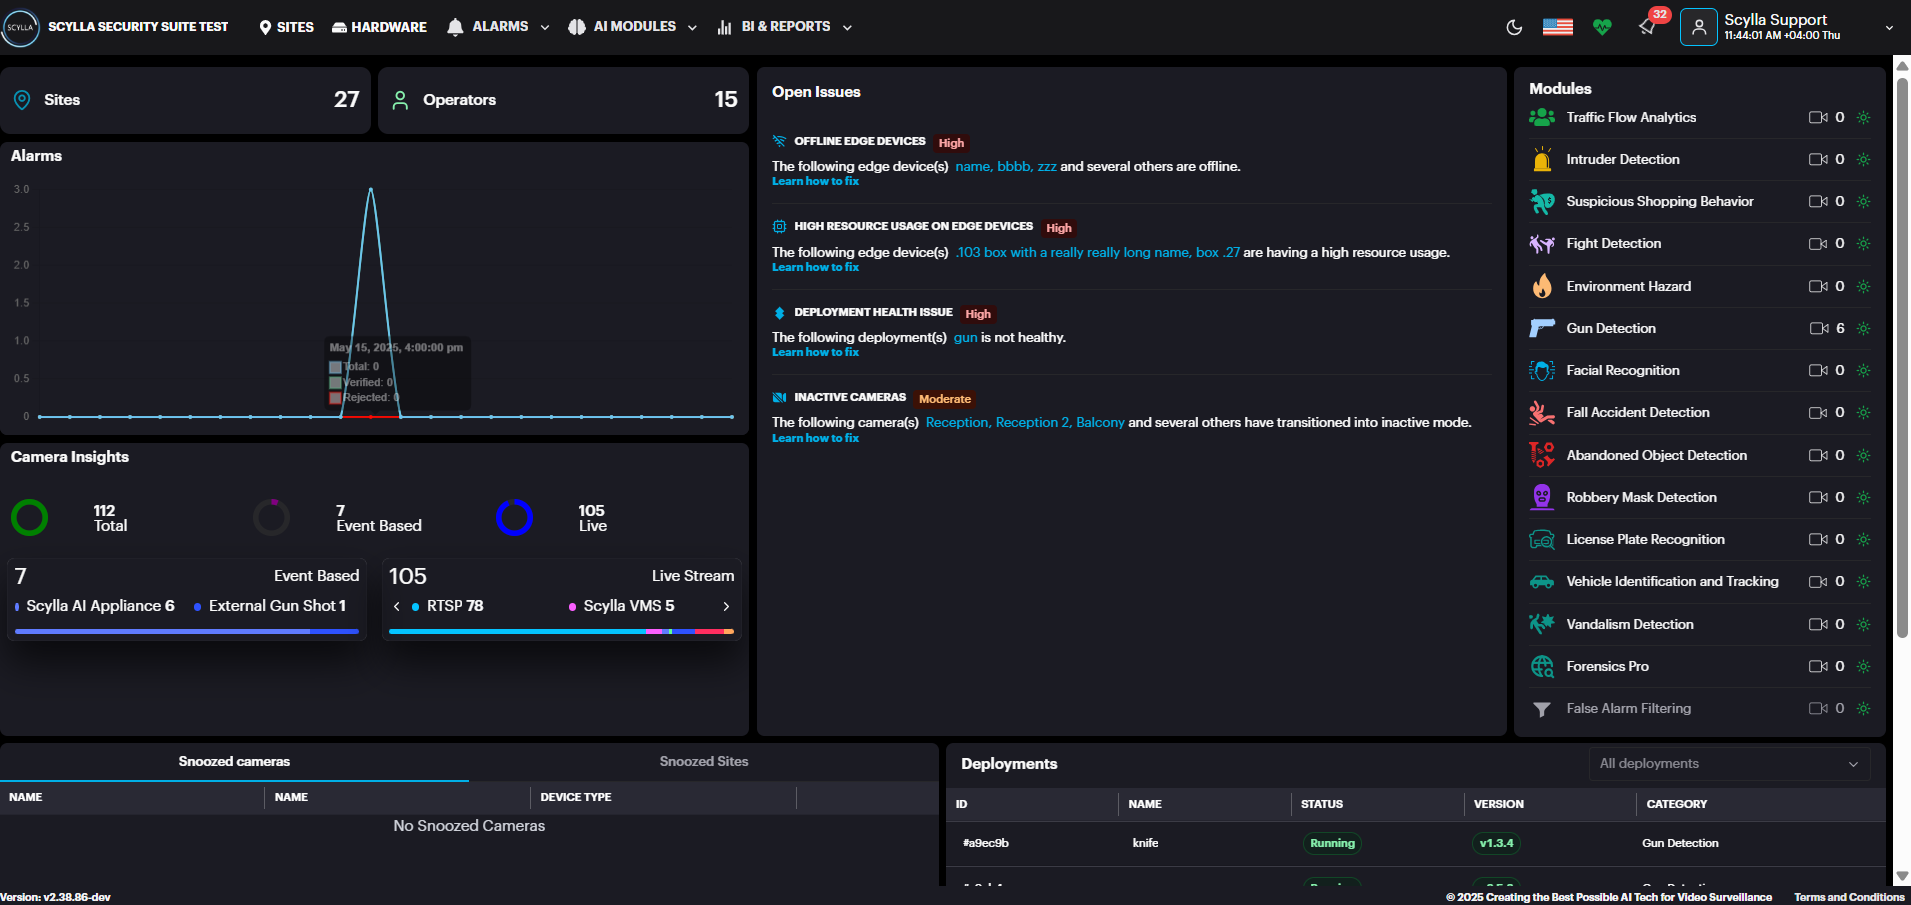
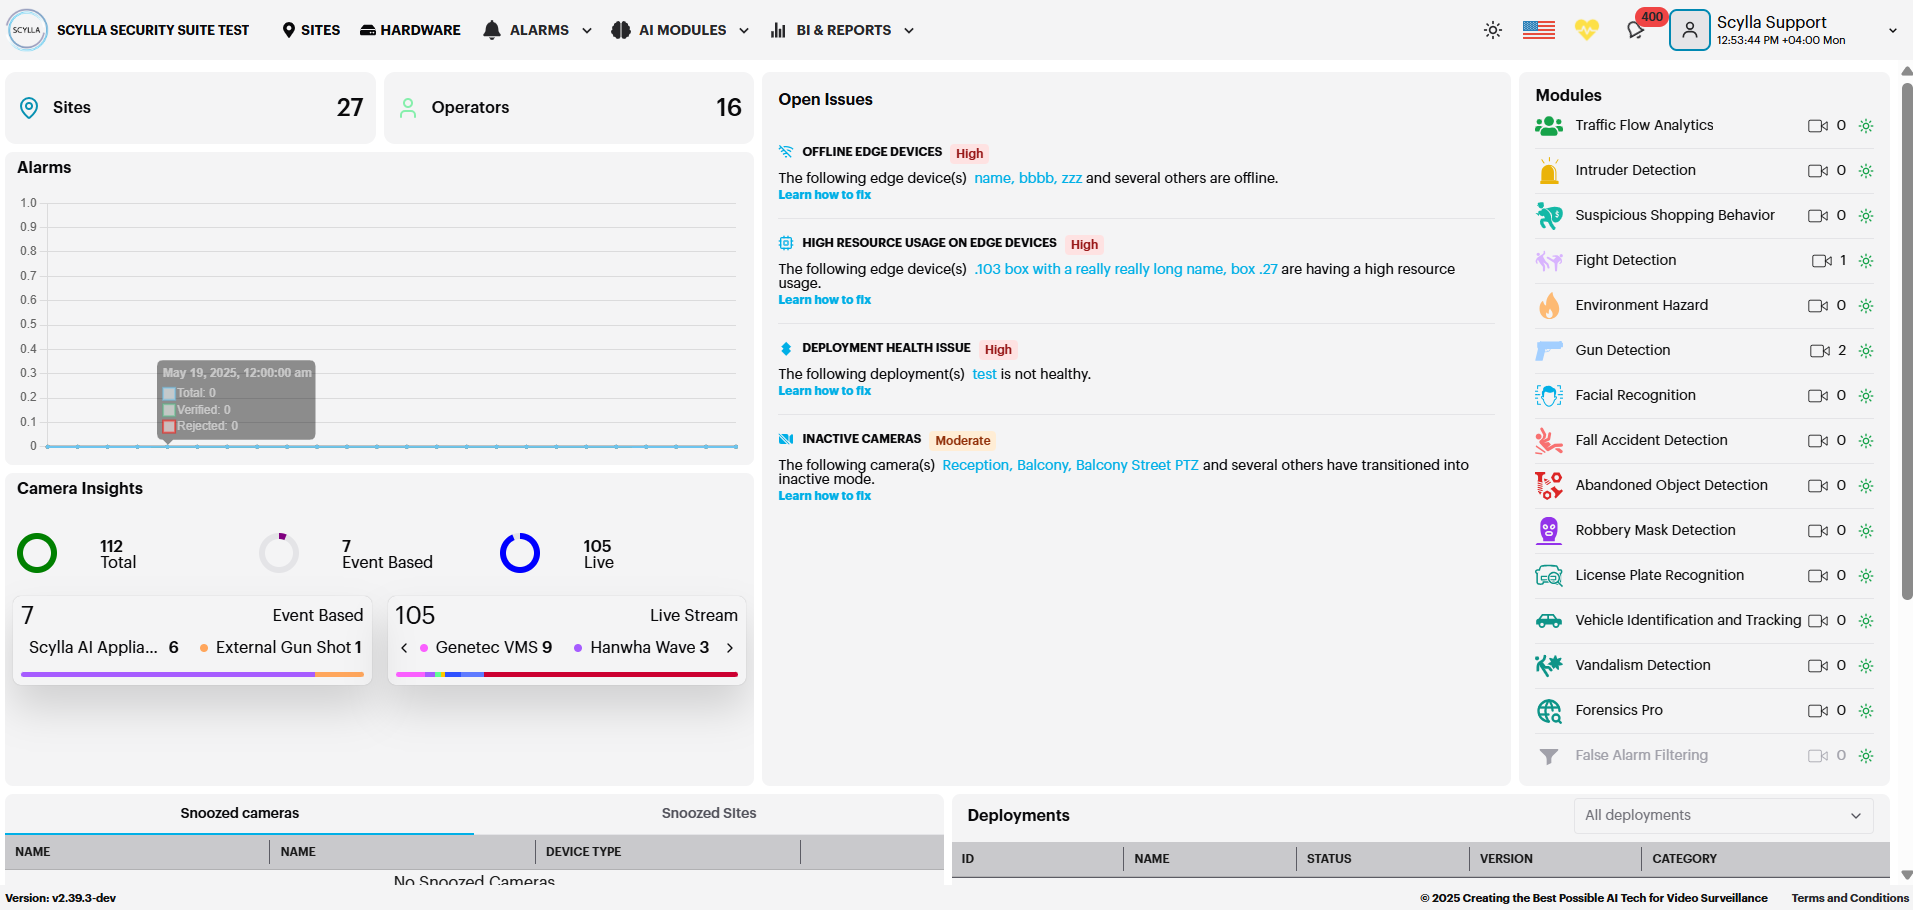
On the Home page you can see general information, such as the total number of connected cameras, running engines, recent alarms, active modules, and deployments.
In the Modules right window, you can see all connected modules.
You can click on the module that is active and has connected cameras to open its Toolbar page.
In the Open Issues middle window, you can see issues related to deployment, camera, edge device and software health that may impact the normal operation of the system.
Clicking on the issue will take you to the corresponding page for further investigation.
In the Snoozed bottom window, you can check the Snoozed cameras and Snoozed sites if any.
In the Deployments bottom right window you can view the active deployments with their info (ID, status, AI module).
On the Top-right side under the username you can see the time with timezone, also you can add timezone per site, so if you have a company with multiple sites and each site in a timezone , you can manage it.
Incident Widget & Notifications
Open Issues provides users with notifications about all open issues that may impact the normal operation of the system. This ensures users are promptly alerted to potential problems.
Each issue displayed includes:
- Severity Level
- Description
- Steps to Resolve Severity Level
Description
Steps to Resolve
Types of Issues Covered:
- Failed Deployments
- Stale Cameras
- Deployment Health Issues
- Offline On-Prem Systems
- High Resource Usage on Edge Devices
- Software Health Issues on Edge Devices
- Software Issues on Remote On-Premise Instances Failed Deployments
Stale Cameras
Deployment Health Issues
Offline On-Prem Systems
High Resource Usage on Edge Devices
Software Health Issues on Edge Devices
Software Issues on Remote On-Premise Instances
Note: Users can configure the Stale Camera issue threshold (number of days) via the Settings -> Preferences page. Once the defined threshold is exceeded, the issue will appear in the Incident Widget.
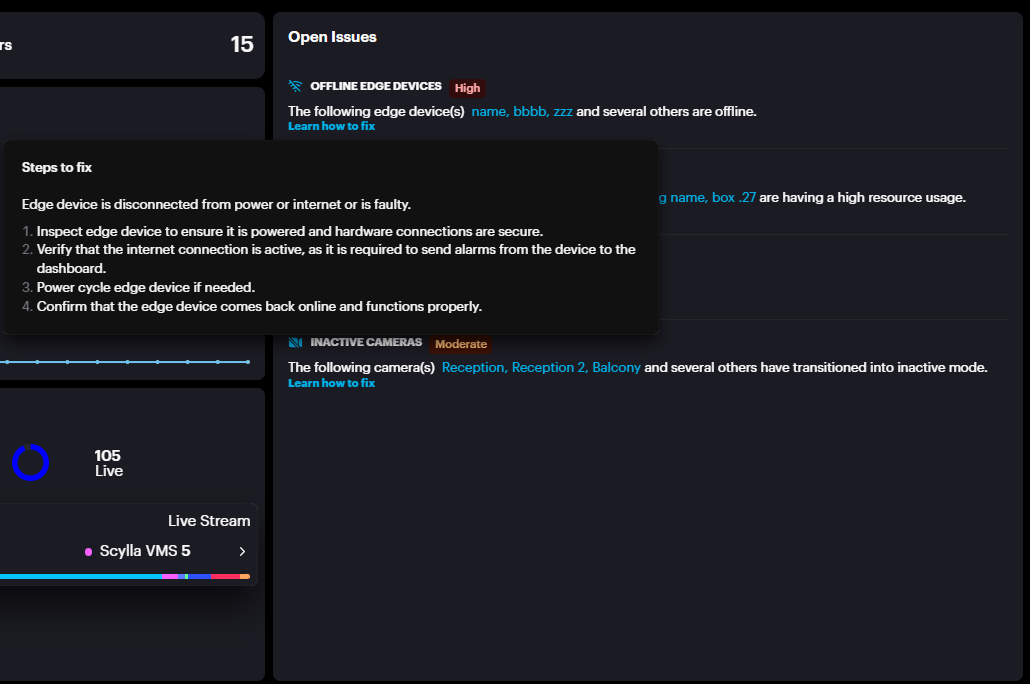
In the above example, let’s consider the first issue, Offline Edge Devices.
Clicking on Learn how to fix provides detailed steps to resolve the issue. Additionally, clicking on the box name redirects you to the Health Dashboard → Edge Deployments, where you can view the last sync time of the Asteria box with the cloud.
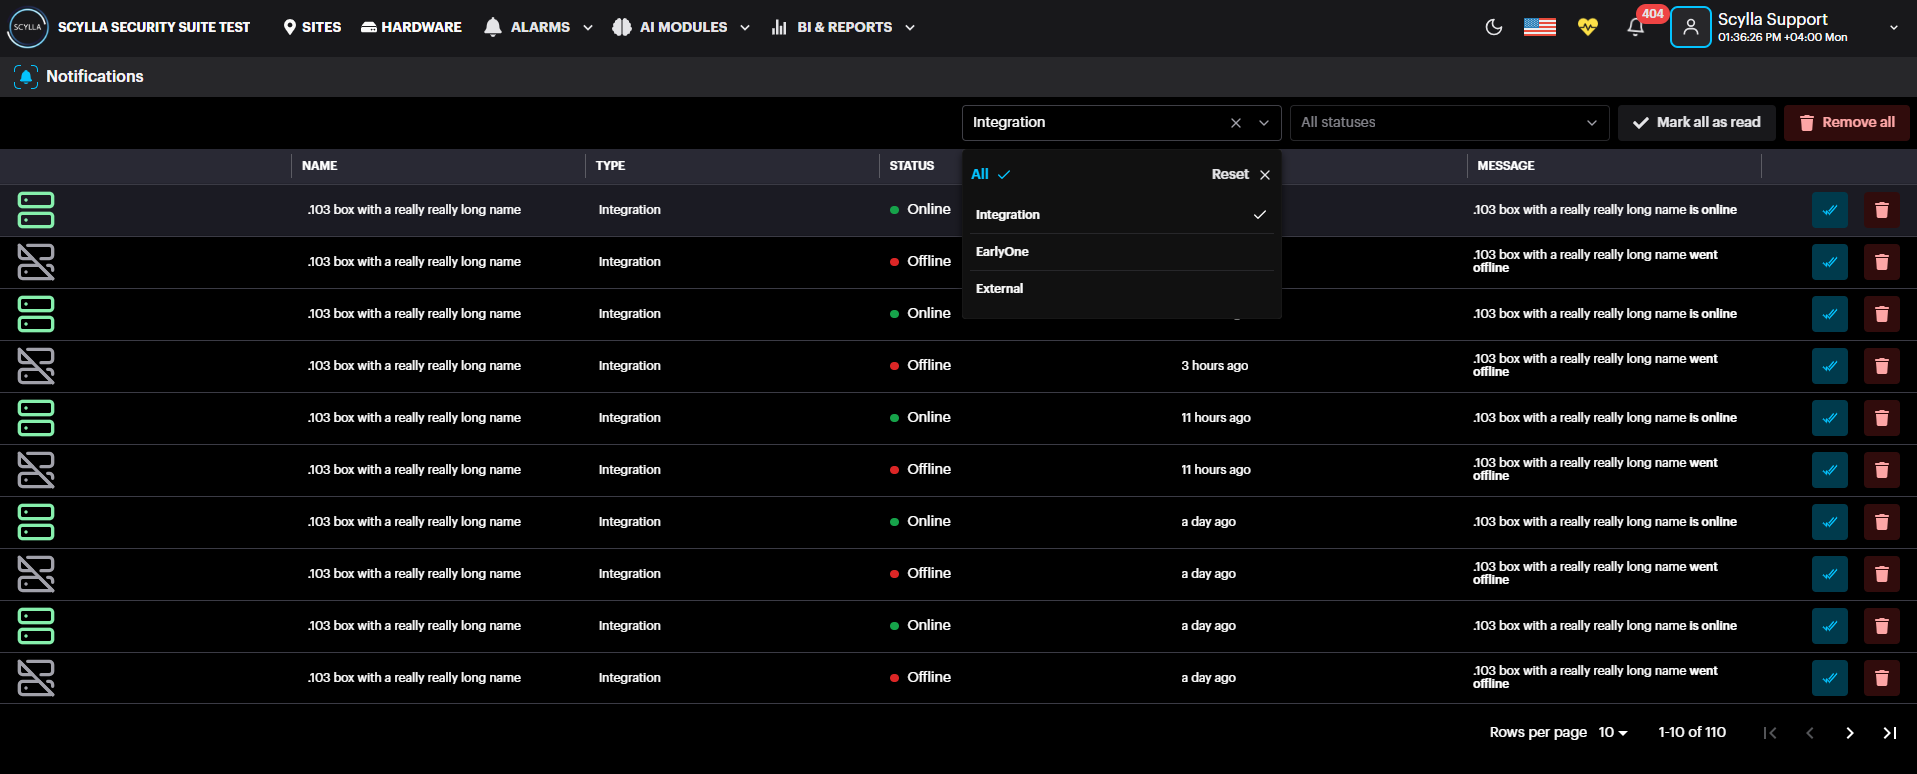
All notifications are stateful, meaning the system keeps a history of past events. You can review your recent notifications at any time from the notification menu.
- To view recent events, simply click on the notification icon. To view recent events, simply click on the notification icon.
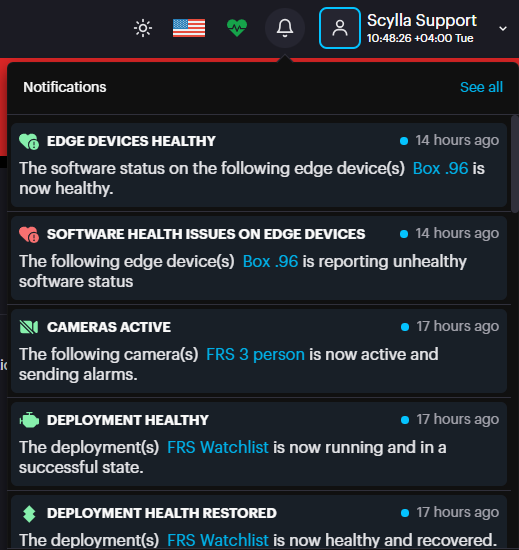
- To see your full notification history, click on See All. This will take you to the Notifications page. To see your full notification history, click on See All. This will take you to the Notifications page.
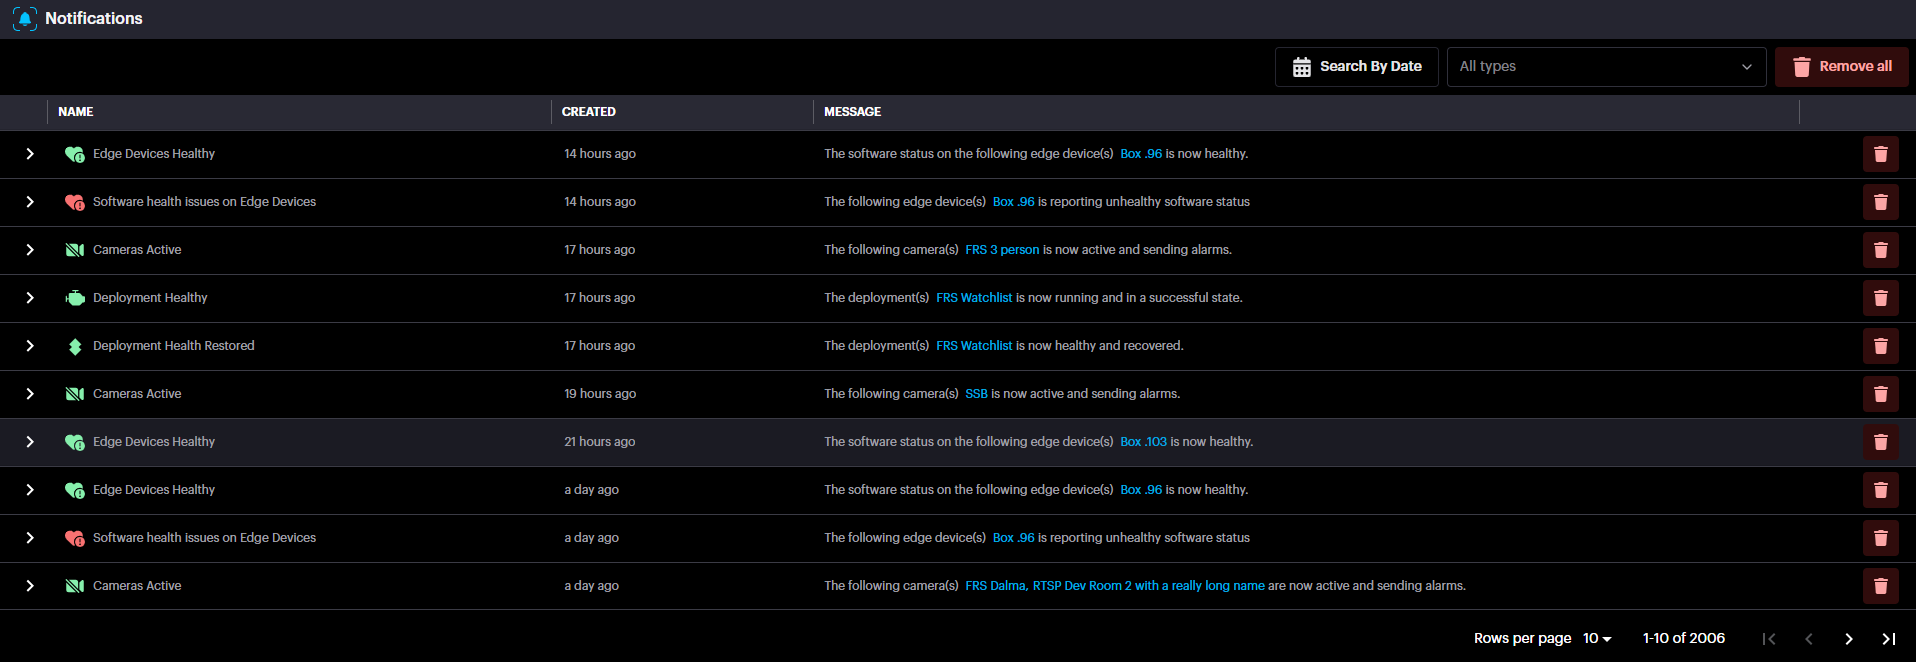
Events are grouped by their type. To see more information about an event, such as its source or the time it occurred, simply expand the group by clicking on it.
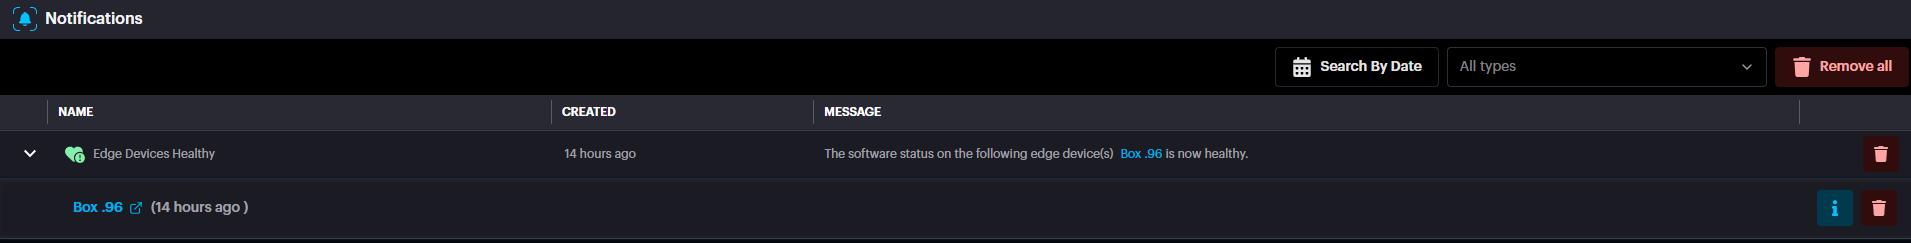
To see more details about a specific event or to access filtering options, simply click the Info button.
Moreover , it is possible to trigger email notifications from Account Menu à Settings à Notifications.
Sites
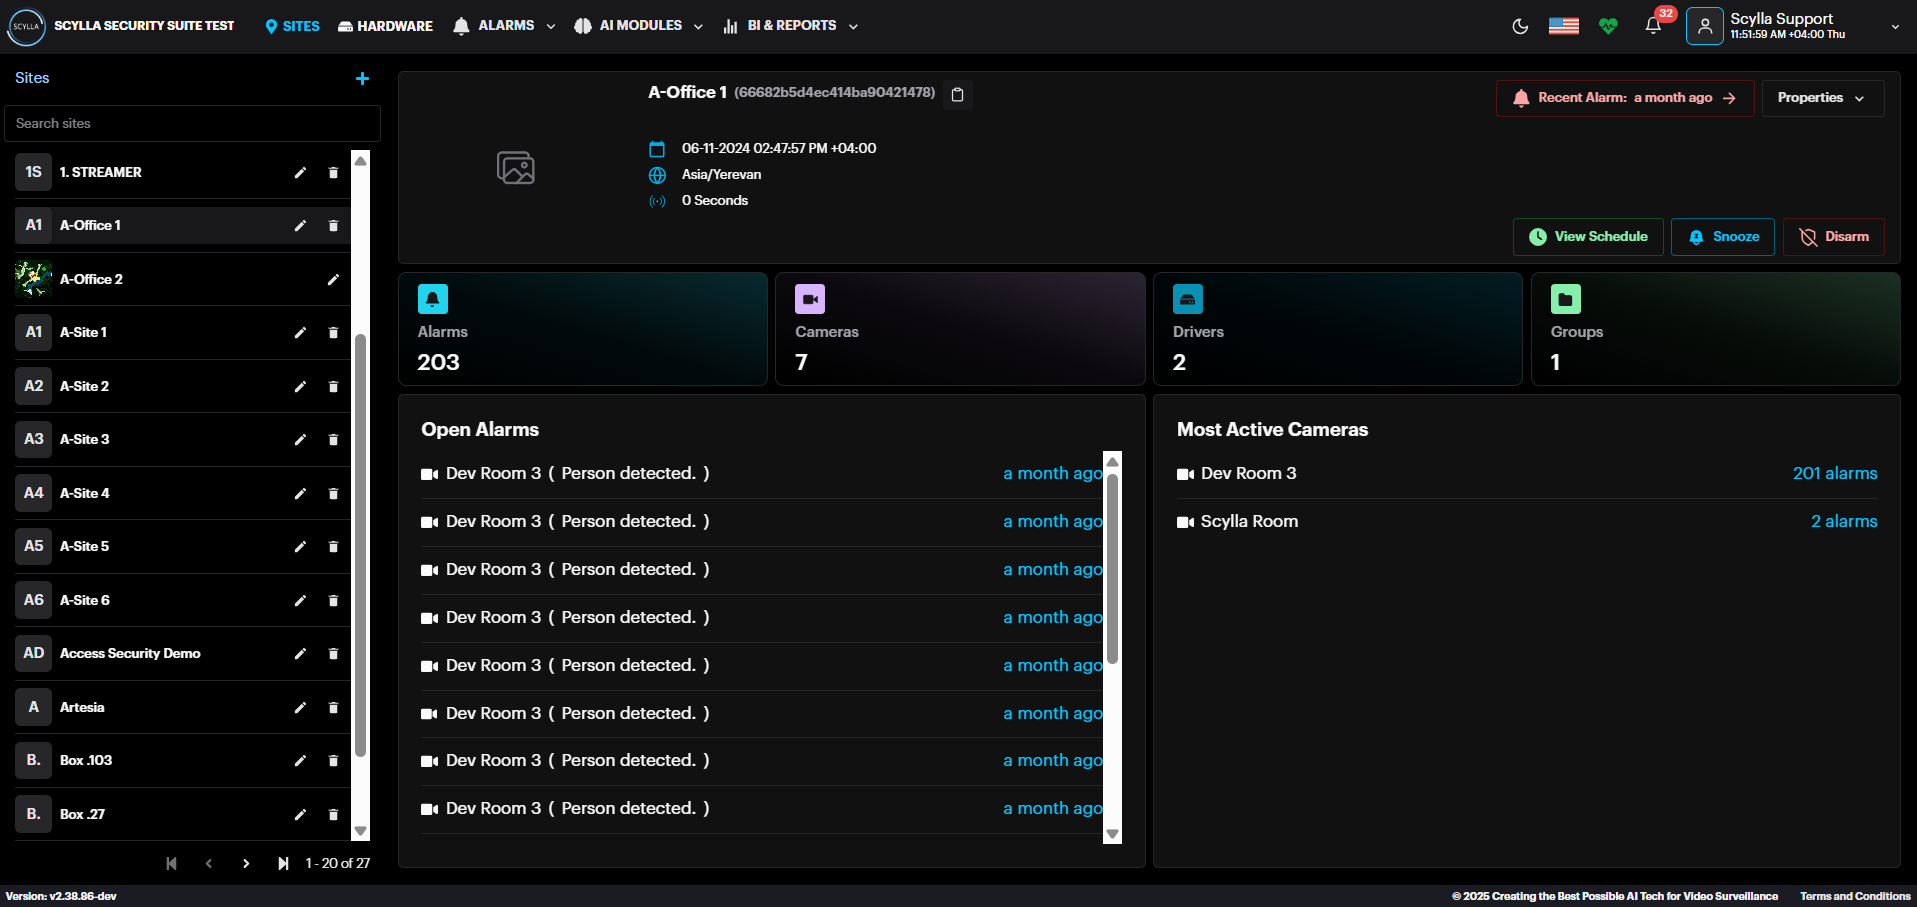
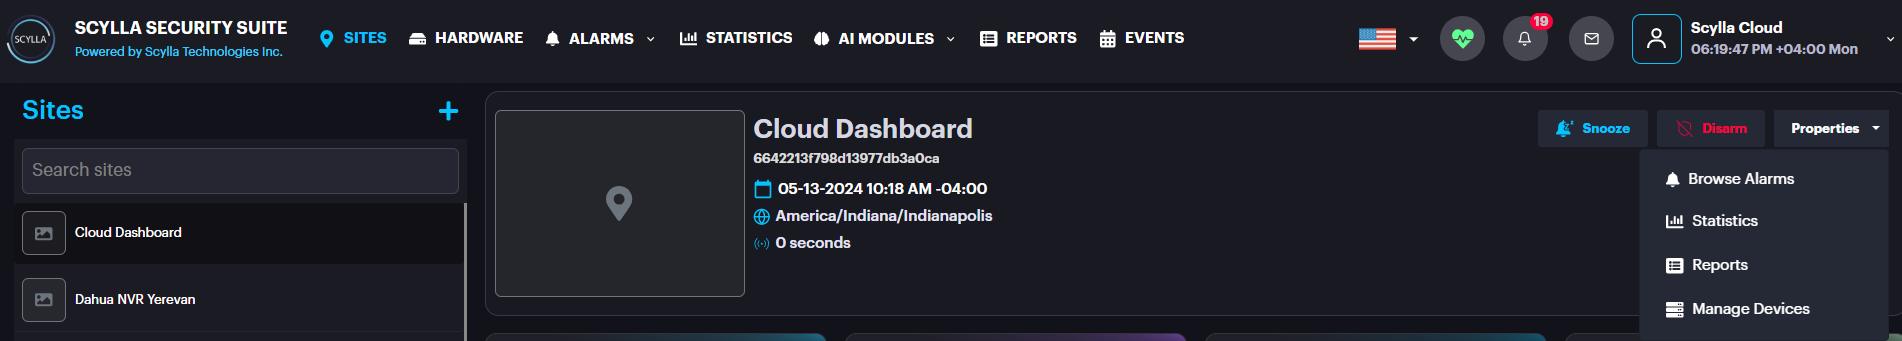
To access the Sites page, click the SITES button on the main toolbar, located at the very top of the dashboard. A list of all sites is presented in the first window (right). Click on each site to see the following stats and options:
- Site name and creation date
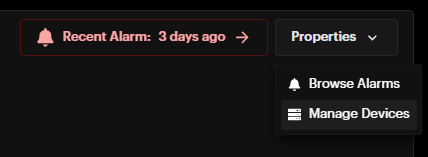
- Recent alarm — info about the most recent alarm (in red message)
- Snooze — select the type of alarm notification’s snooze action and the duration
- View Schedule- Info about the schedule of the selected site
- Disarm — disarm the detections from selected Site by specified duration or disarm/arm manually
- Alarms — number of recent alarms
- Cameras — number of connected cameras
- Drivers- number of drivers
- Groups — number of groups
- Open Alarms — window containing the most recent alarms. Click on the specific alarm to see the detailed information only for this alarm occurrence.
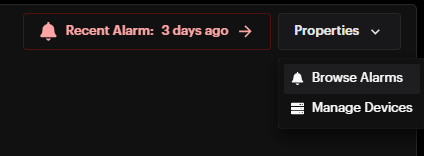
- Properties window:
- Browse Alarms — opens the Browse Alarms History page with all alarms for this specific site
- Manage Devices — opens the Manage Devices menu for this specific site
- Most Active Cameras — list of most active cameras and a total number of their alarms. Click on the camera to see its detailed information and settings from the Hardware menu Site name and creation date
Recent alarm — info about the most recent alarm (in red message)
Snooze — select the type of alarm notification’s snooze action and the duration
View Schedule- Info about the schedule of the selected site
Disarm — disarm the detections from selected Site by specified duration or disarm/arm manually
Alarms — number of recent alarms
Cameras — number of connected cameras
Drivers- number of drivers
Groups — number of groups
Open Alarms — window containing the most recent alarms. Click on the specific alarm to see the detailed information only for this alarm occurrence.
Properties window:
- Browse Alarms — opens the Browse Alarms History page with all alarms for this specific site
- Manage Devices — opens the Manage Devices menu for this specific site Browse Alarms — opens the Browse Alarms History page with all alarms for this specific site
Manage Devices — opens the Manage Devices menu for this specific site
Most Active Cameras — list of most active cameras and a total number of their alarms. Click on the camera to see its detailed information and settings from the Hardware menu
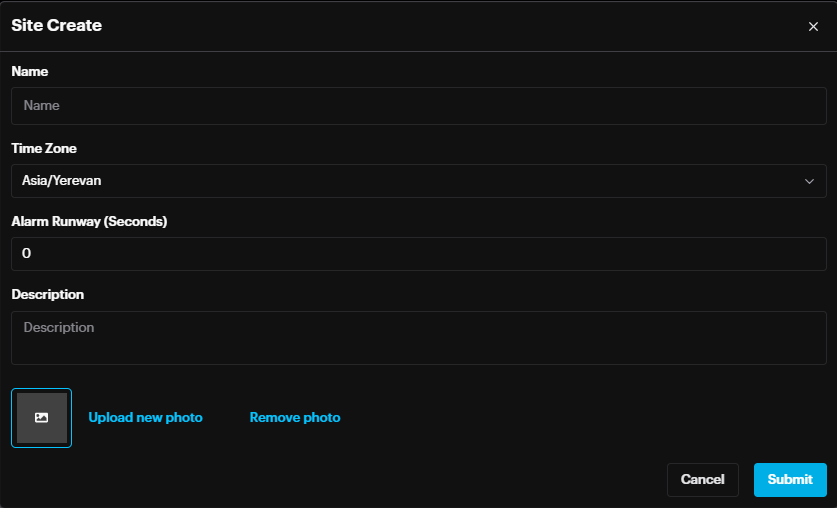
To create a new site, click the Add new site button (plus sign +).

In the Site Create modal window specify the new site’s Name, Time zone, Alarm runway and Description, Upload a photo if needed and Click Submit.
![]()
Enter the information into the corresponding fields and click Submit to save.
Alarm Runway/Cooldown
Alarm runway is a site-level setting that will group repeated alarms from the same camera withing the specified amount of seconds .
This will notify once but buffer all subsequent alarms under that one alarm.
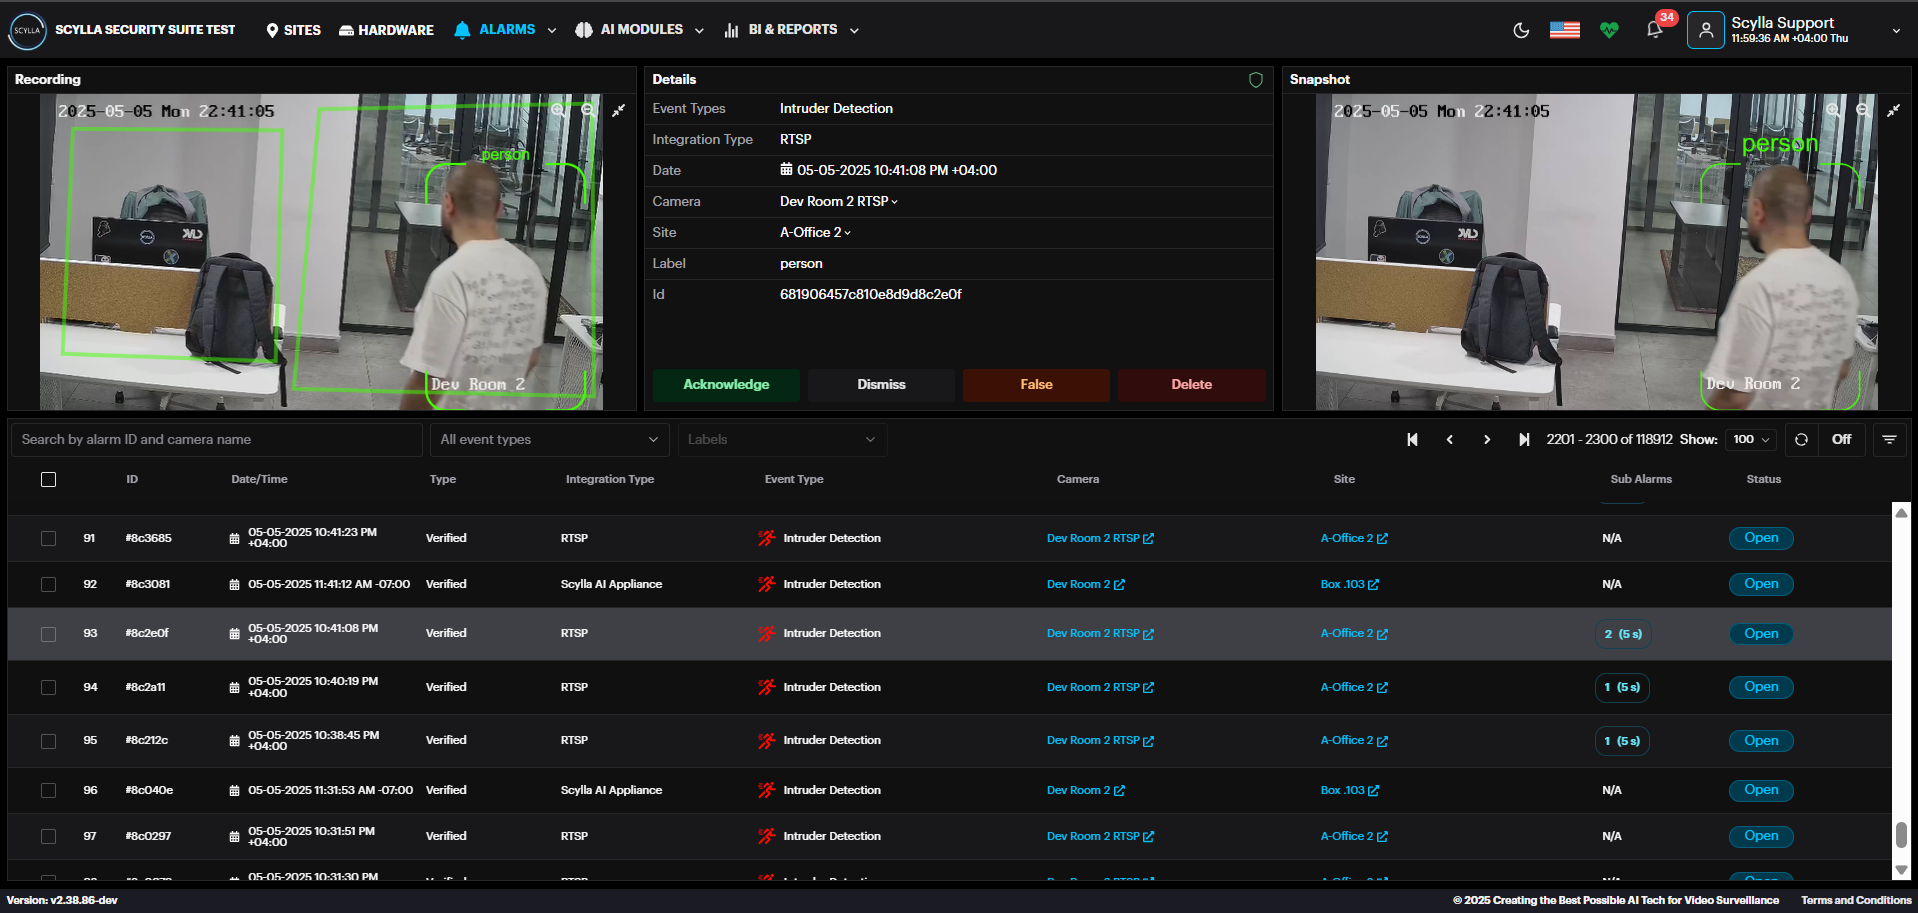
In the alarm record there is the Sub Alarms field, displaying the number of alarms detected within the specified alarm runway time.
By clicking the “2(0)s” which means 2 detections occurred within the specified time , a Sub Alarms window will pop up showing the detections.
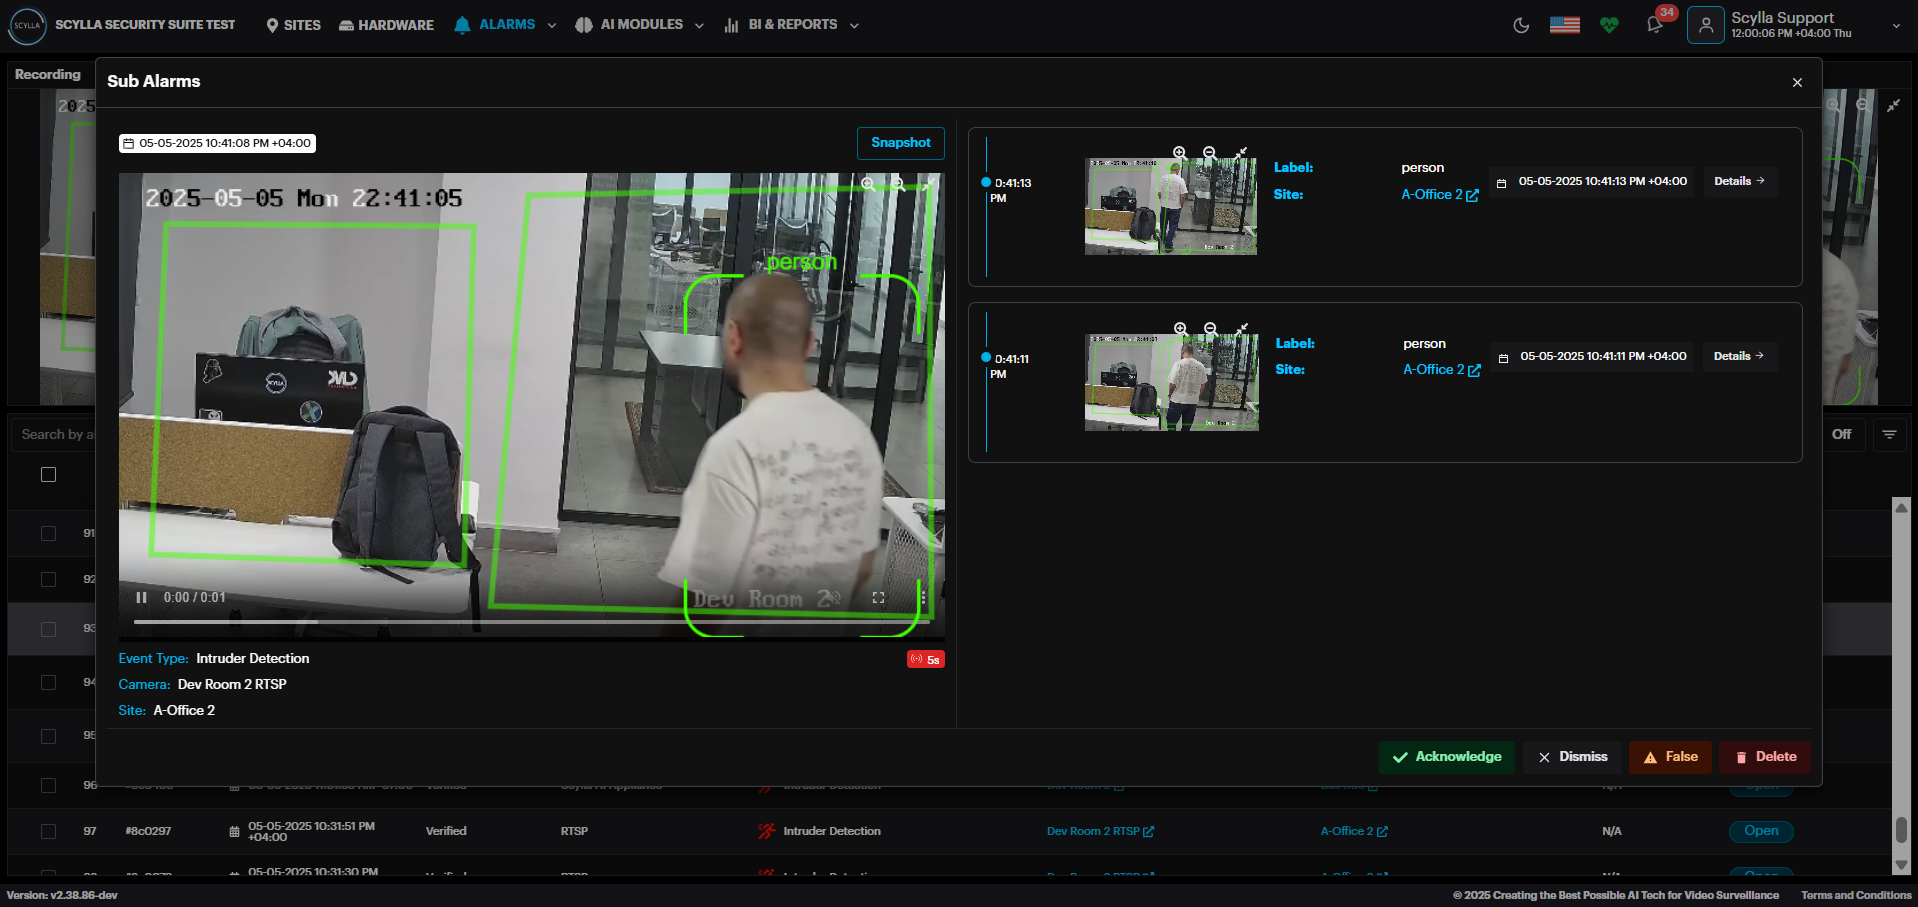
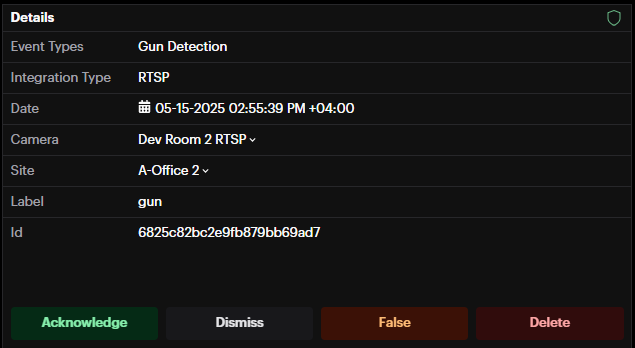
The main alarm is displayed here on the left.
Sub alarms are displayed to the right. Click the Details button for each sub alarm to view its details.
Acknowledge, Dismiss, mark as False, or Delete the alarm from this window.
Health Check
Health Check provides information about system health status (Error, Info, Warning) of node, deployment , camera etc.
It also displays the resource usage per node and per module.
The Health Check button is displayed on the top right corner.

![]()
![]()
![]()
![]()
To view details about the health, click on the health button.
Onsite Deployments
At the bottom, there are two deployment menus: Onsite Deployments and Edge Deployments for Asteria devices.
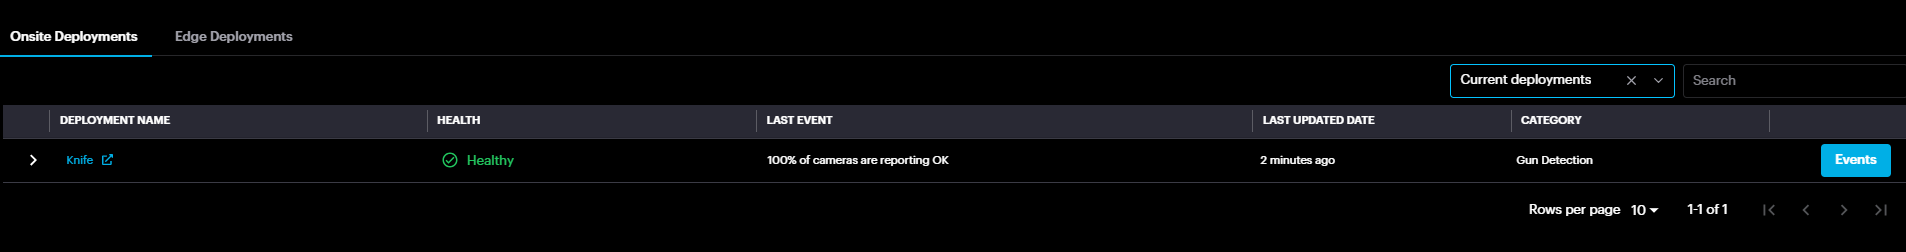
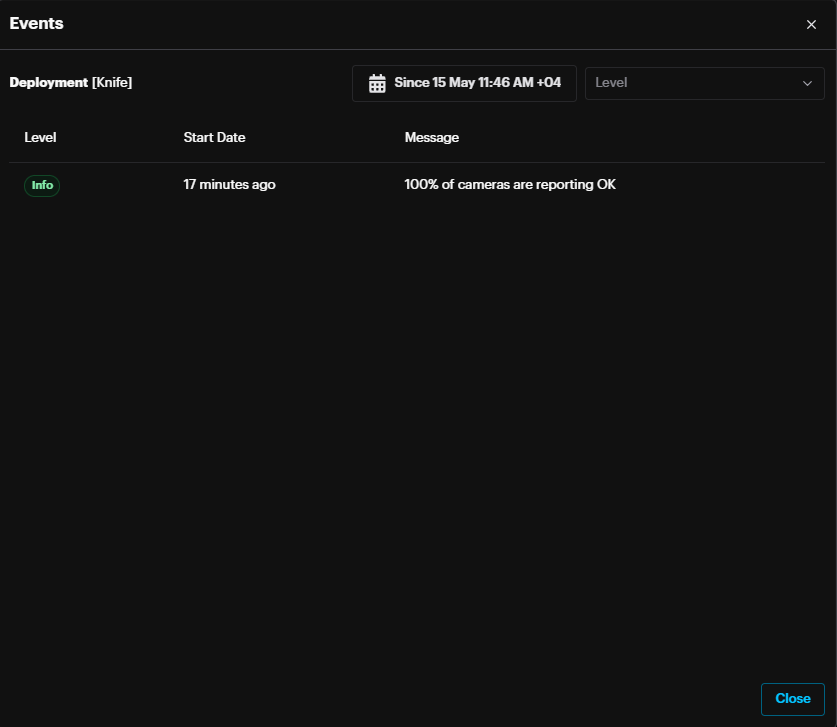
By clicking the Events button, deployment events window will pop up displaying Info , Error & Warning events.
Expand the deployment record to view the camera list and its health.
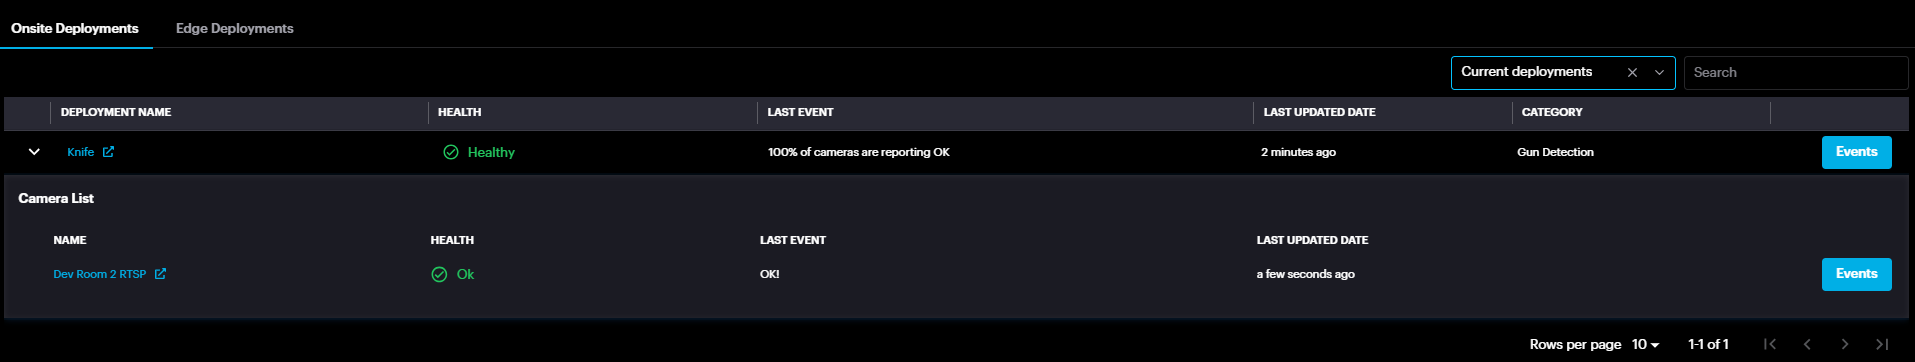
By clicking the Events button, camera events window will pop up displaying Info , Error & Warning events.
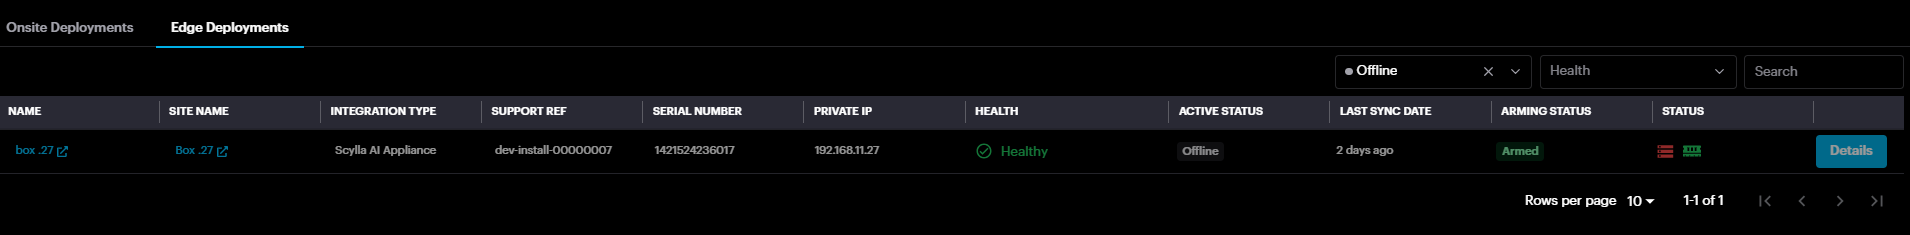
Edge Deployments
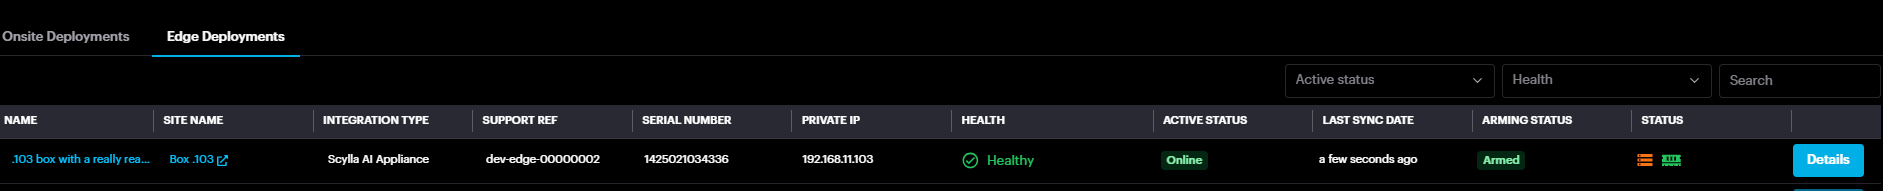
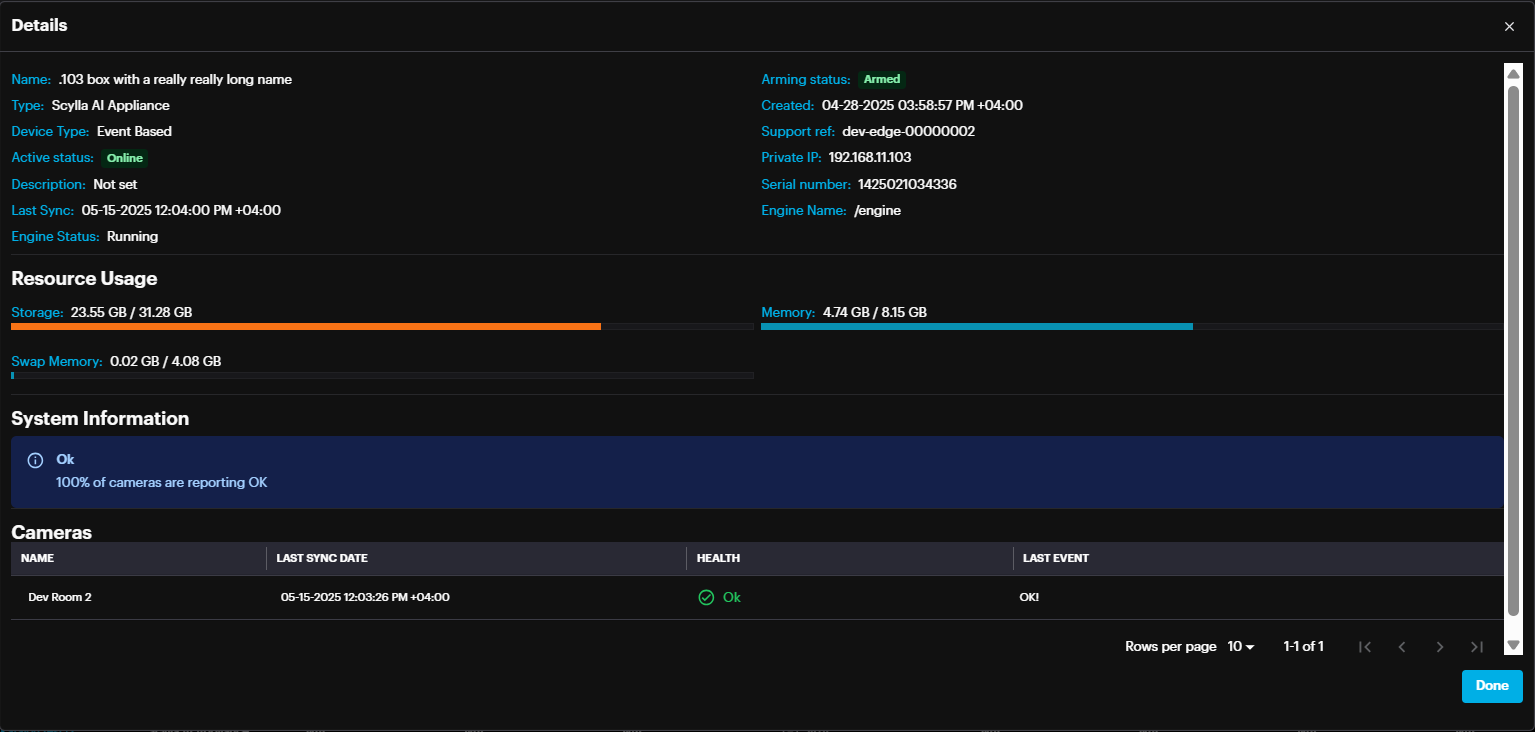
Under Edge Deployments, you'll find a list of Asteria devices connected to the on-premise server, along with their active status and arming status information. Clicking the "Details" button provides additional information about each Asteria device, including resource usage, connected cameras, and the health status of the cameras.
Browse Alarms History
From the Sites page select the desired site, then select Browse Alarms on the Properties
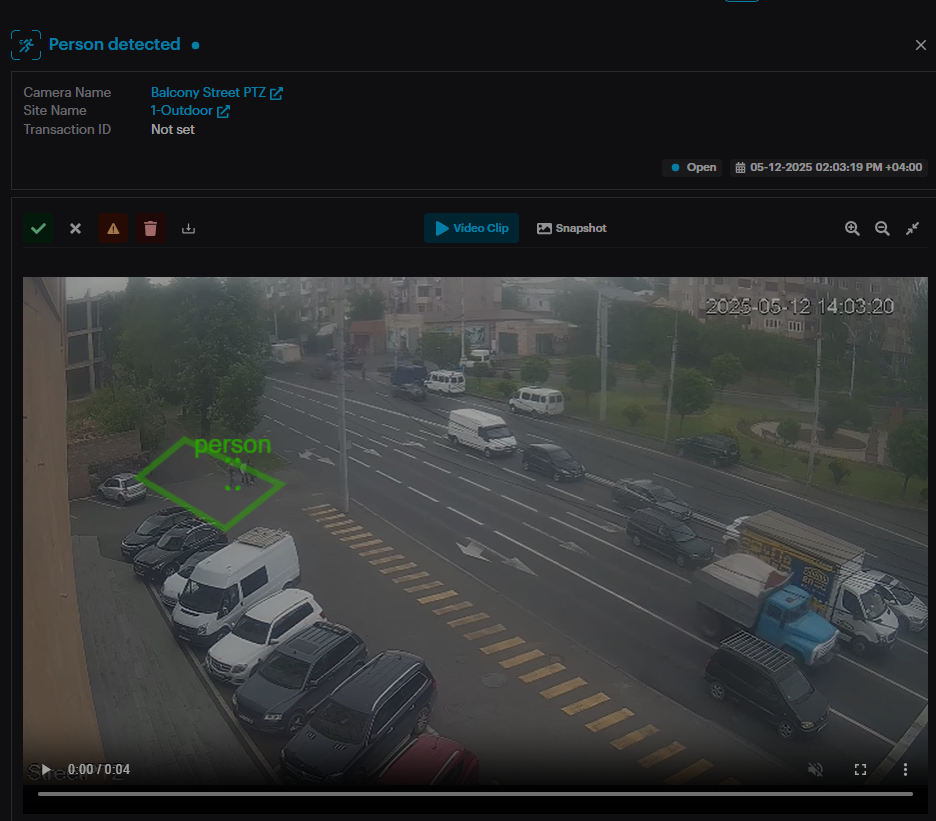
The Alarms history page displays detailed information for all alarm occurrences (such as Camera Name, and Transaction ID).
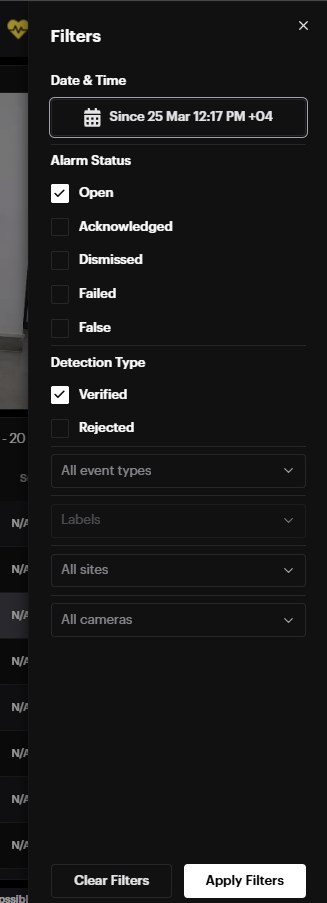
By default, the last alarm occurrence is selected, and its Detection Details window is open on the right side, and the Filters menu is open on the left side.
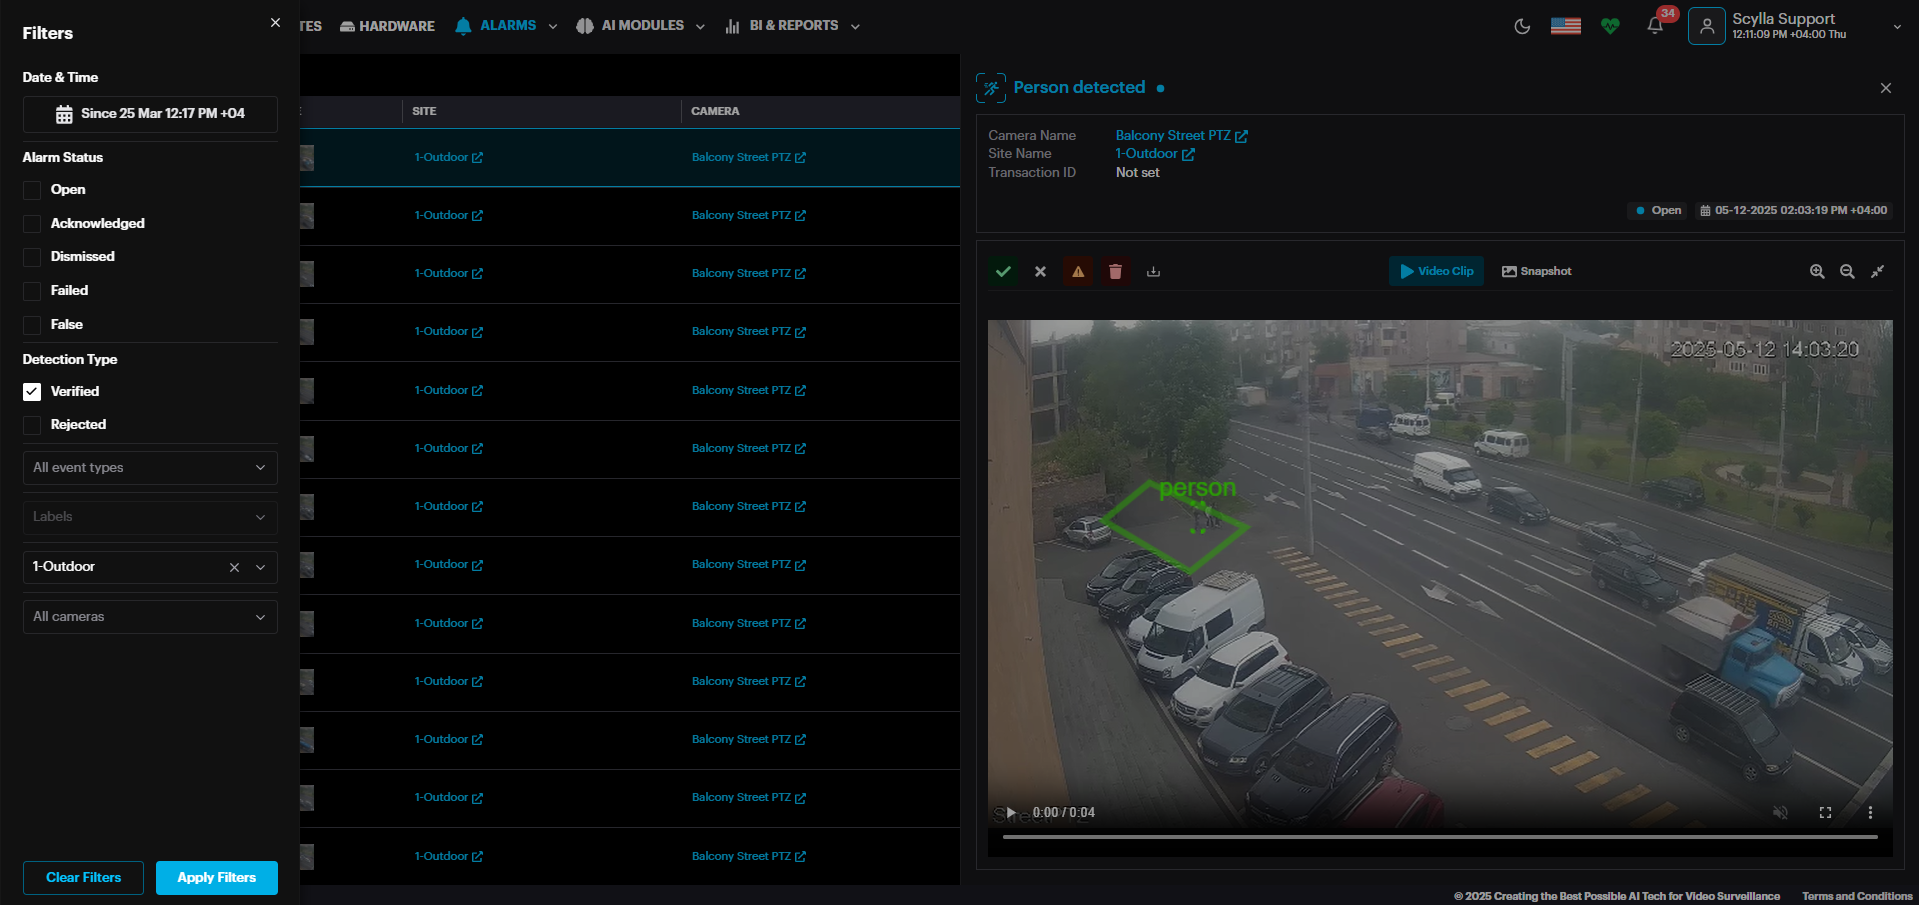
Click the Close Filters button to close the filters menu and click Open Filters button to open it again.
Filters allow filtering alarms by:
- statuses (open, acknowledged, dismissed, ignored, failed);
- type (verified or rejected); statuses (open, acknowledged, dismissed, ignored, failed);
type (verified or rejected);
-
event type; event type;
-
labels; labels;
-
sites; sites;
-
integration options; integration options;
-
cameras;
-
date & time (opens the calendar to click on the date field and select the desired date or a period). cameras;
date & time (opens the calendar to click on the date field and select the desired date or a period).
The number of filters currently in use is displayed next to Open filters
![]()
![]()
Click the Close Detection Details button to close the window.
Select multiple alarms or All alarms and perform the following: acknowledge, dismiss, false, delete or Create Report.
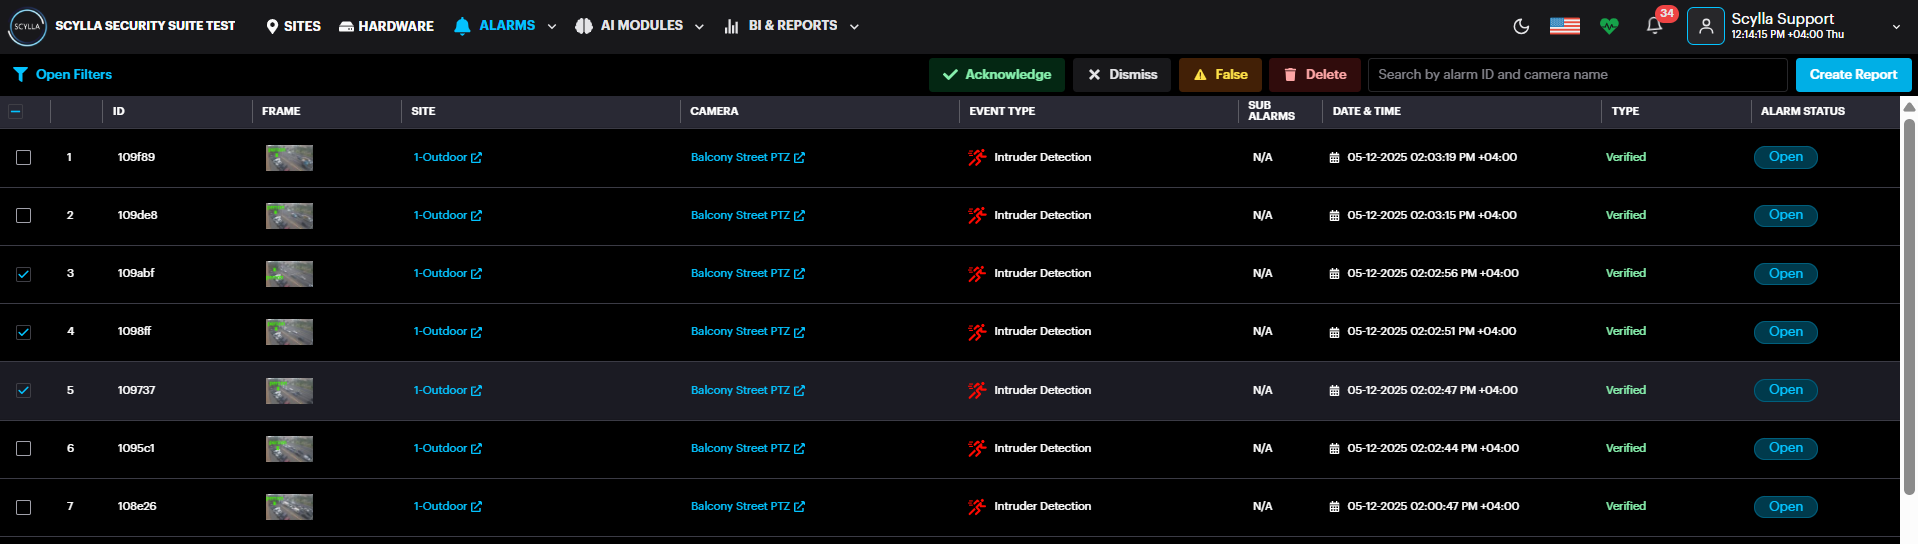
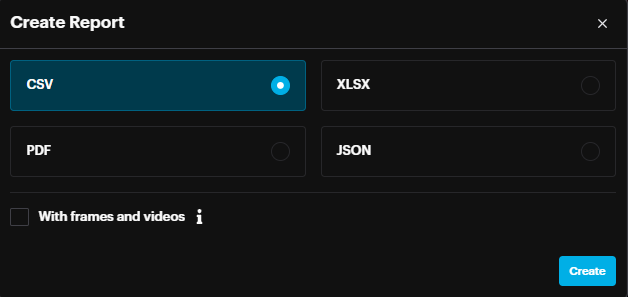
Create a report for multiple alarms or All alarms by clicking the Create Report button, located in the upper-right of the list. In the Create Report window select the
Format to be exported, select “With frames and videos” if needed, and click the Create button.
Manage Devices
On the Sites page select the desired site, then select Manage Devices from the Properties drop-down menu.
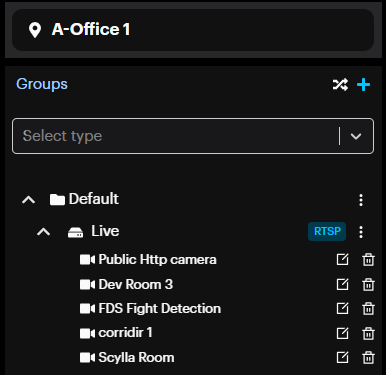
On the Manage Devices menu, open the existing camera groups to see all cameras and change their settings.
Create Group
![]()
In Group Create pop-up specify the name for a new group and click Submit.

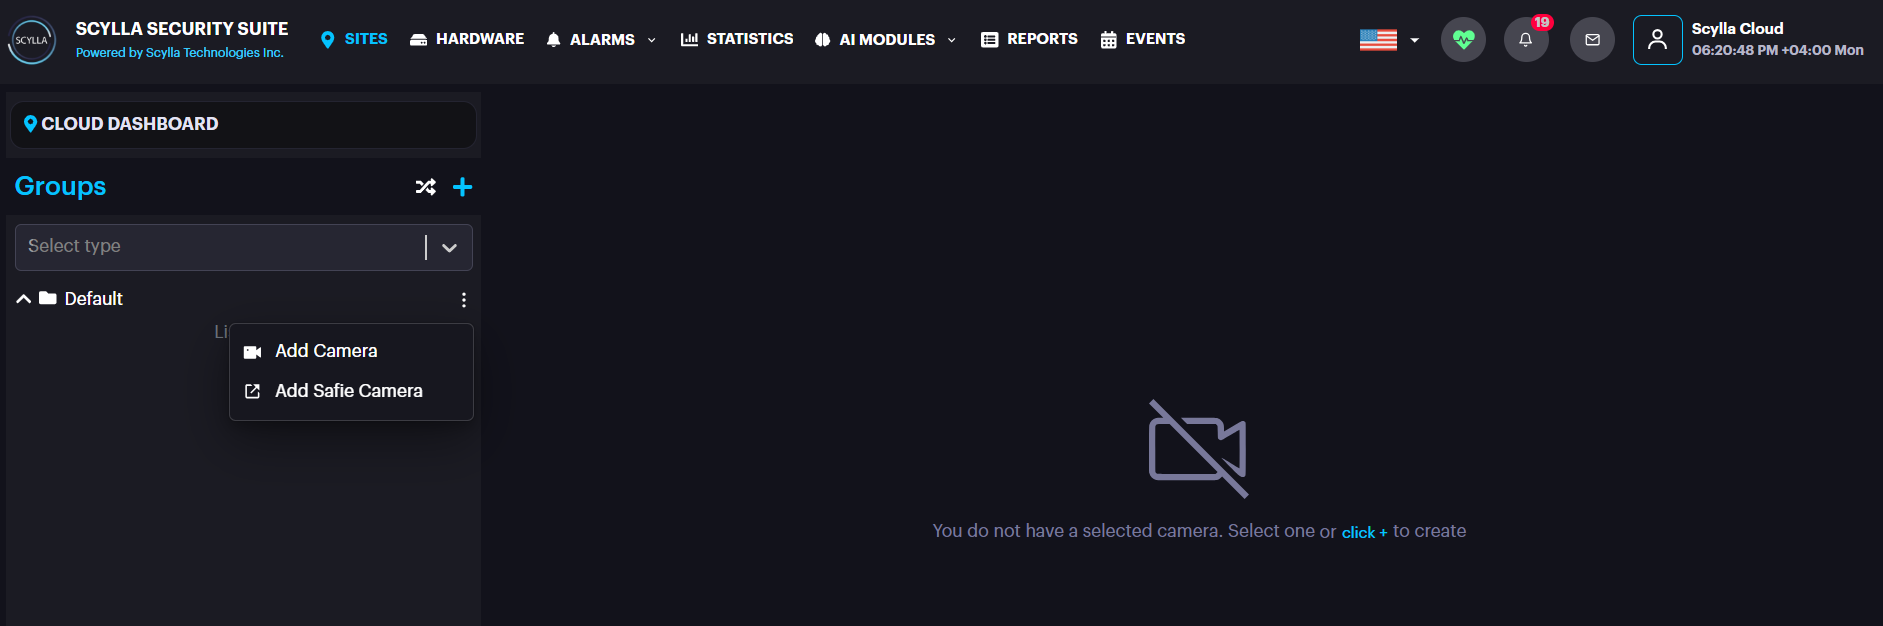
Add New Device
To add new device, click on the More Options button on the desired group and click
Add camera.
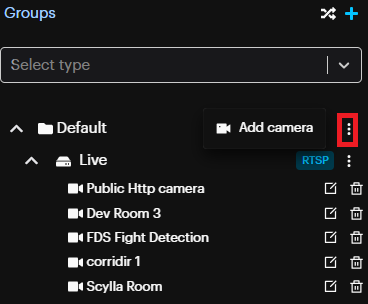
Note : If the device uses the same integration type (e.g., RTSP), you can add it by clicking the 'More' option next to that integration type (in this case, RTSP).
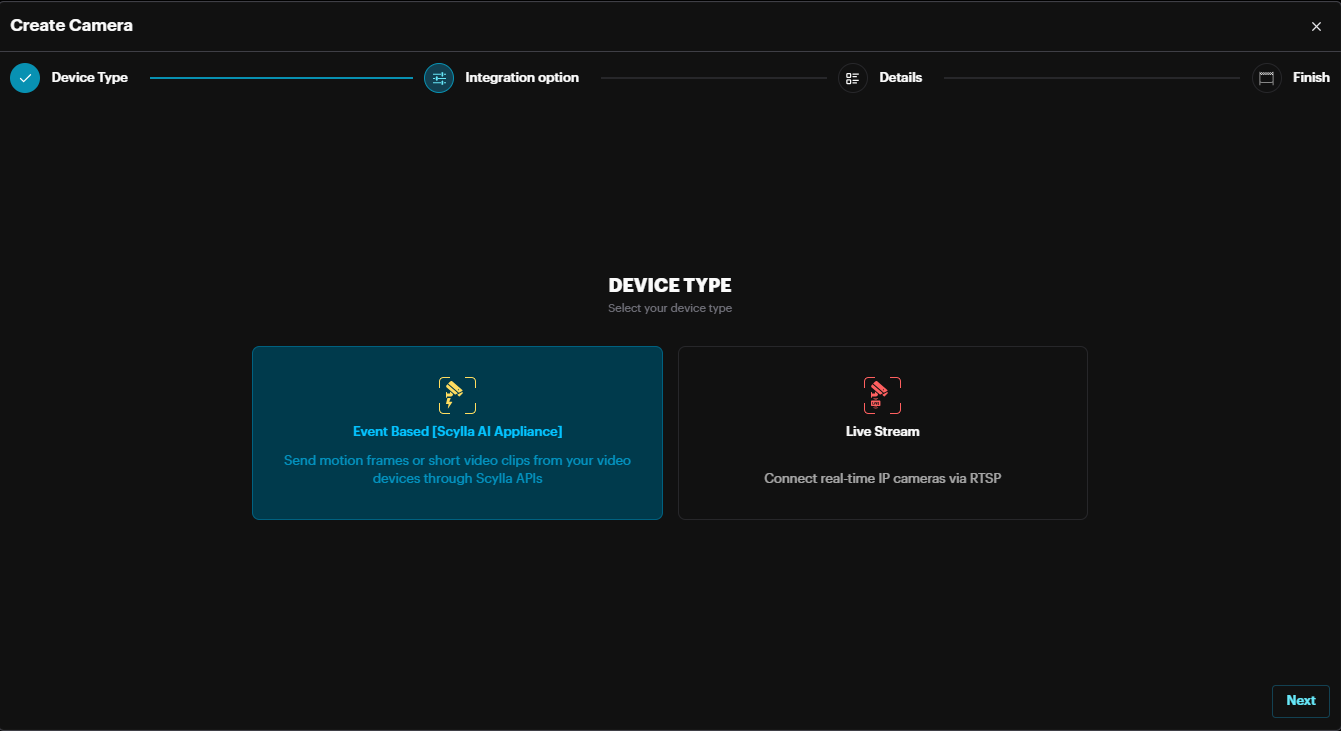
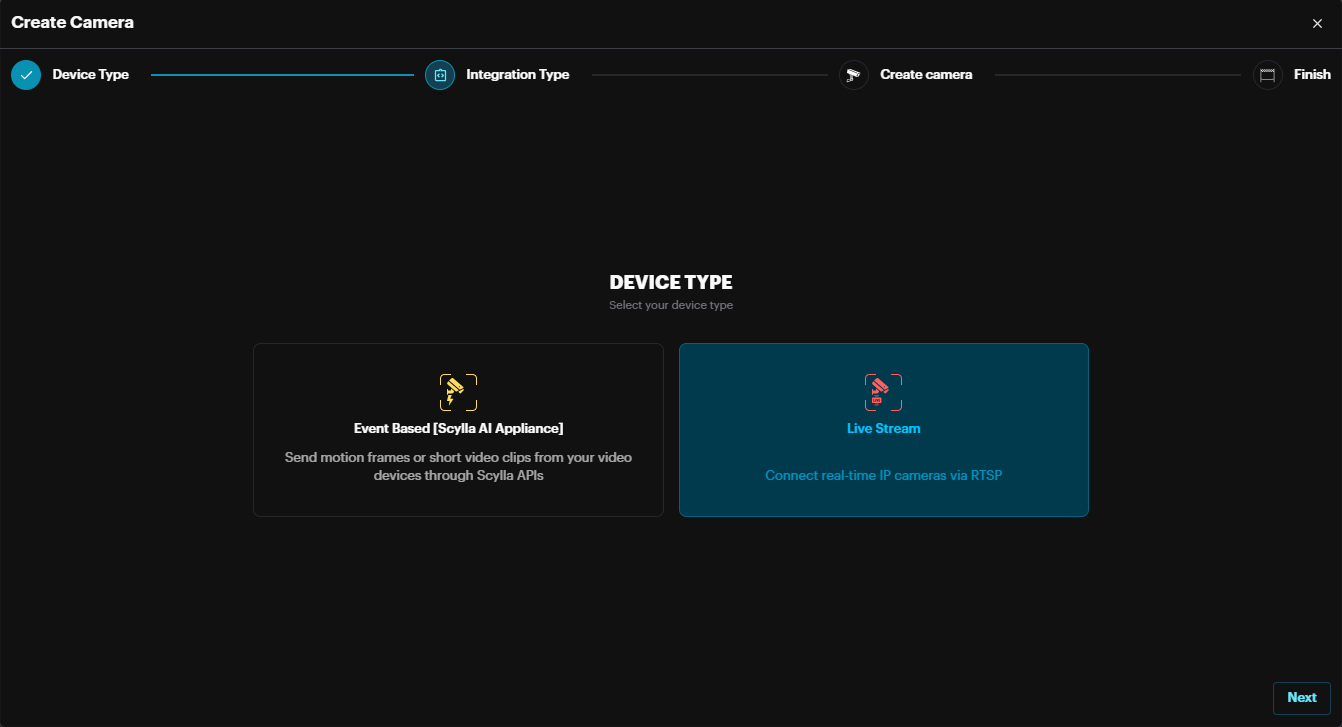
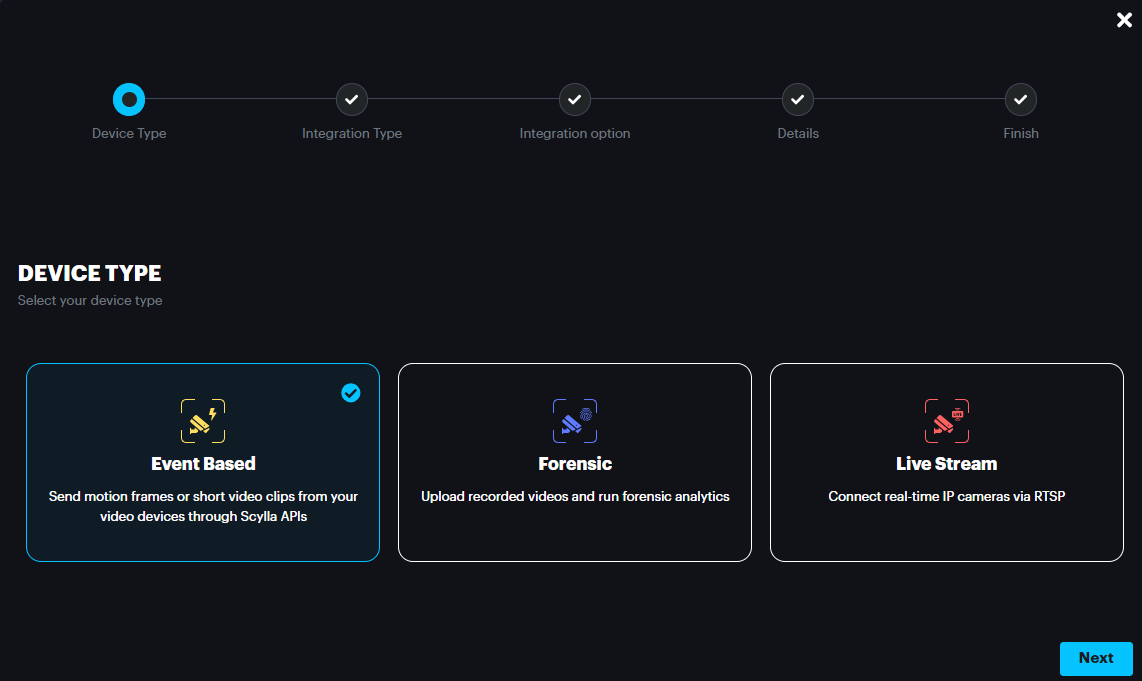
Select Event Based [Scylla AI Appliance] for connecting to Scylla AI appliances) or select Live Stream for connecting to IP cameras, Recorders, or VMS-s using RTSP. Then click Next to proceed.
Event Based Integration
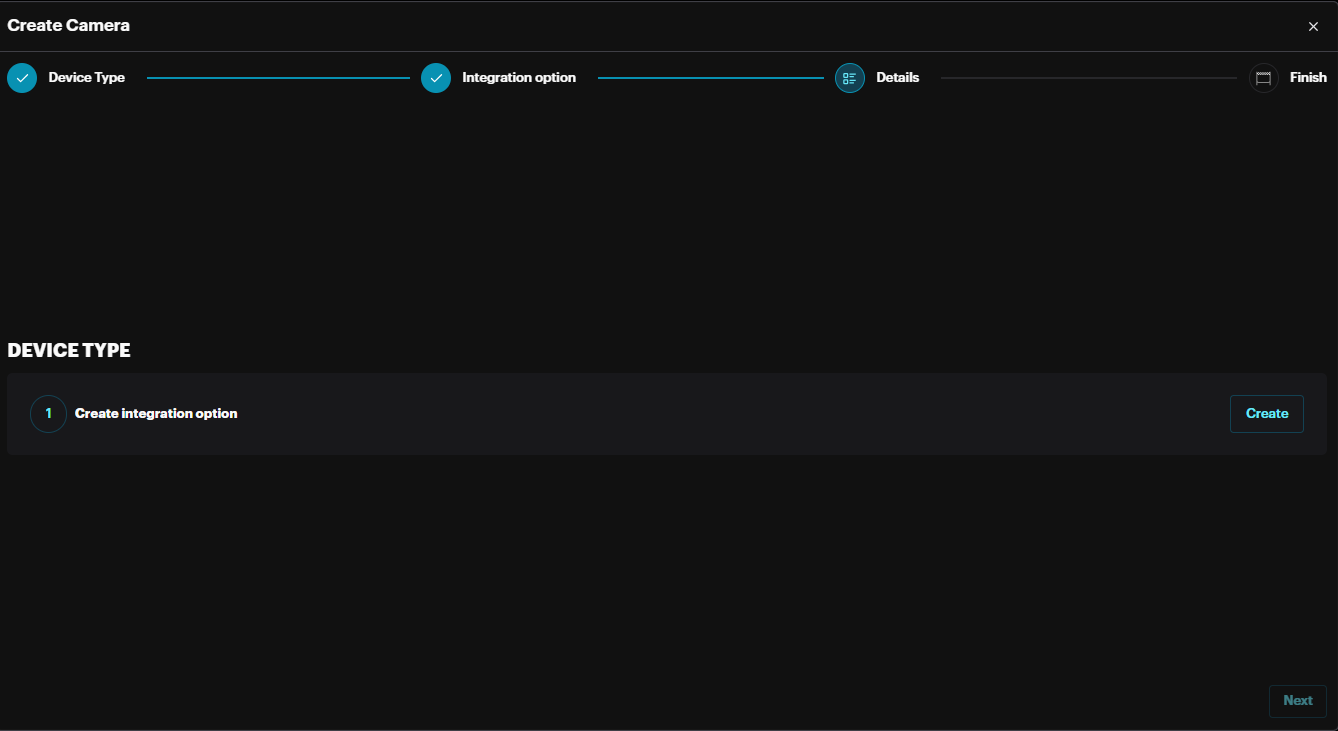
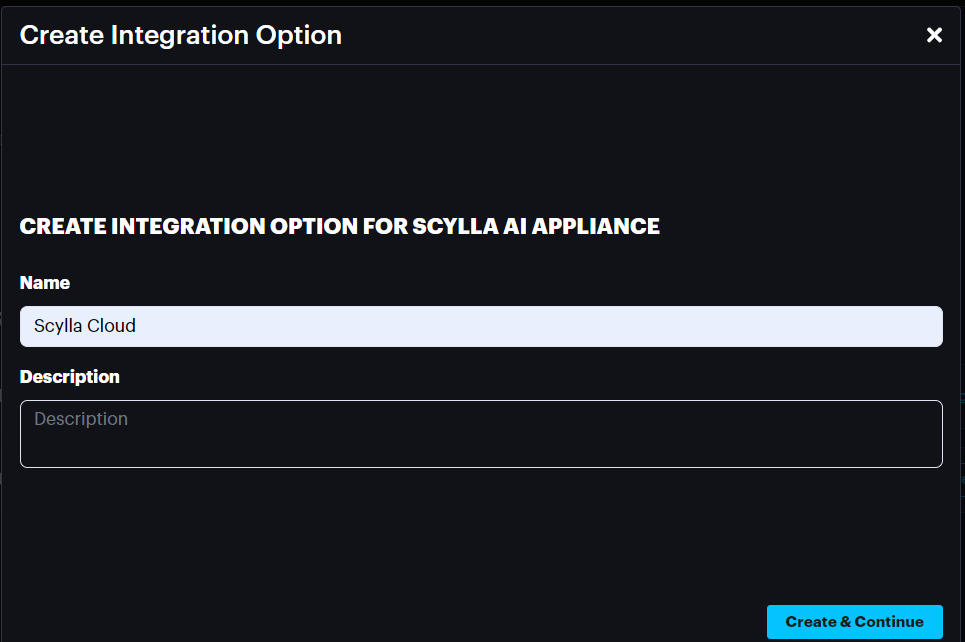
Click Create to create integration for Scylla AI appliance then click Create & Continue.
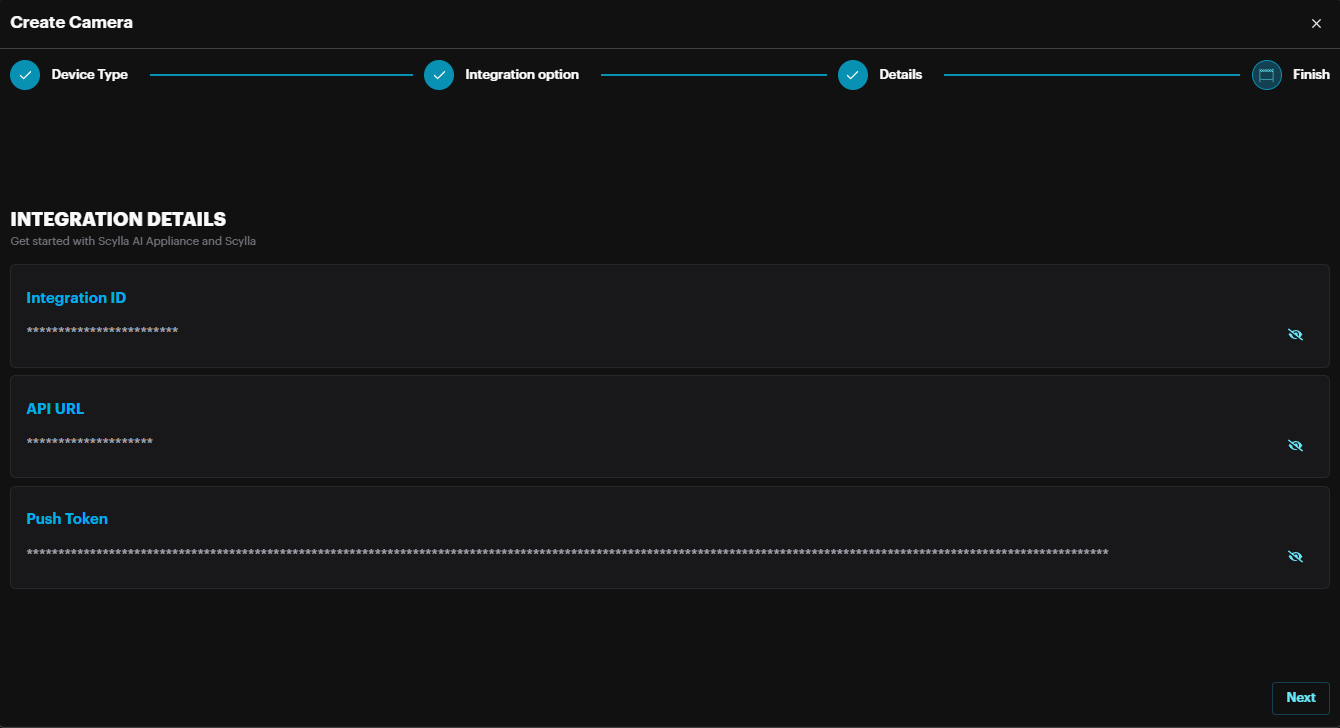
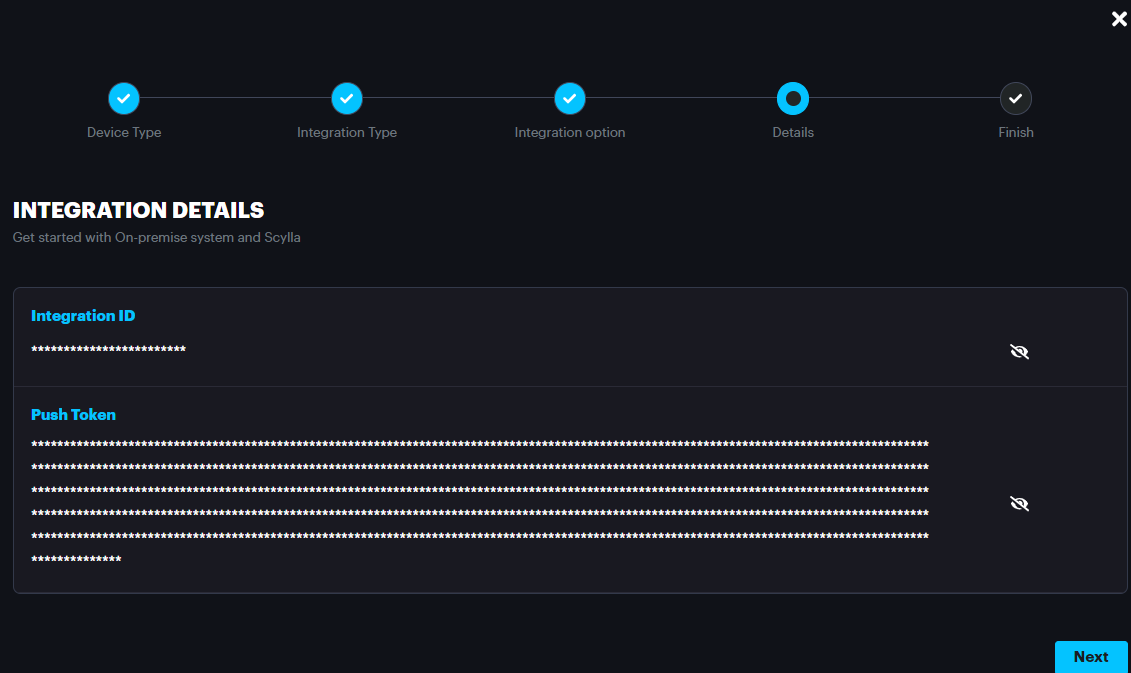
The credentials shown such as Integration ID and Push Token should be entered in the Scylla AI appliance to synchronize.
Click Next.
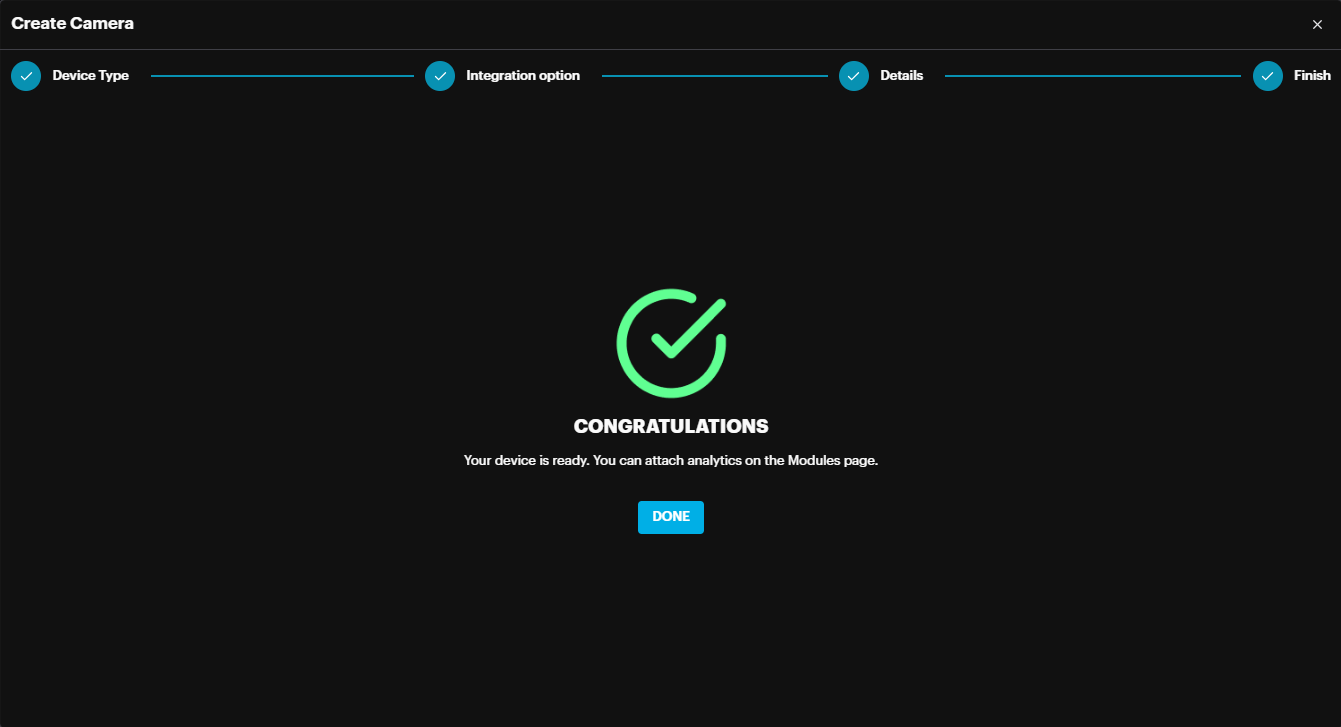
Click Done.
The Scylla AI Appliance should now be added to the group.
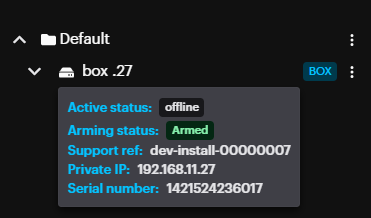
By hovering over the BOX icon, the Box stats will be displayed in a tooltip.
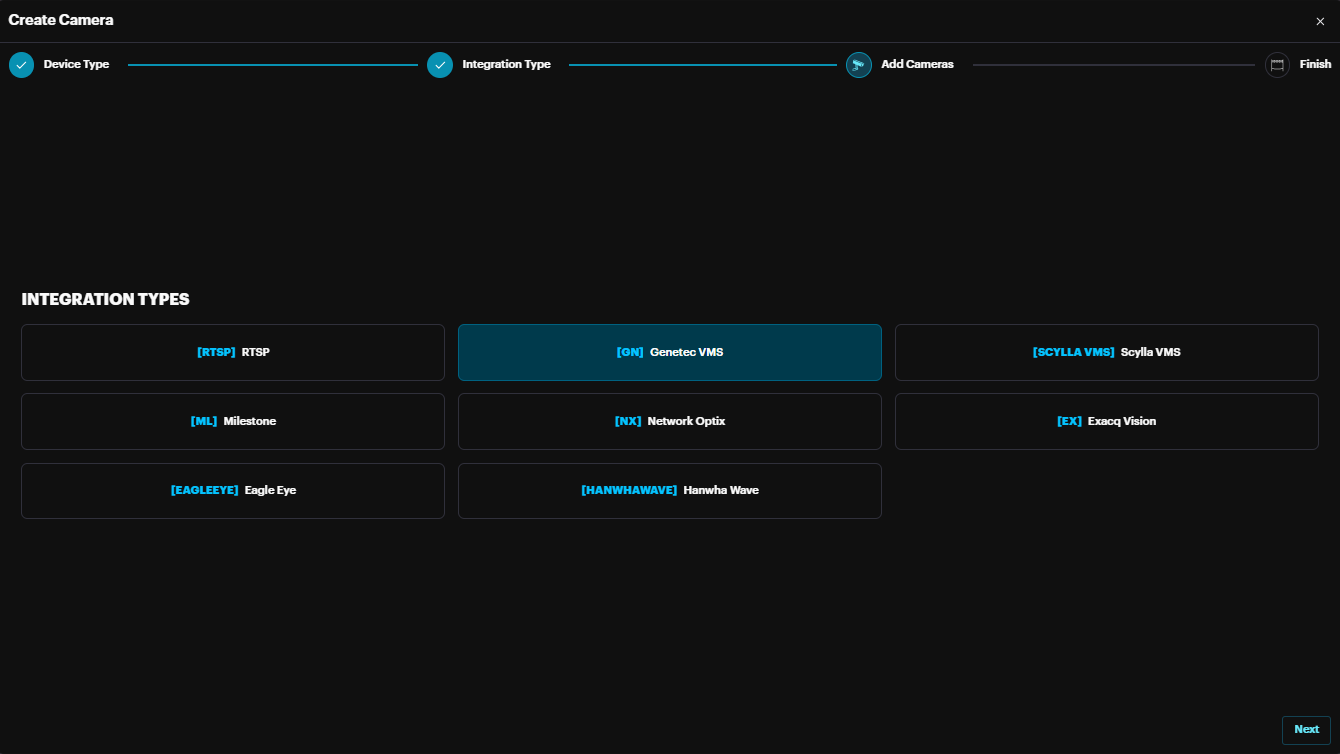
Live Stream Integration
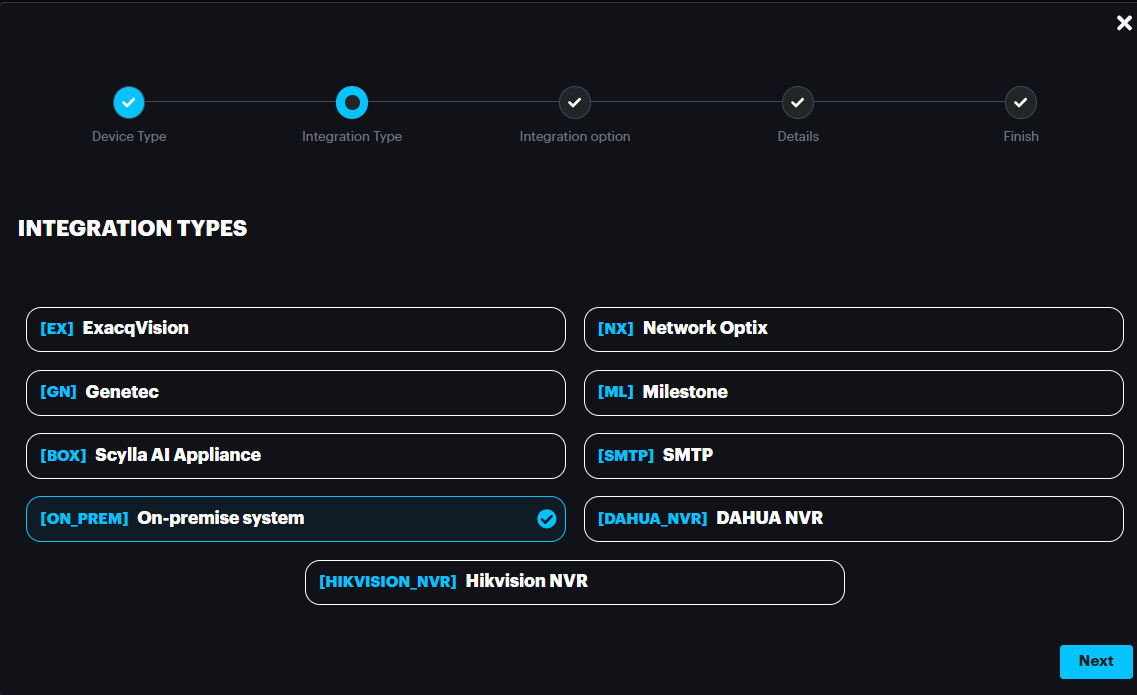
Under Integration Types, select the source of the stream.
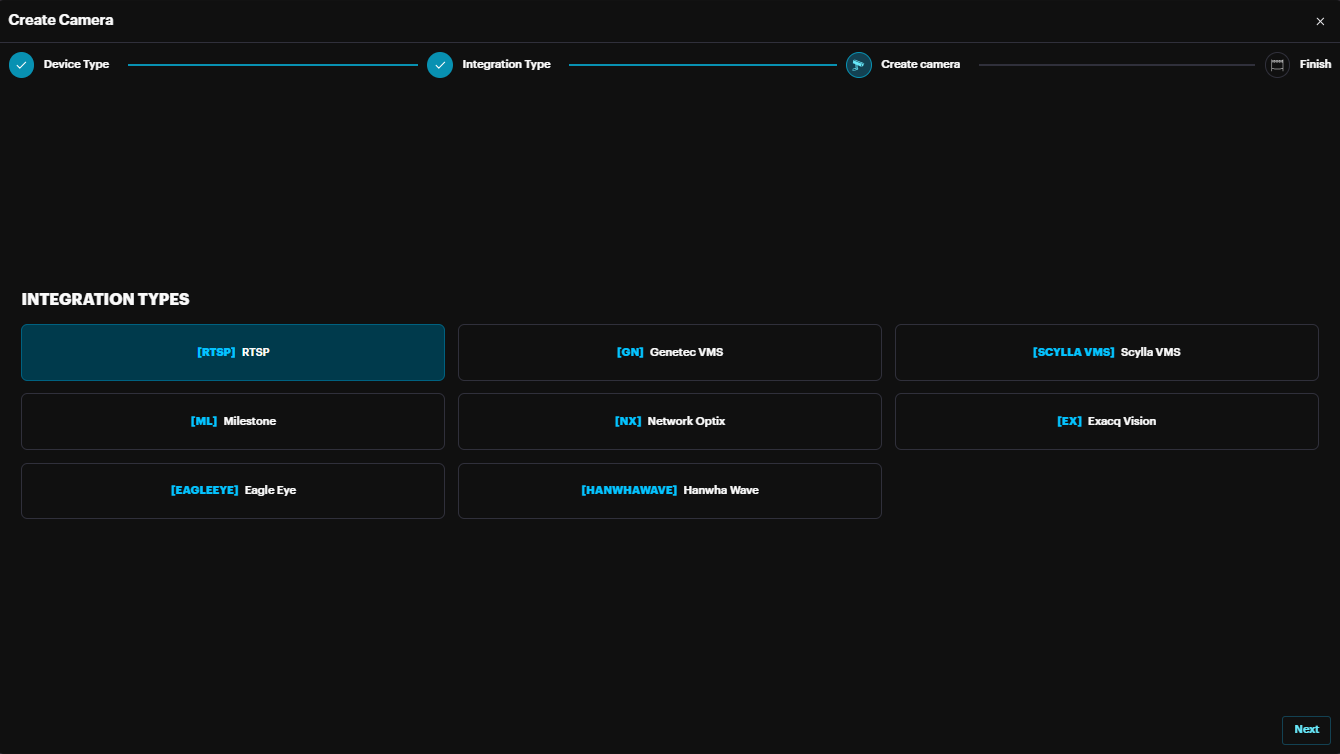
RTSP: adding any device which utilizes the Rea-Time Streaming Protocol
Genetec VMS: adding cameras from Genetec VMS, only if integration is already configured in settings.
Scylla VMS: adding cameras from Scylla VMS, only if integration is already configured in settings.
Milestone: adding cameras from Milestone VMS, only if integration is already configured in settings.
Network Optix: adding cameras from Network Optix VMS, only if integration is already configured in settings.
ExacqVision: adding cameras from ExacqVision VMS, only if integration is already configured in settings.
Eagle Eye: adding cameras from Eagle Eye VMS, only if integration is already configured in settings.
Hanwha Wave: adding cameras from Hanwha Wave VMS, only if integration is already configured in settings.
Choosing RTSP, click Next.
On the pop-up, complete the needed information and click Connect.
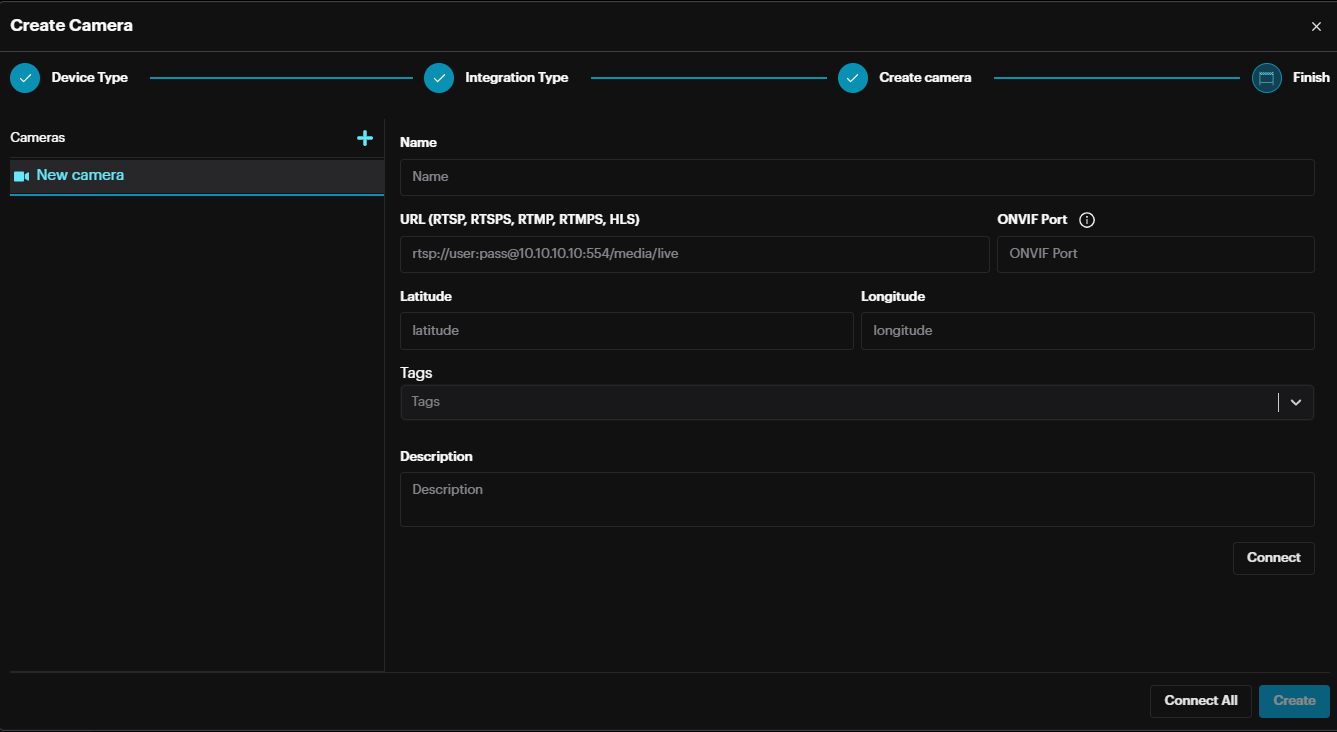
If the provided URL is valid, information about the camera stream will be populated. Click Create to proceed.
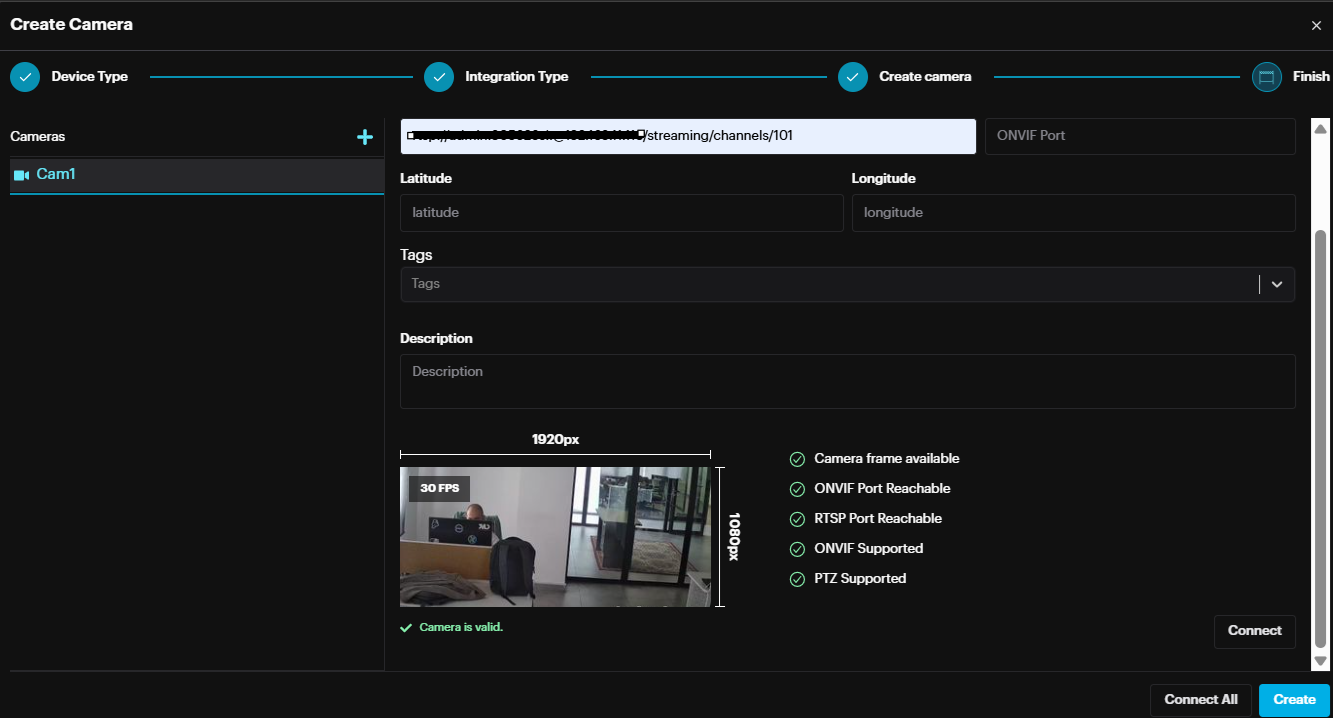
It is possible to add multiple cameras by clicking the + button, next to Cameras, and follow the same steps.
After adding all the cameras, click Create to finish the camera creation process.
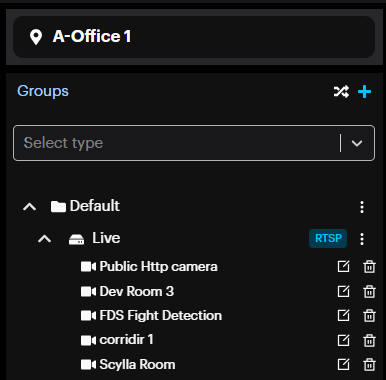
All new cameras will appear under the group.
Choosing any VMS (e.g Genetec) , click Next.
The VMS Camera create window appears.
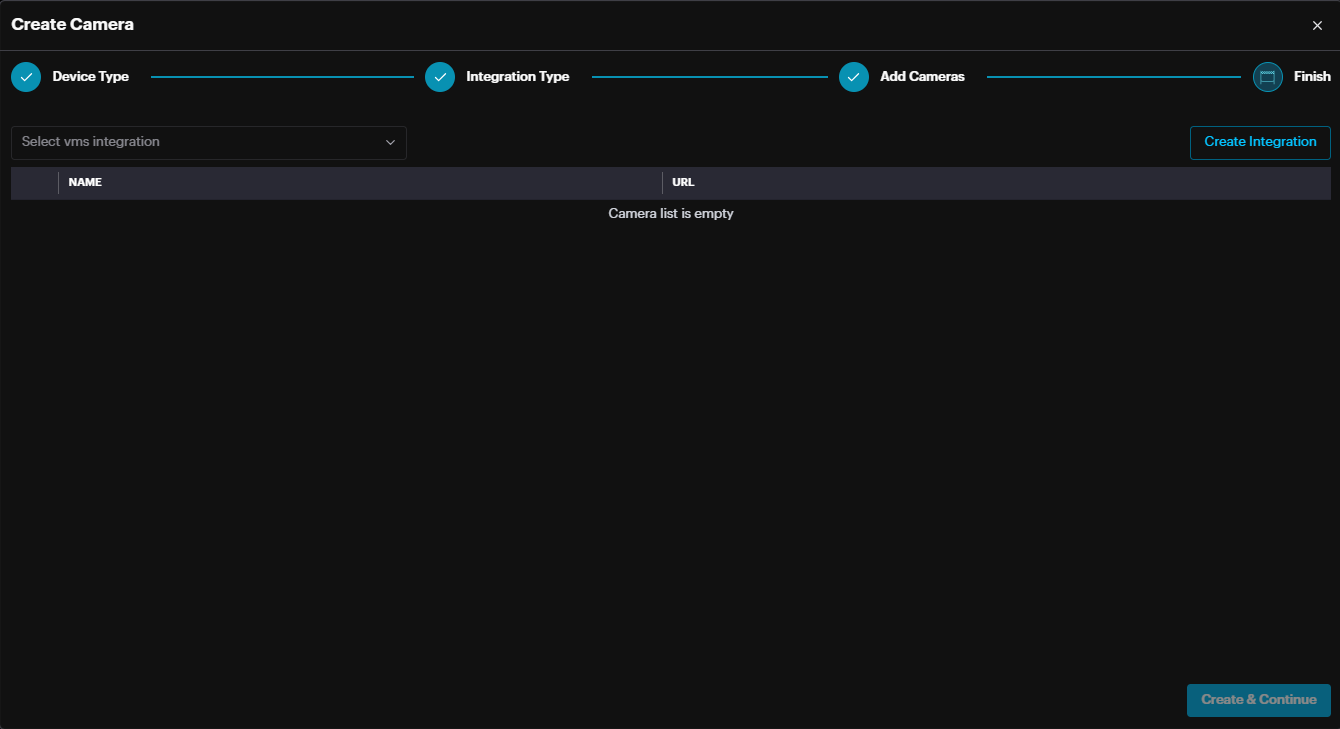
Select the integration from drop down menu which. The integration should be already created from your main system Integration settings (/settings/connections).
The cameras from this VMS will appear.
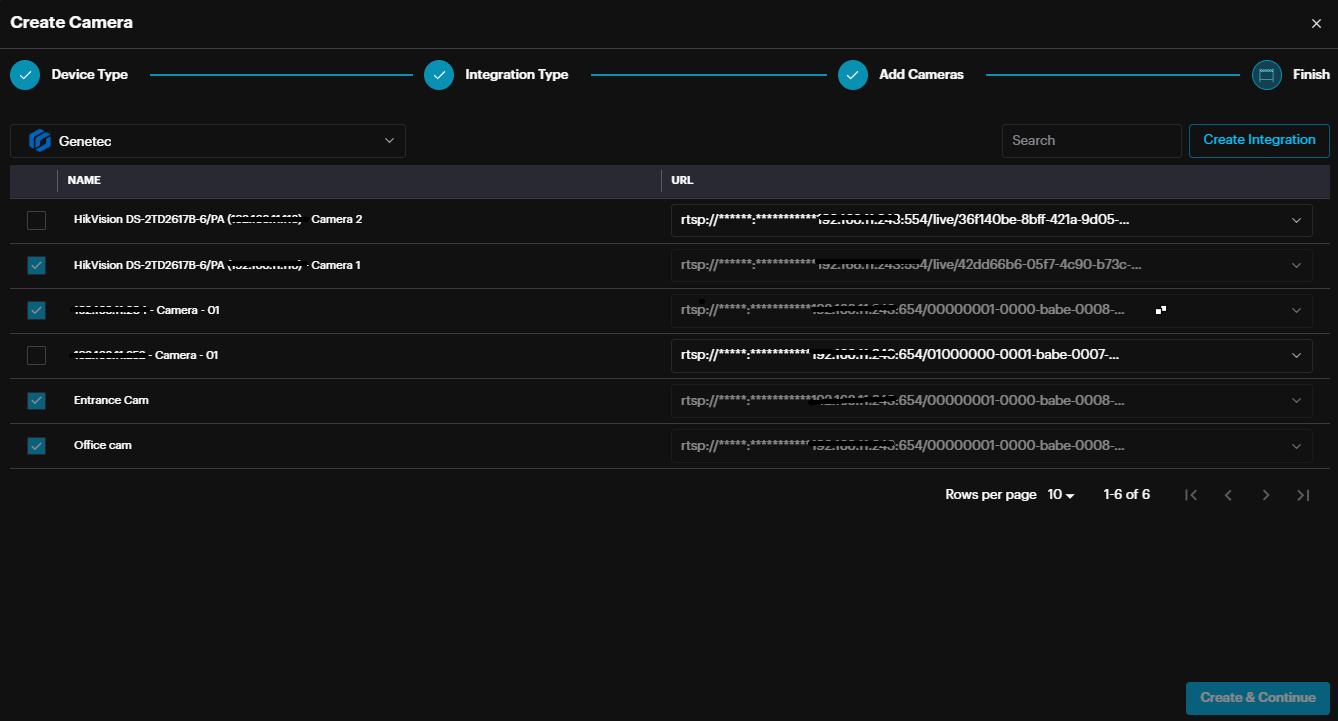
Select the cameras and click Create.
The Cameras will be added to dashboard.
Hardware
The Hardware page shows all devices that have been added to Scylla. From this page, users can manage their devices and configure their settings.
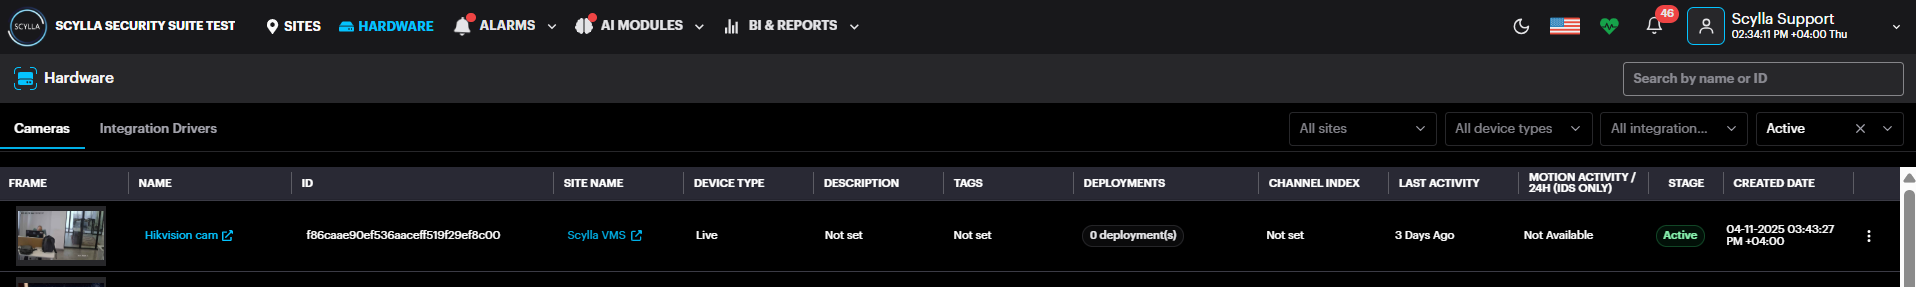
To access additional options for each camera, click on the three-dots button on the far right of each record.
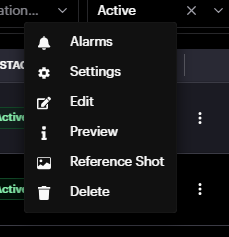
Alarms: Redirects to the Alarm History page displaying the alarms of this camera
Settings: Allows drawing a detection zone(s)/area(s) & configuring module-specific settings.
Edit: Allows renaming the camera, making changes to the URL (RTSP,RTMP,http), creating camera tags , adding latitude/longitude( used for forensic pro module ) and adding a description.
Preview: Displays the camera frame and details.
Reference Shot: Refreshes the camera frame in the camera record.
Delete: Deletes the camera.
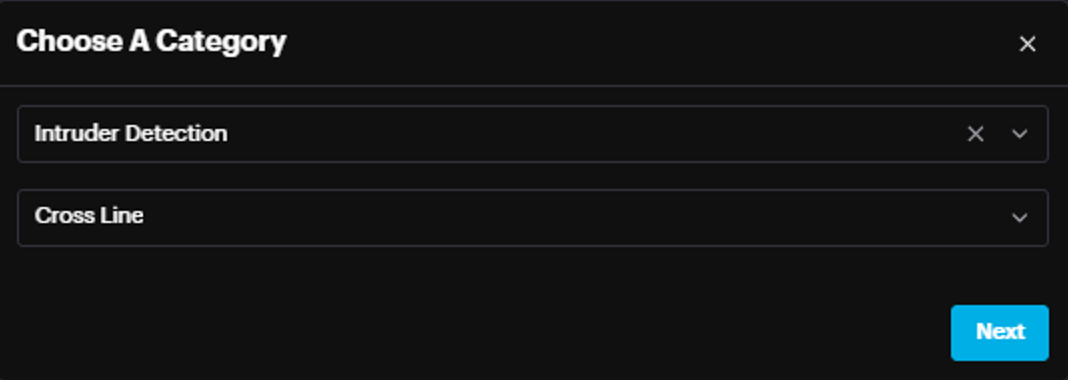
Clicking Settings opens the Choose A Category window.
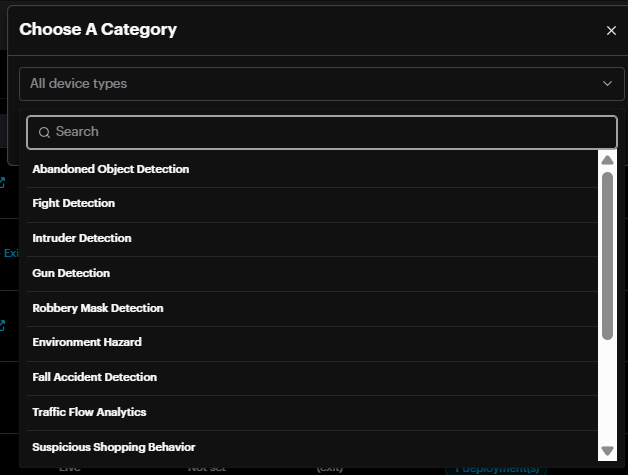
Choose AI module and click Next.
There are two sections; Drawing and Settings which are AI Module specific.
Drawing Active Areas
Left-click on the desired starting point for one line, then move the cursor to the desired ending point and left-click, completing one line. Repeat this process to create detection zones in your camera’s frame. Click Erase to delete all zones. Click Refresh to refresh the stream. Click Save to save all drawn zones.
Multizone Object of Interest
For the intrusion detection module it is possible to select different Object of Interest(s) (person, car, truck, motorcycle, bus) for each zone/area/polygon drawn (e.g. zone1 to detect person only whereas zone2 to detect car only).
To do this, click the zone/area/polygon drawn on the left side and on the right side this polygon setting is marked. Now choose the required Object of Interest(s) from the drop-down menu.
Per Camera - AI module Settings
Intrusion detection
If no active area or zone is drawn, the "Object of Interest" setting will appear on the Settings page.
Residential setting
A new "Residential" setting has been added to optimize detection accuracy and reduce false positives. By default, this setting is OFF to maintain high sensitivity for long-range detection, but users can toggle it based on the following scenarios:
Outdoor Monitoring
Long-range monitoring (small intruders, 30-45 pixels): Keep the Residential setting OFF to detect distant objects.
Close-range monitoring (larger intruders, 50+ pixels): Turn the Residential setting ON to minimize false positives.
Indoor Monitoring
For indoor environments with generally larger objects, it is recommended to turn theResidential setting ON.
Summary:
Outdoor Long-range/Small objects: Residential = OFF
Outdoor Close-range/Large objects: Residential = ON
Indoor Monitoring: Residential = ON
Face Recognition
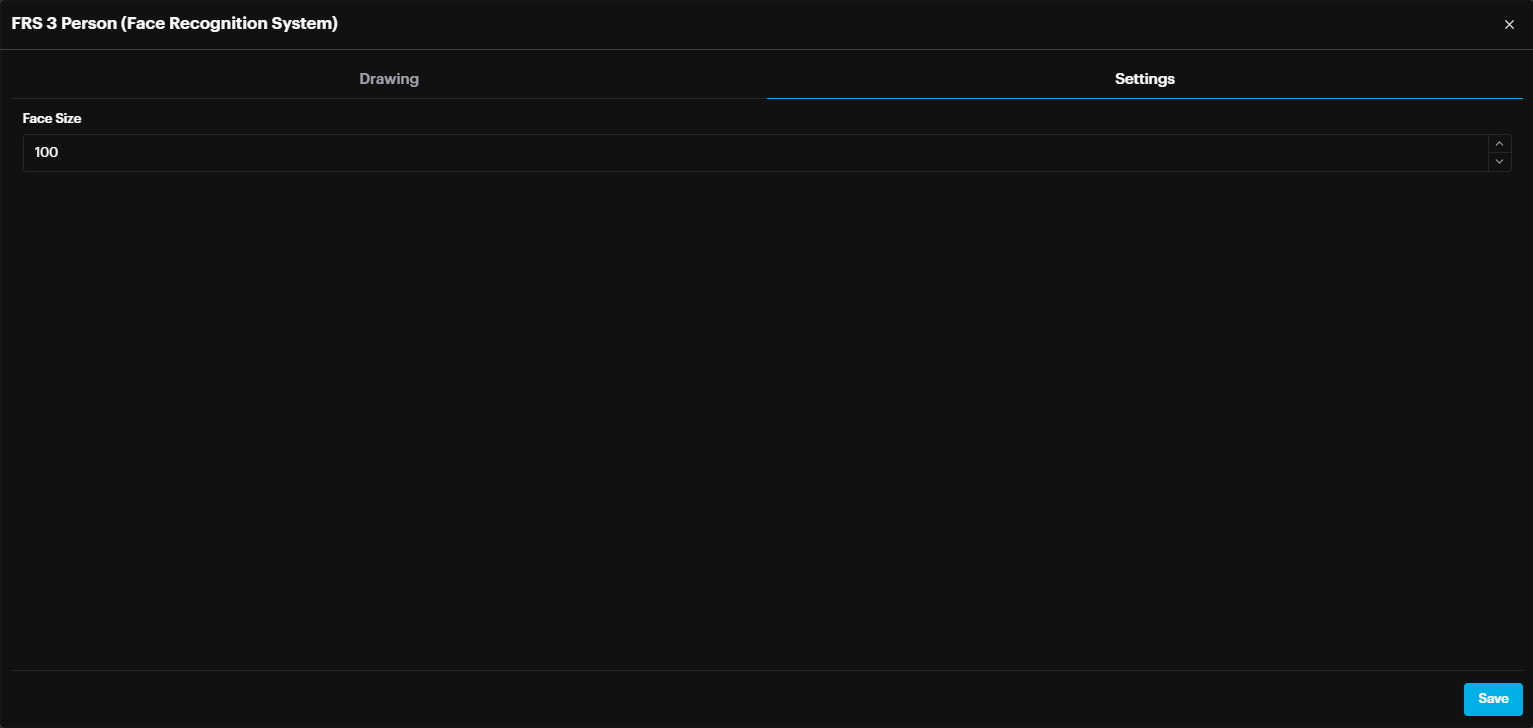
The face size setting is now configured individually for each camera. This setting determines the minimum face size (in pixels) required for a face to be detected and not filtered out.
In summary, setting the size to 50 allows face detection at a greater distance within the camera's view compared to a setting of 100.
Abandoned Object Detection
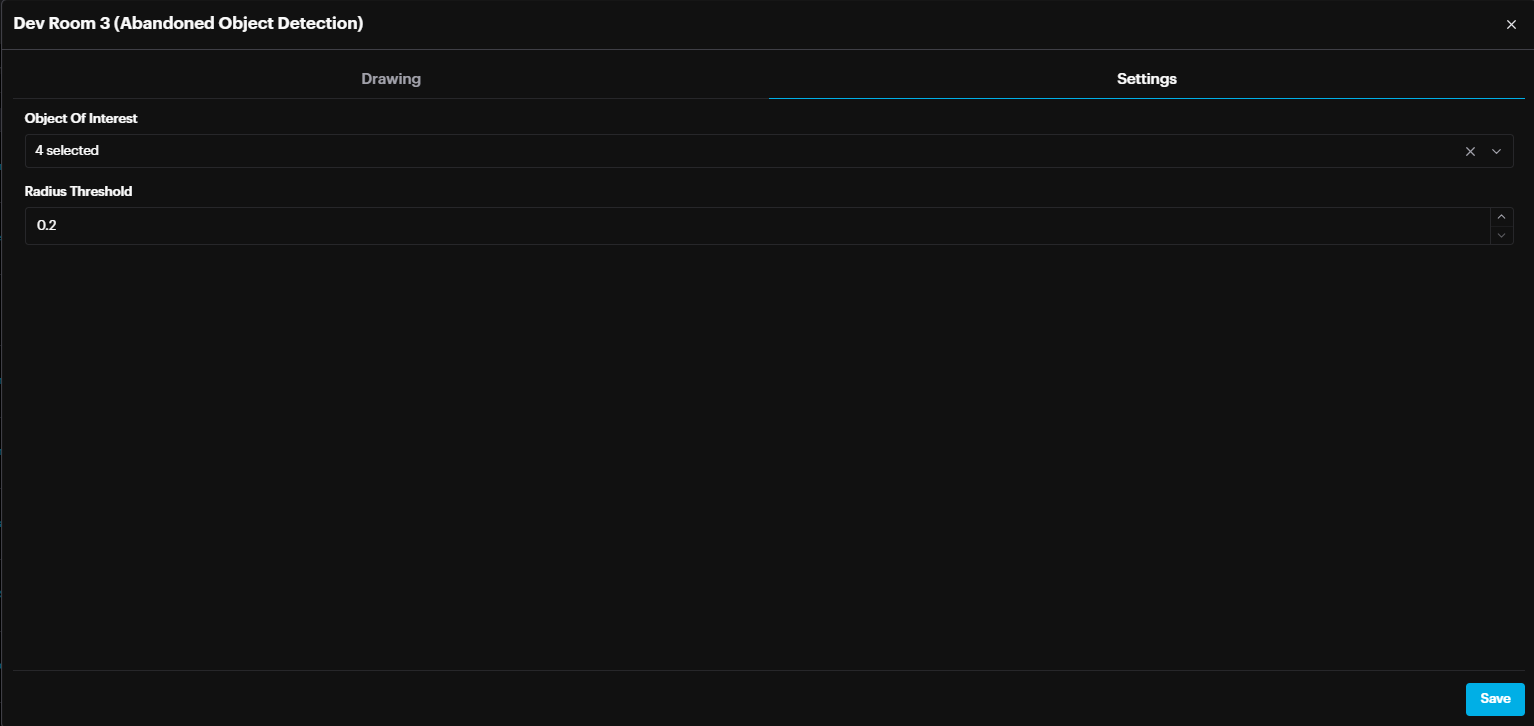
For AOD (Area of Detection), select the object(s) of interest: Carton, Trash, and/or Bag. The radius threshold defines the acceptable distance between a person and the selected object(s) of interest.
Deployment
Once the camera(s) have been added to the system and configured (including defining active areas, adjusting settings, etc.), the next step is deployment. Deployment involves assigning a specific camera to operate with this AI module.
To add a new deployment, go to AI MODULES section and select the required AI Module and click the Deployment icon.
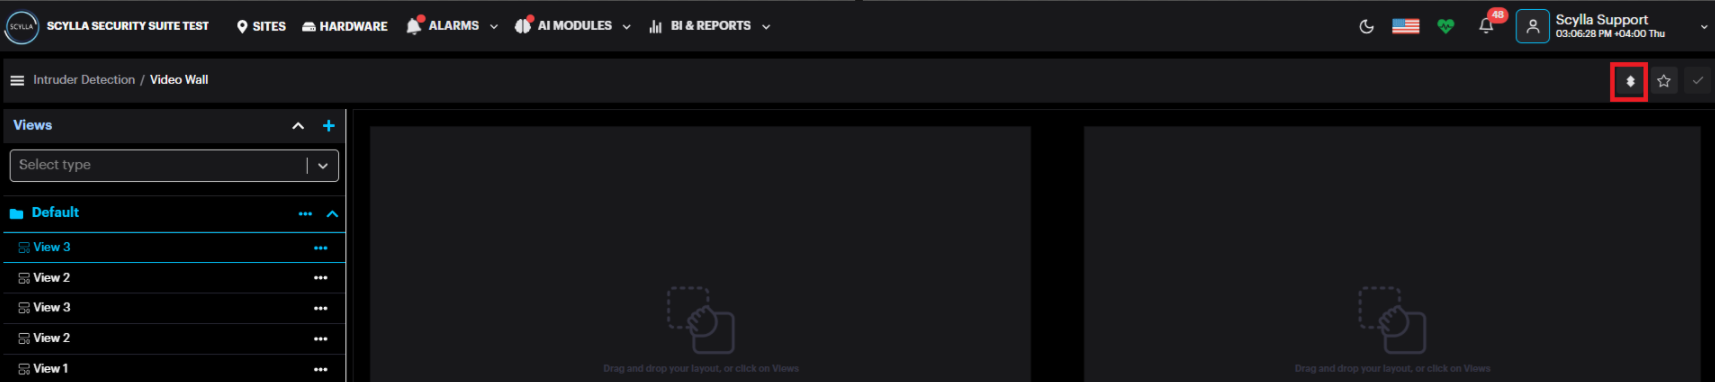
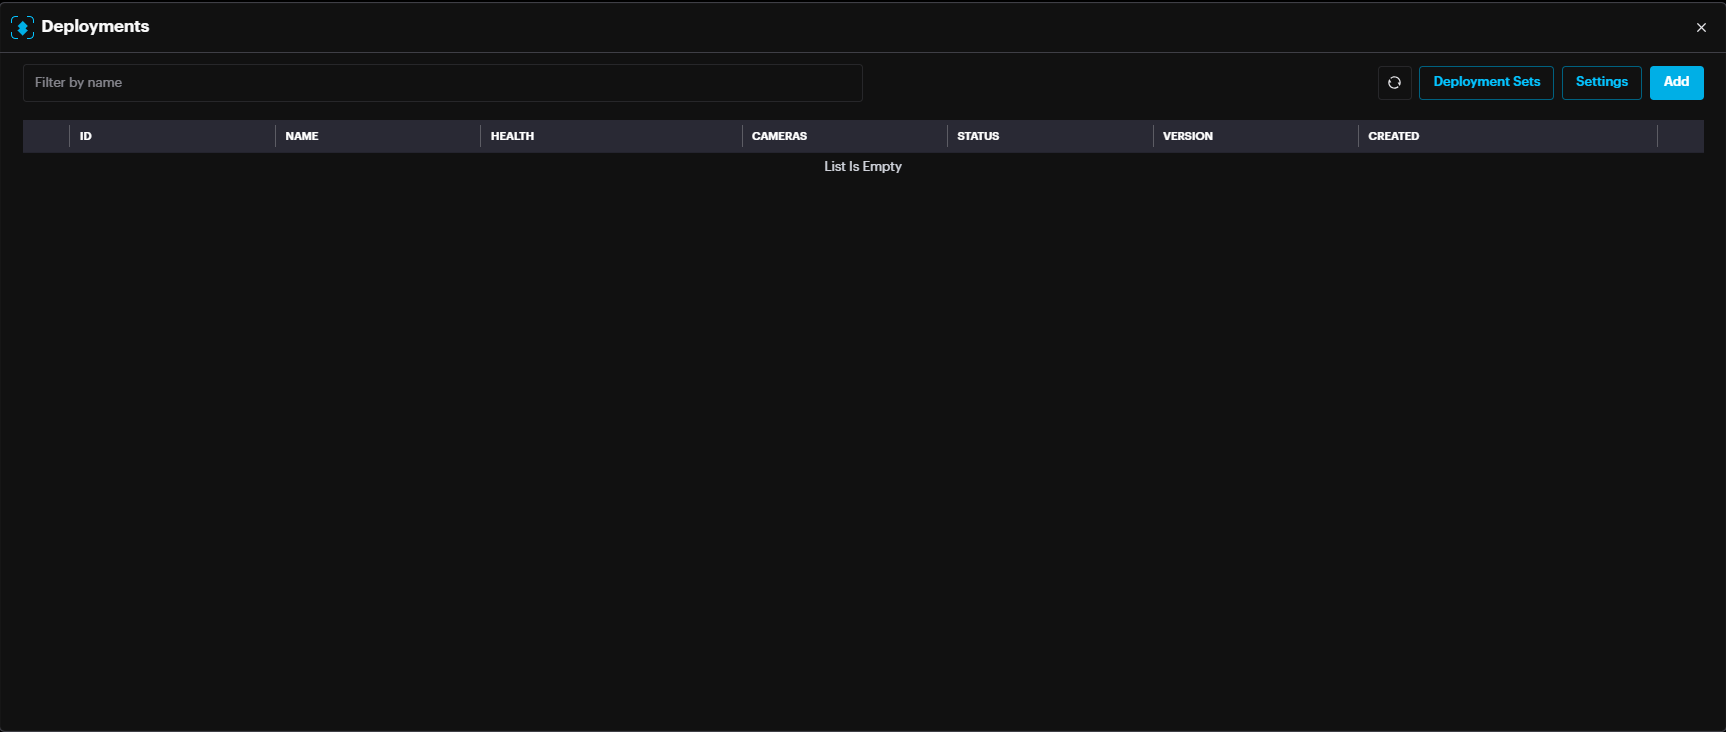
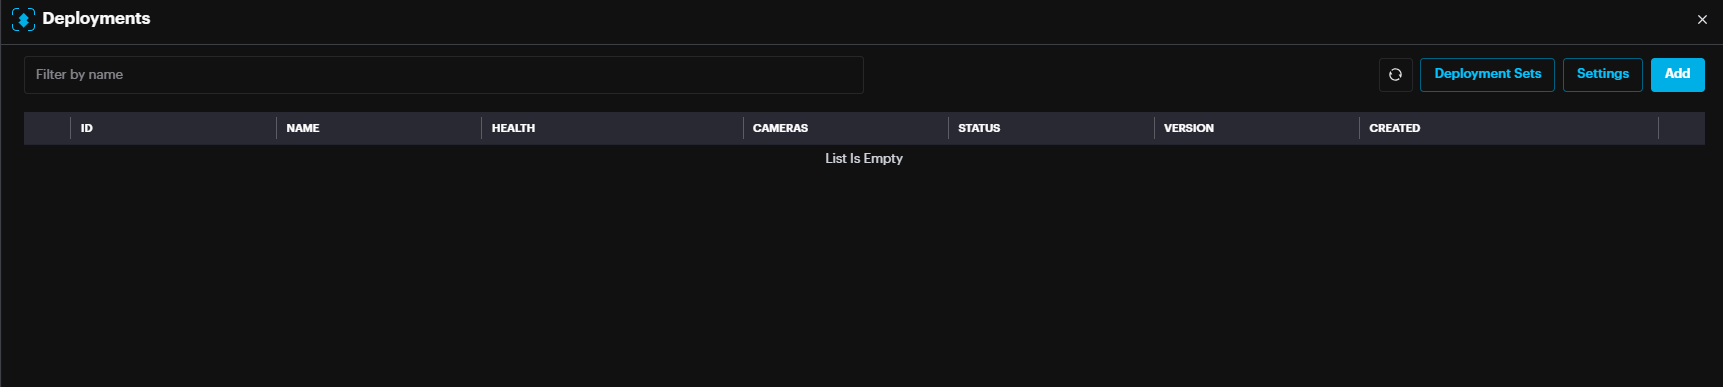
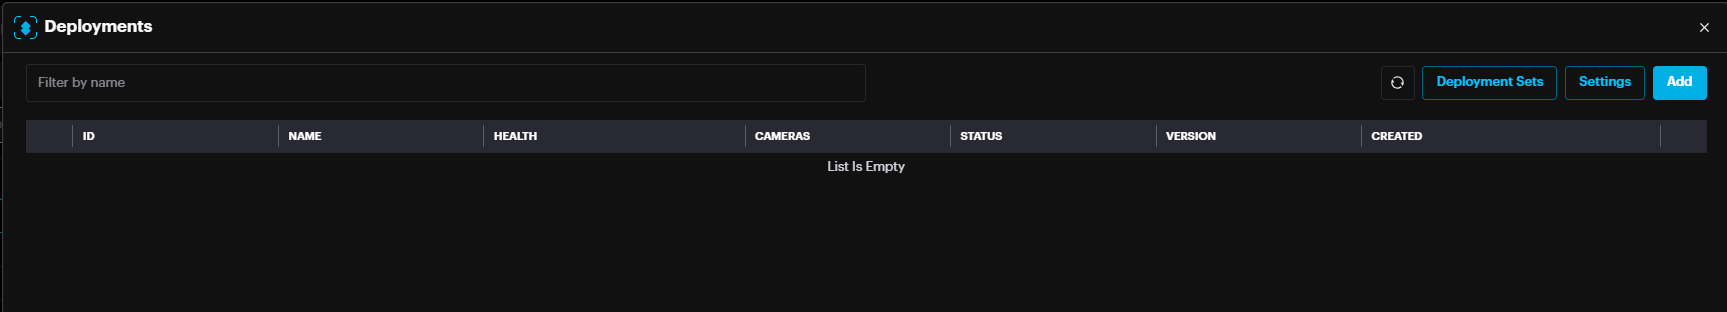
Deployments pop up appears, click Add.
If capacity has not yet been allocated for this module, a message will appear.
Click on Cluster Settings to navigate to Settings->Cluster Settings.
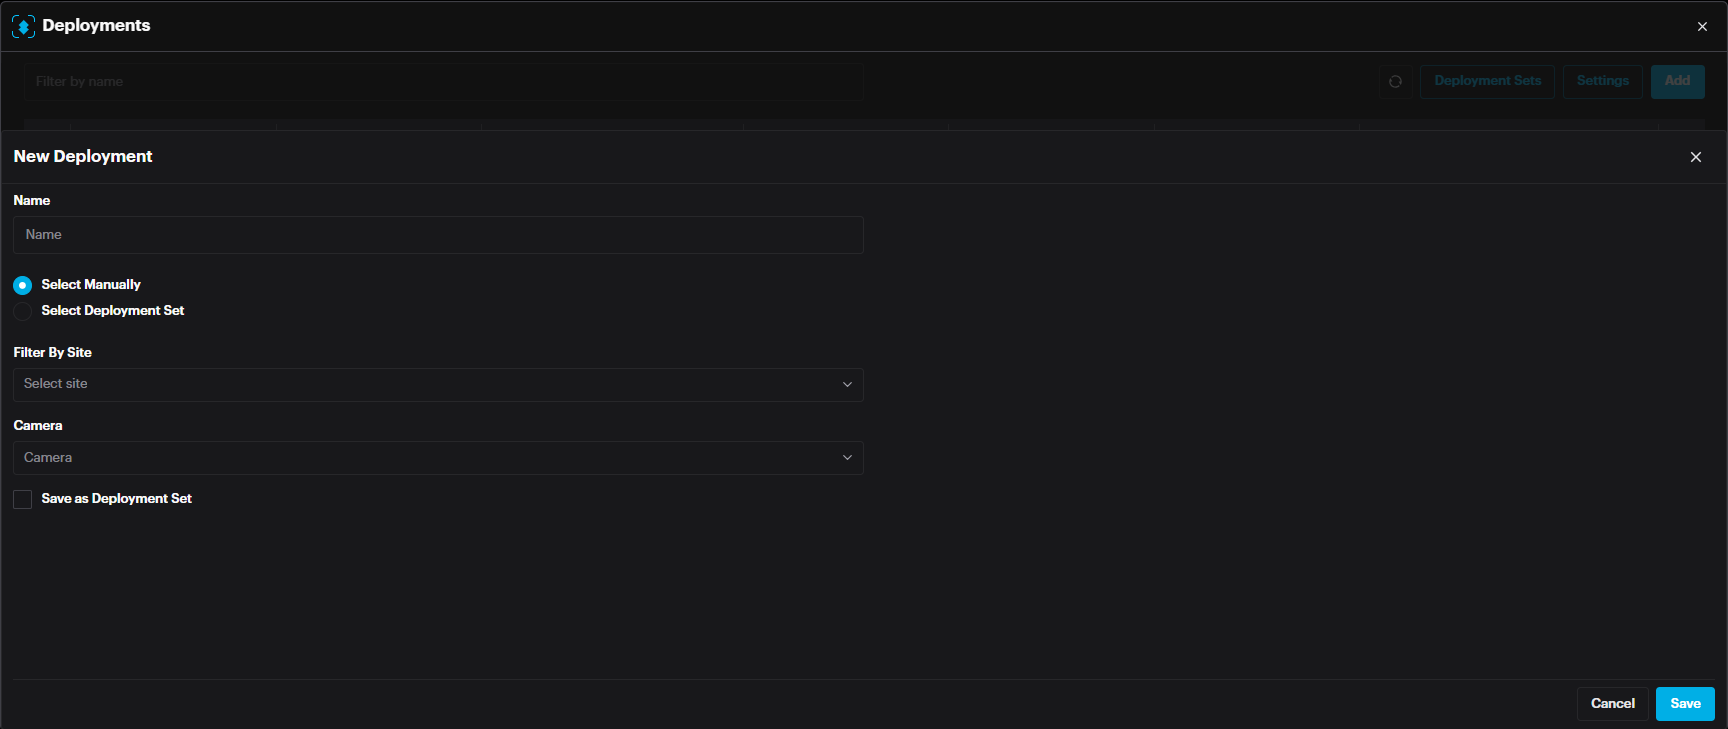
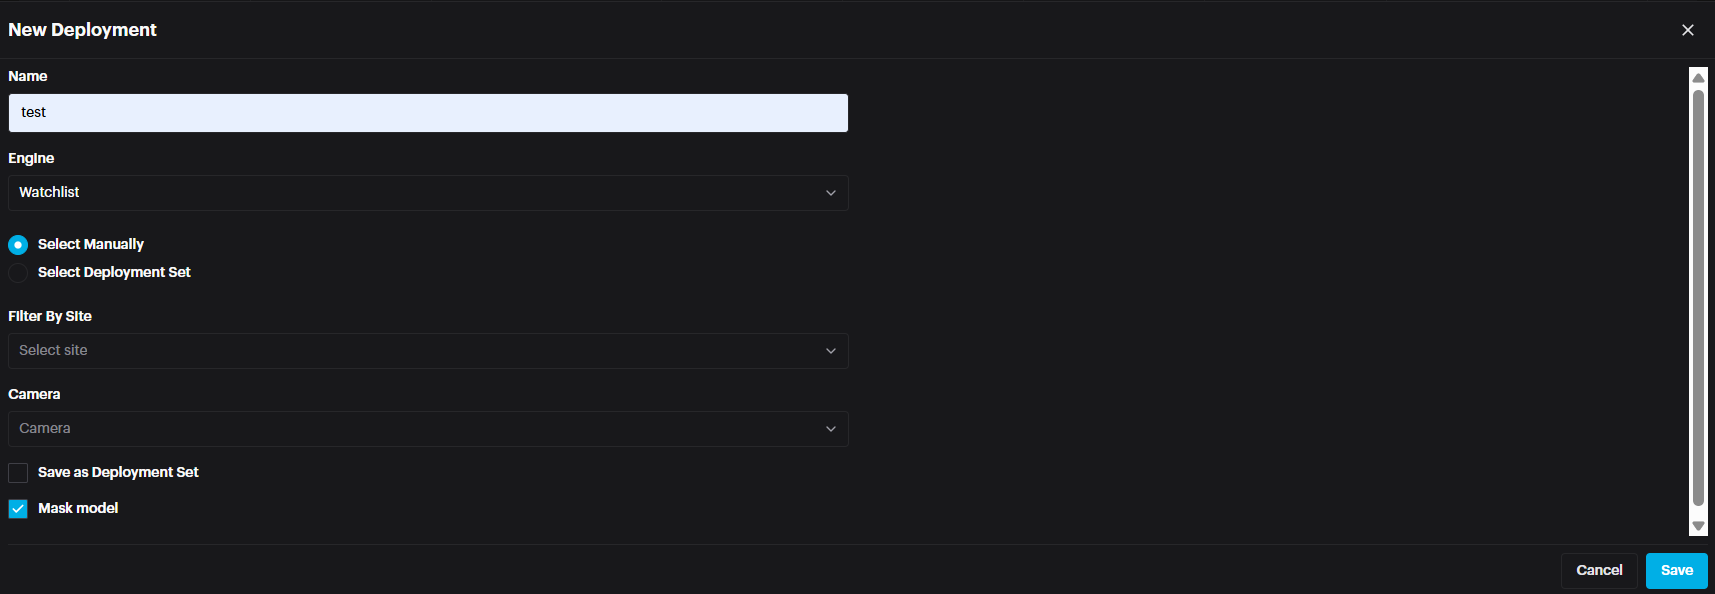
In the New Deployment pop-up window, Name the deployment, Filter by site, and select cameras. Then click Save.
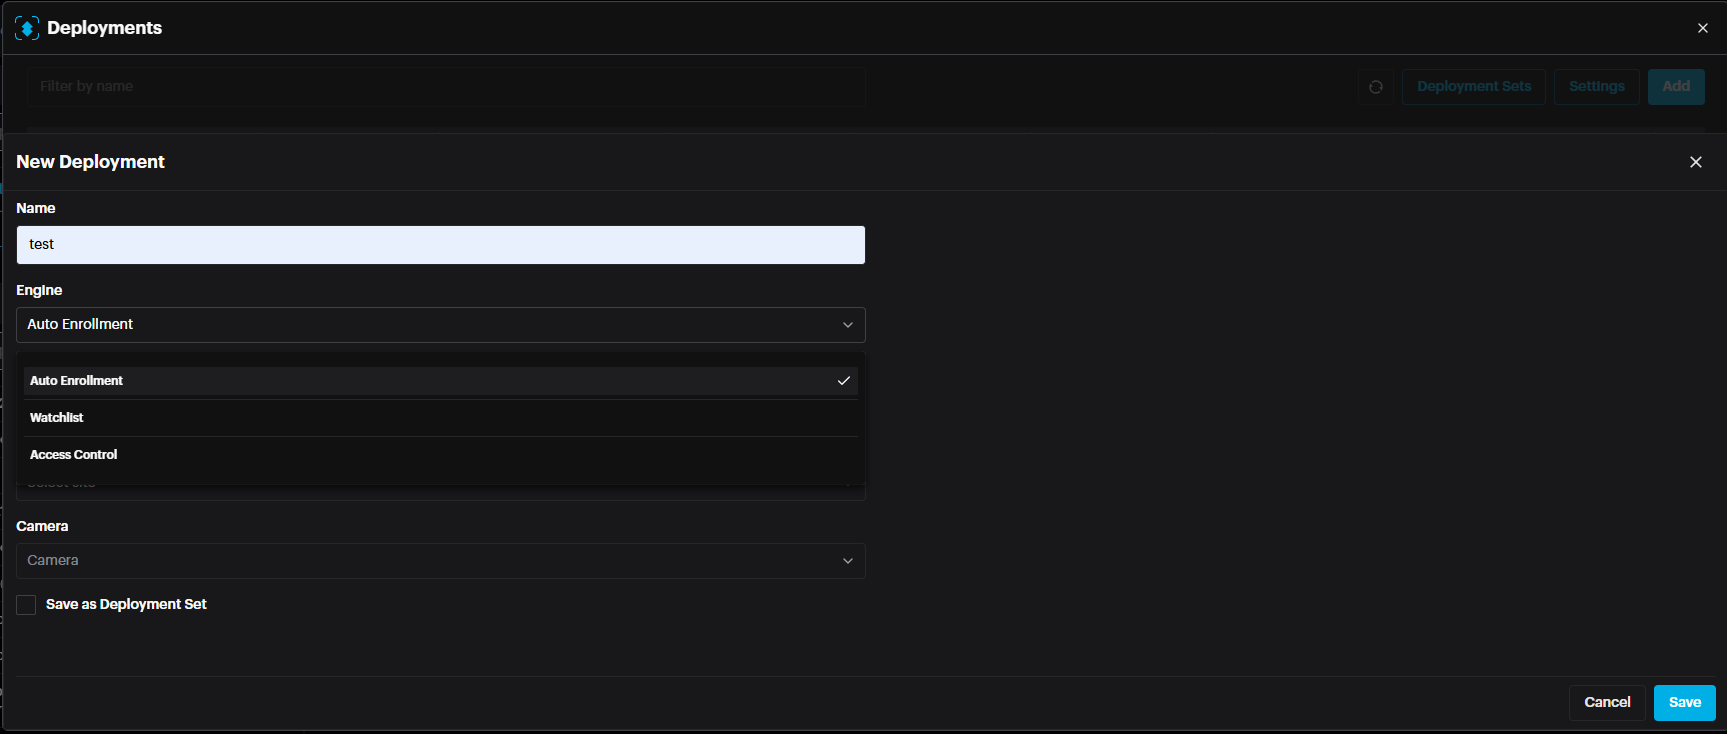
Face Recognition Deployment
Face Recognition deployments include an additional setting called Engine, which specifies the operating mode of the face recognition system. The available modes are:
- Autoenrollment
- Watchlist
- Access Control Autoenrollment
Watchlist
Access Control
Note: Autoenrollment mode includes the functionality of Watchlist mode.
Choose the mode that best fits your deployment requirements.
When Watchlist mode is selected, an additional setting called Mask Model becomes available.
If Mask Model is enabled, the system will use a specialized model trained specifically to recognize faces wearing masks, improving accuracy in such scenarios.
Cluster Setting / GPU mapping
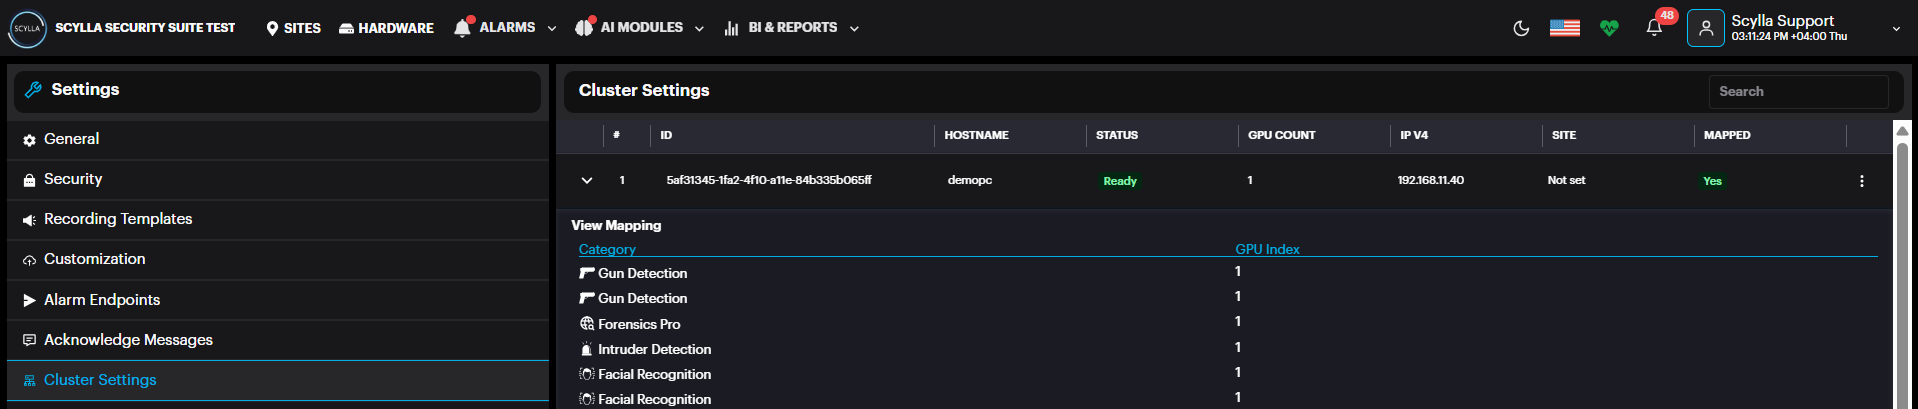
Here, Cluster information appears with number of GPUs installed (under GPU count)
And a summary about the modules/gpu mapping.
If several GPUs are installed, balance the load by distributing the modules across several GPUs.
Click on the more options three dots in the cluster record then then GPU Mapping.

The list of modules with their GPU mappings appears, if any.
Add a mapping by clicking +.
After selecting module and mapping to the GPU index, click submit.
Deployment Sets
Returning, to deployments page, it is possible to create Deployment sets to assign cameras to sets, avoiding manual camera selection for each new deployment.
Click Deployment Sets
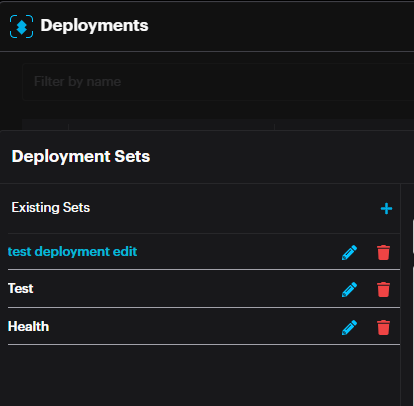
Click the add button to add a Set.
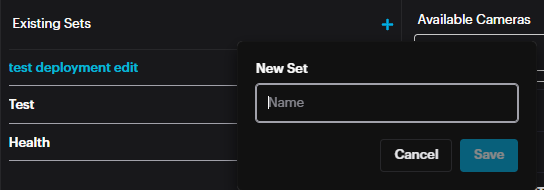
Name the Set. Click Save.
List of available cameras and selected cameras appear.
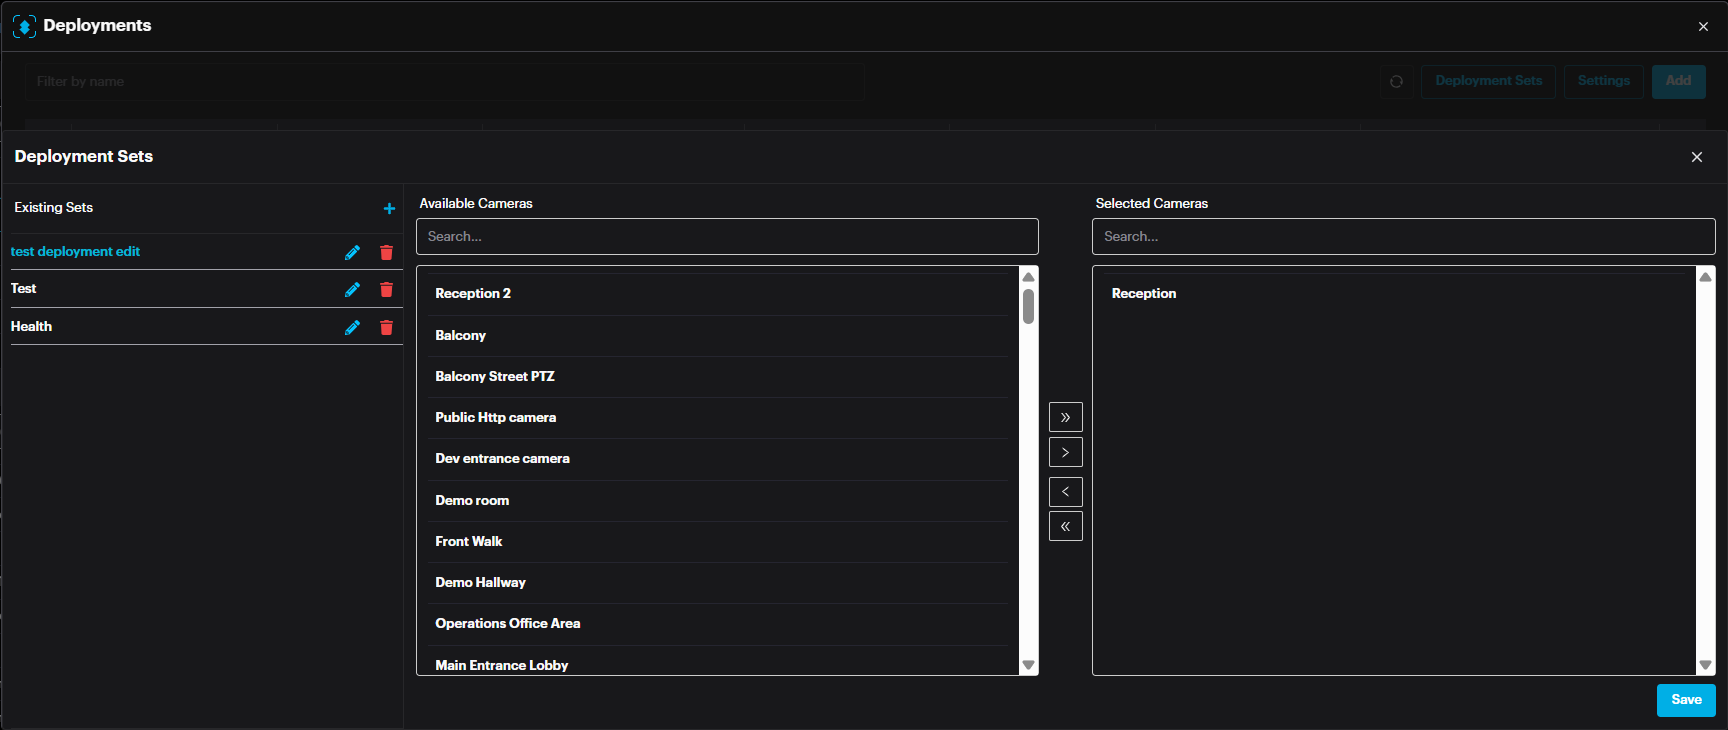
Select the required camera(s) and drop them in the Selected cameras window by clicking the > arrow.
It is possible to remove cameras from a set by selecting the camera and clicking < arrow.
After adding the camera(s) to a set, click Save.
Now click on the add button to add a deployment.
A new deployment window appears.

Name: Name of deployment
Select Manually: Select the cameras manually from the camera drop down menu below.
Select Deployment Set: select Deployment Set if one is already created.
After selecting the camera(s) or set, click Save.
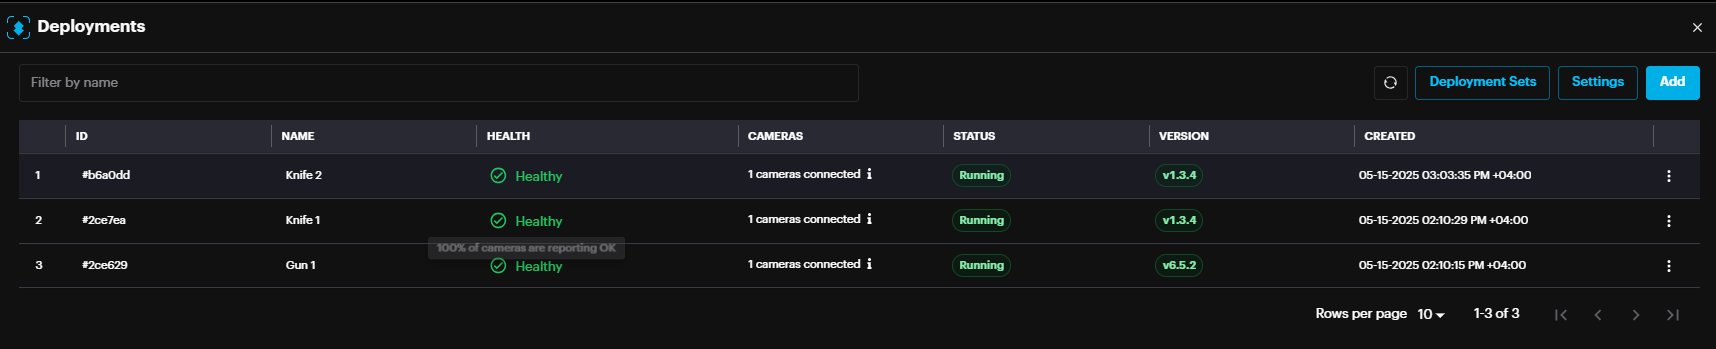
The new deployment will appear with the status (Pending, Waiting or Running).
In the deployment window, click Settings to access configuration specific to the module.
Deployment Settings
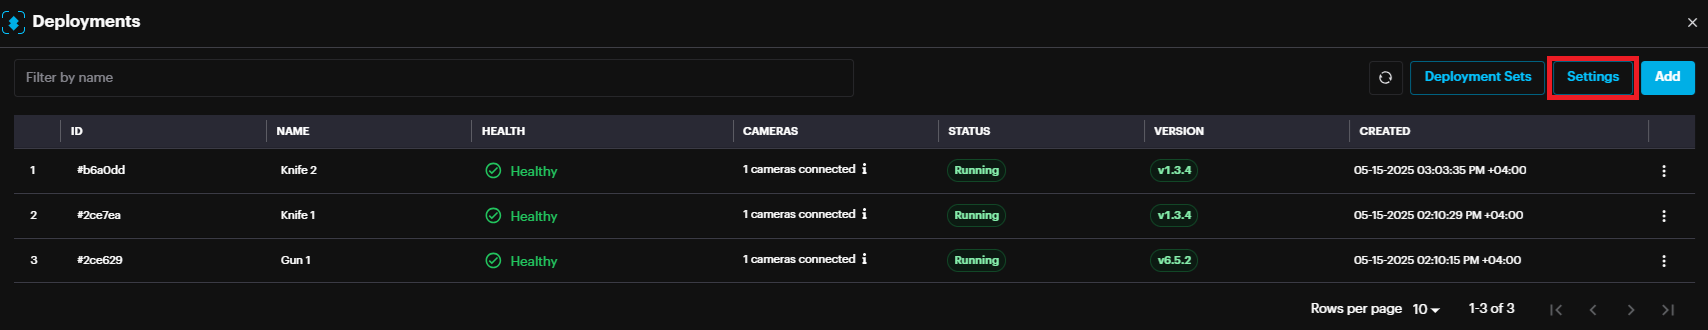
The settings page includes settings specific to the module such as time threshold, sensitivity etc.
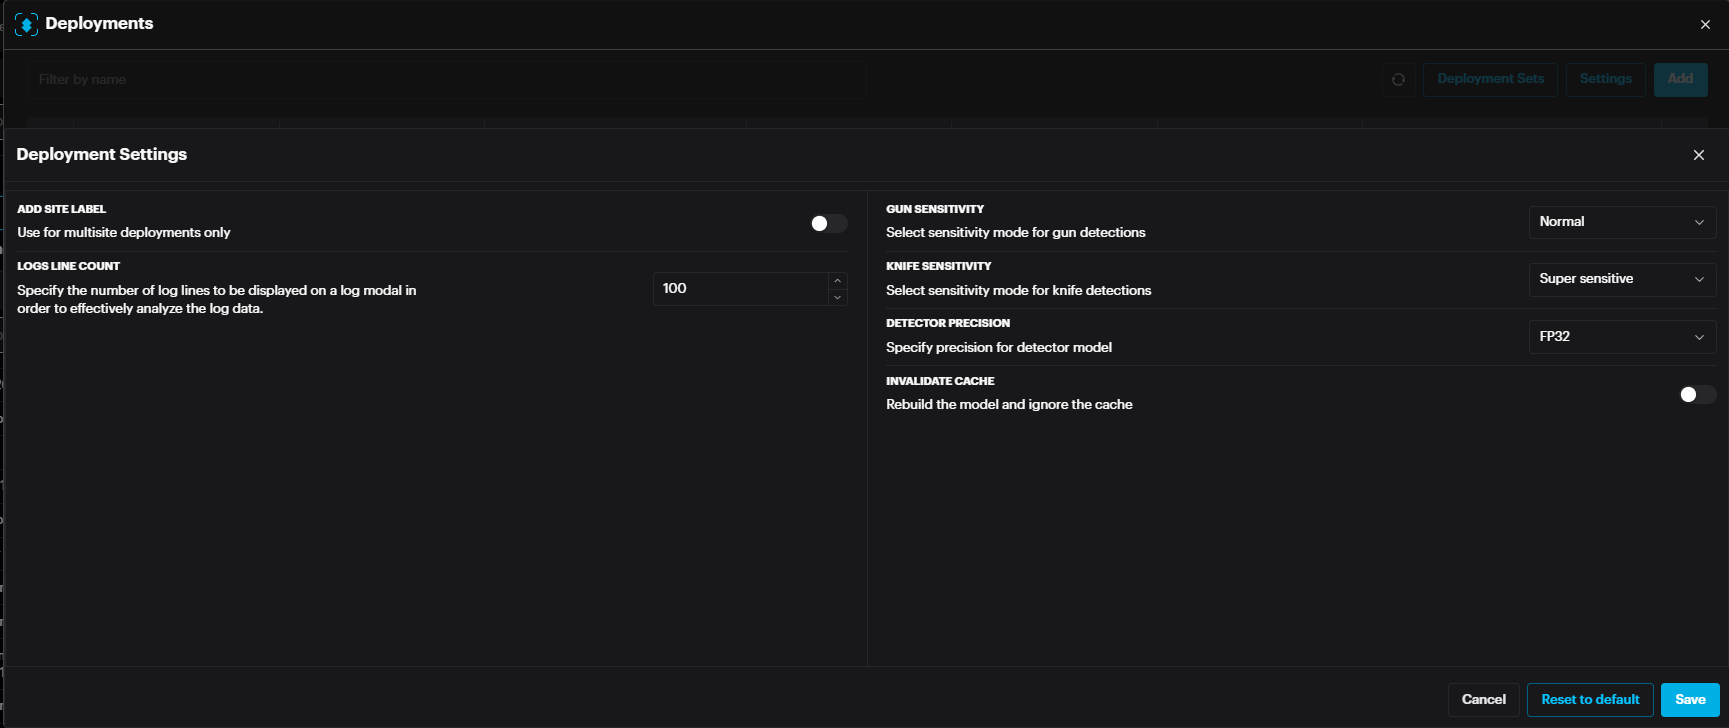
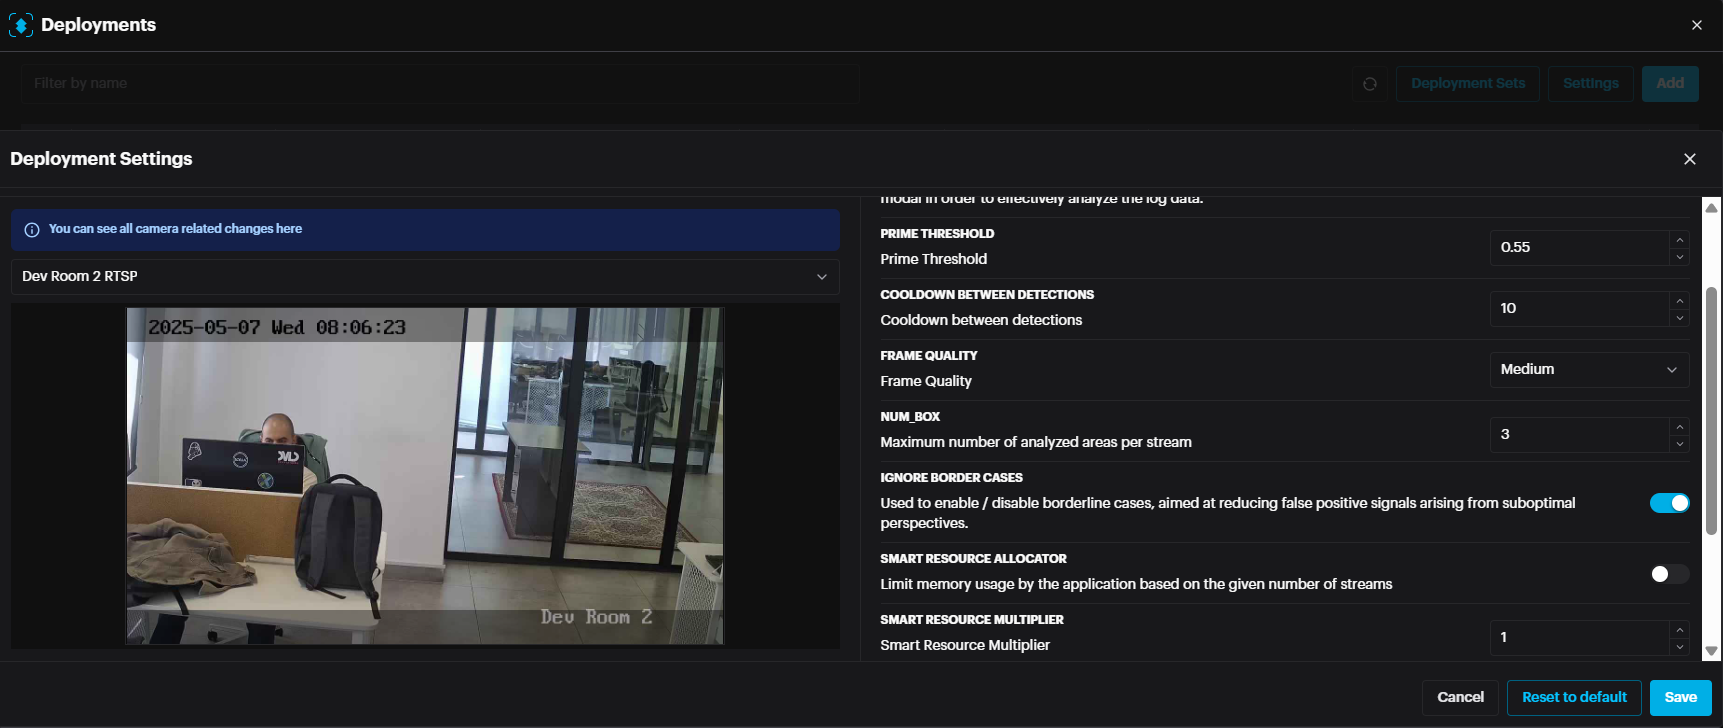
For ADS modules such as Fight, Slip and Fall, Suspicious Shoplifting Behavior, and Smoke/Fire, there are specific settings available:
- Num Box Number: Defines the maximum number of areas analyzed per video stream.
- Ignore Border Cases: Enables or disables detection near the edges of the frame, helping to reduce false positives caused by suboptimal camera angles or edge distortions. Num Box Number: Defines the maximum number of areas analyzed per video stream.
Ignore Border Cases: Enables or disables detection near the edges of the frame, helping to reduce false positives caused by suboptimal camera angles or edge distortions.
When Ignore Border Cases is enabled, a visual indicator on the left side shows the greyed-out border areas where detections will not be triggered. This helps users understand the excluded regions within the frame.
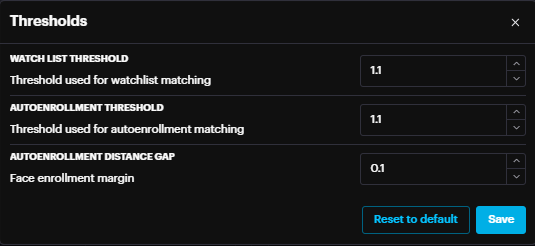
For Face recognition module , the setting includes face size , emotion detection , threshold and more.
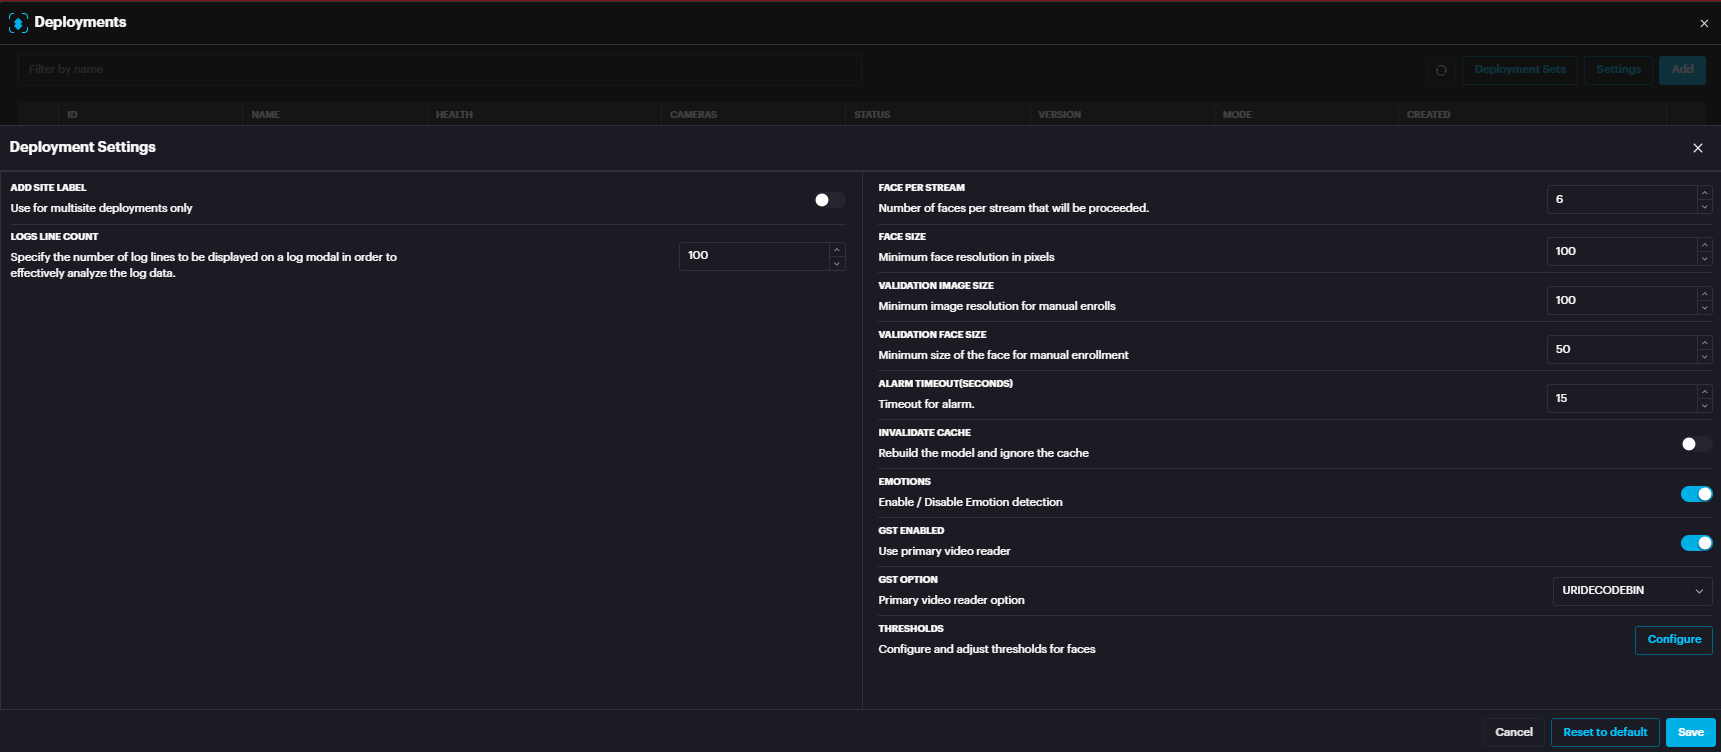
You can control the strictness of the matching criteria for watchlists, or auto-enrollment.
- The threshold range is from 1.0 to 1.2.
- A lower number (closer to 1.0) results in stricter matching.
- A higher number (closer to 1.2) results in looser matching. The threshold range is from 1.0 to 1.2.
A lower number (closer to 1.0) results in stricter matching.
A higher number (closer to 1.2) results in looser matching.
In case of any setting change, click Save.
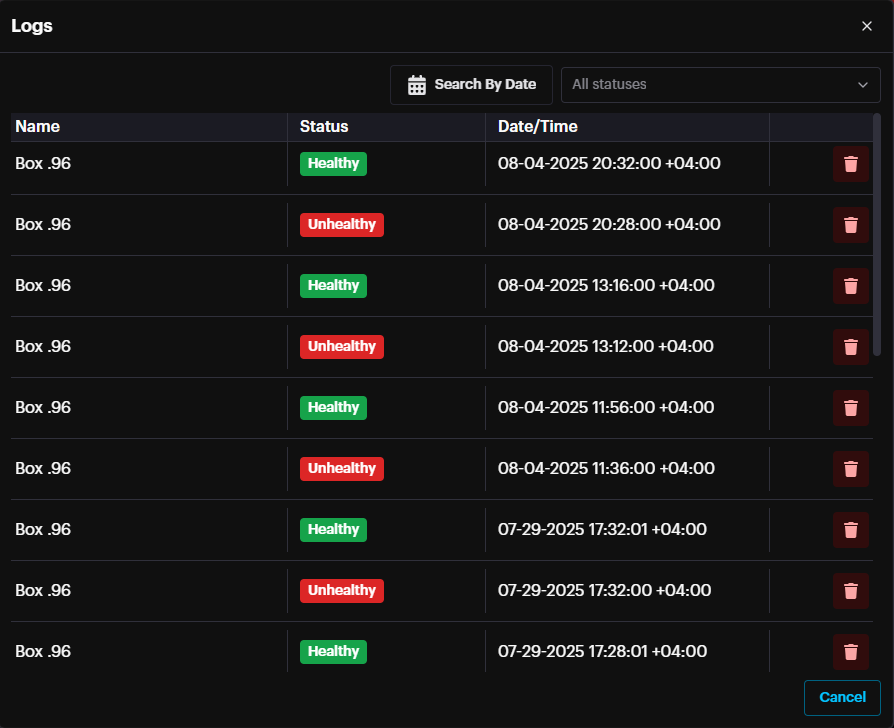
For successful deployment, the deployment status should state Running (usually in few minutes after adding deployment). To refresh the page, click on the refresh button on top right of the window.
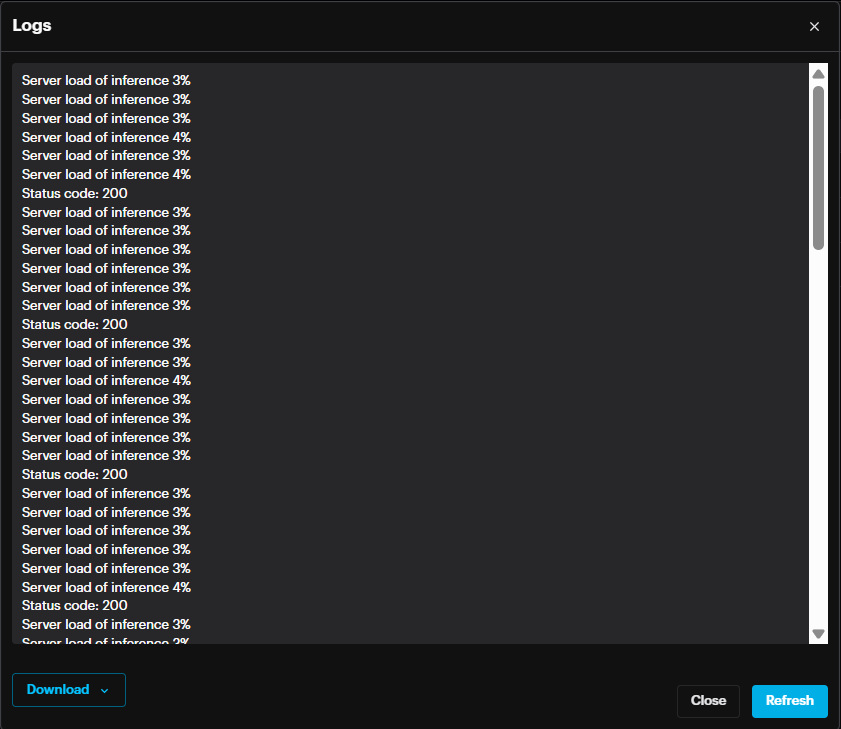
In case the status is not changed to Running, it is possible to check the logs by clicking more options (three dots) then View Logs. In the Logs window it is possible to Download the logs from the bottom left section.
Click the three dots at the end of the record to Restart deployment, Redeploy, Edit deployment or Delete deployment.
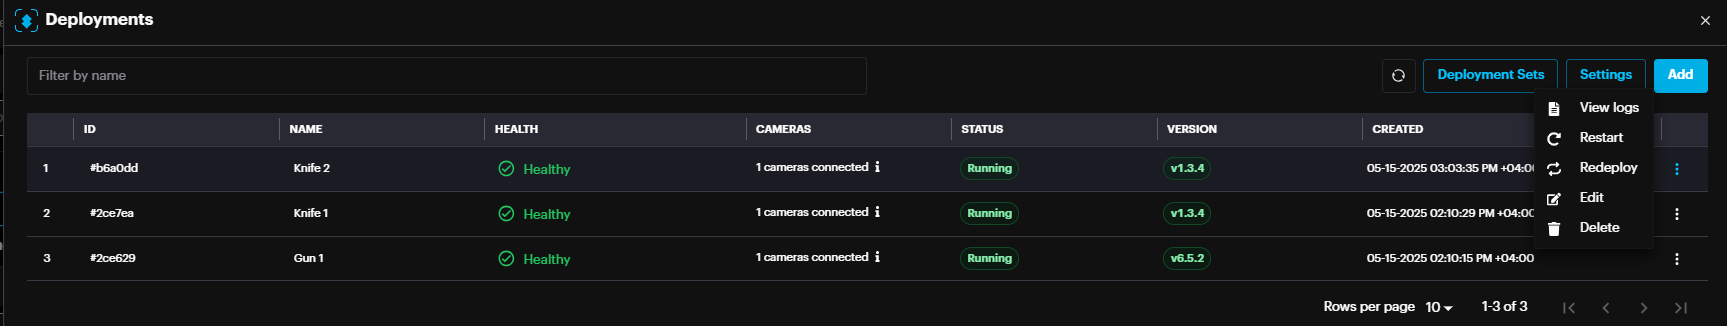
If you modify the deployment settings or a new engine version becomes available (indicated by a warning icon next to the engine version), you can click the Redeploy button. This will function as if you have deleted the deployment, created a new one, and reselected the cameras.
Alarms
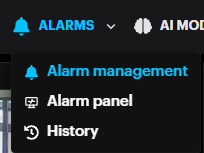
To access Alarms, click on the ALARMS button on the main toolbar. Unlike the previous two toolbar options, which navigate directly to a new site, the ALARMS button will open a drop-down menu, with three options: Alarm Management, Alarm Panel, and History.
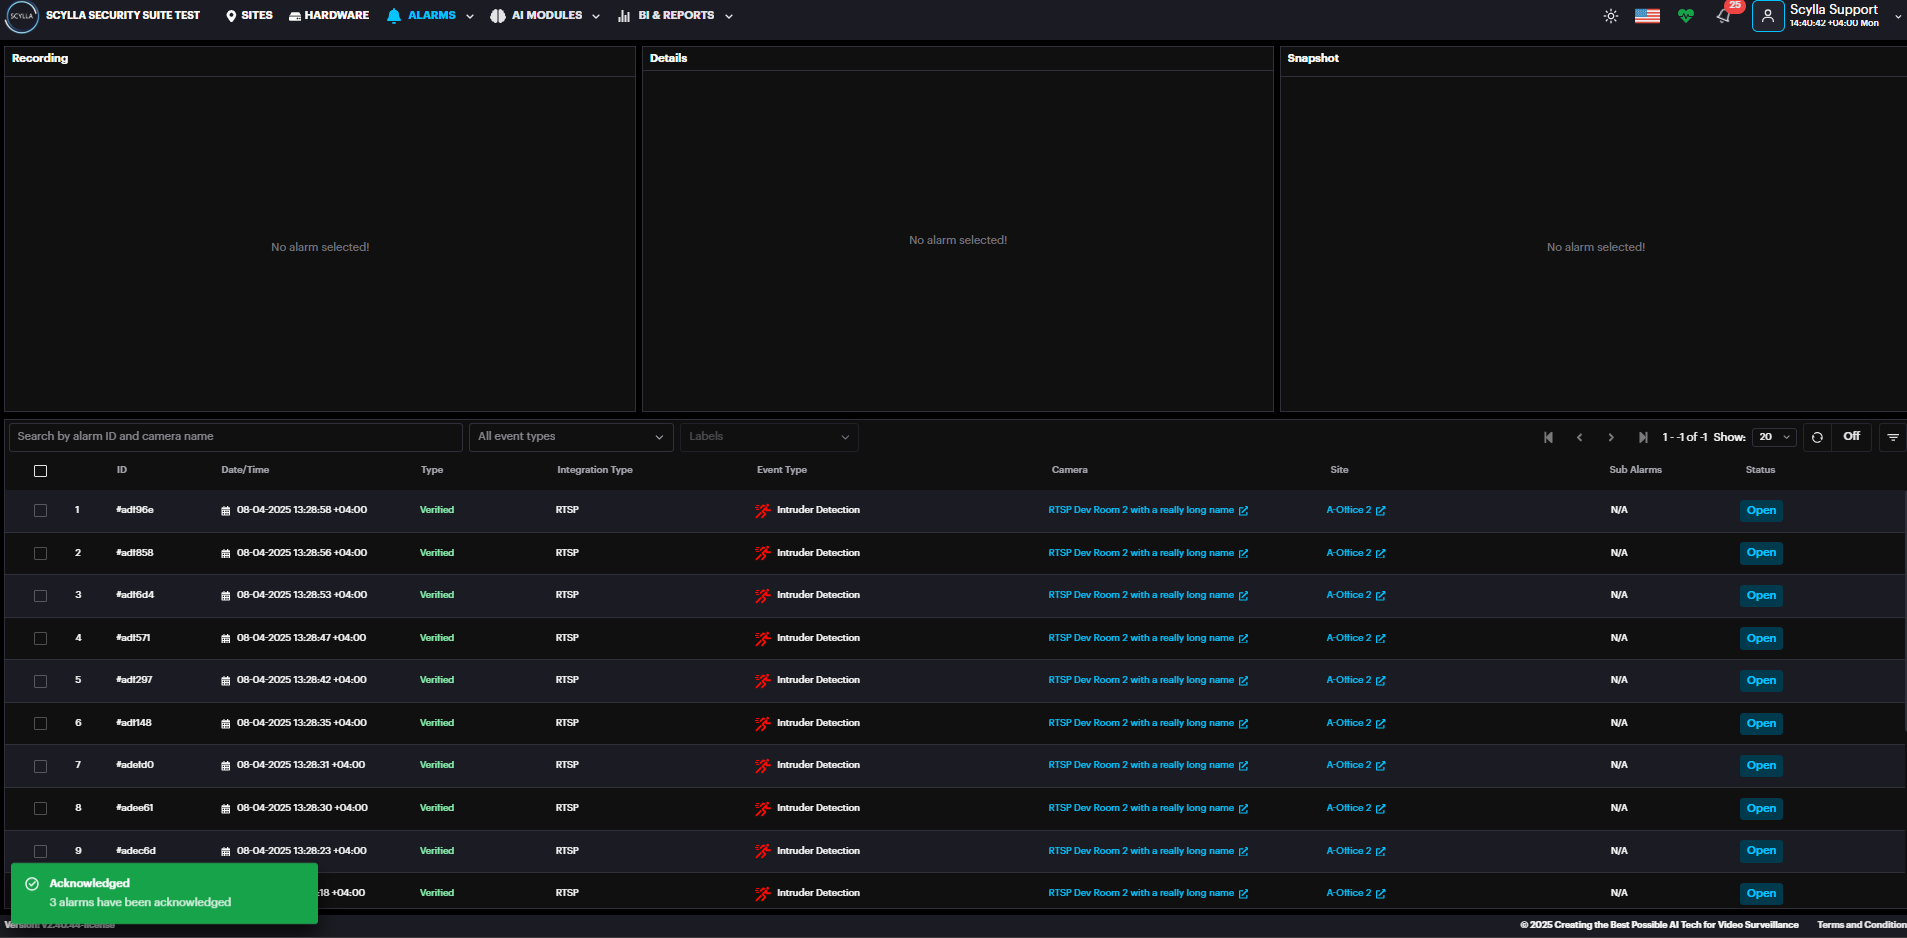
Alarm Management
The Alarm Management dashboard allows for:
- see all alarms from all integrated devices with detailed information.
- see the snapshot of the detection occurrence.
- see the recording of the alarm (if available).
- Acknowledge, Dismiss, Marks as False and Delete the alarm.
- search by alarm ID, Event Type and Labels.
- sort alarms by date or time. see all alarms from all integrated devices with detailed information.
see the snapshot of the detection occurrence.
see the recording of the alarm (if available).
Acknowledge, Dismiss, Marks as False and Delete the alarm.
search by alarm ID, Event Type and Labels.
sort alarms by date or time.
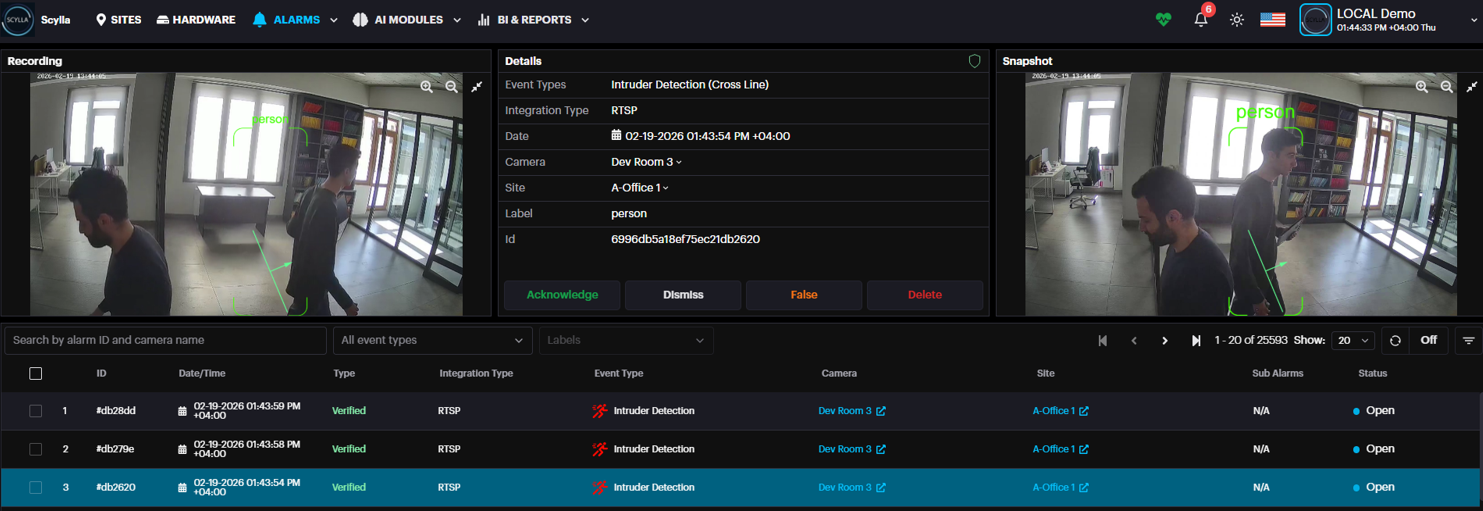
Select the desired alarm to see the snapshot of detection occurrence, and a recording (if available).
![]()
If an integration with a Video Management System (VMS) such as Scylla, Genetec, or Milestone is configured, you can access the long video of an event directly from the VMS.
Note: Recording must be enabled on your VMS for this feature to work.
You can adjust the pre- and post-event video duration by navigating to: Account Menu > Profile > Preferences.
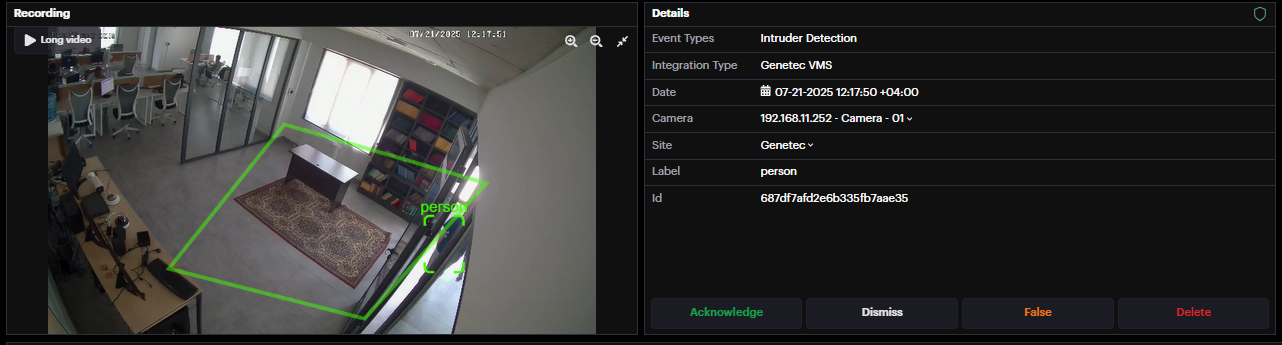
To retrieve the full video of an event from your VMS, click the Long Video button.
Configurable Long Video Retry: A new setting has been added to Profile → Preferences allowing users to configure the retry attempts for pulling the long videos from VMS in case of failure.
- The setting ranges from 1 to 60 attempts.
- Default value is 5. The setting ranges from 1 to 60 attempts.
Default value is 5.
Long Video is also included in the Alarm History records for easier access and review.
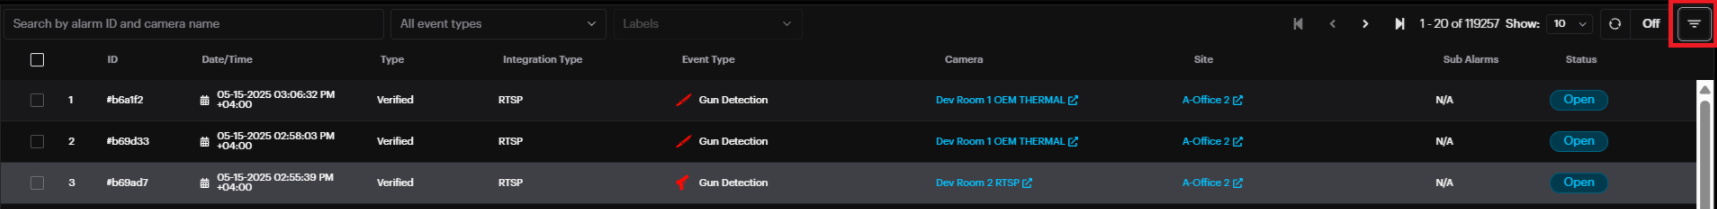
To display all alarms for a specific date or a period, click on the filter button and select the desired date or a period and other filter options by site , label , camera.
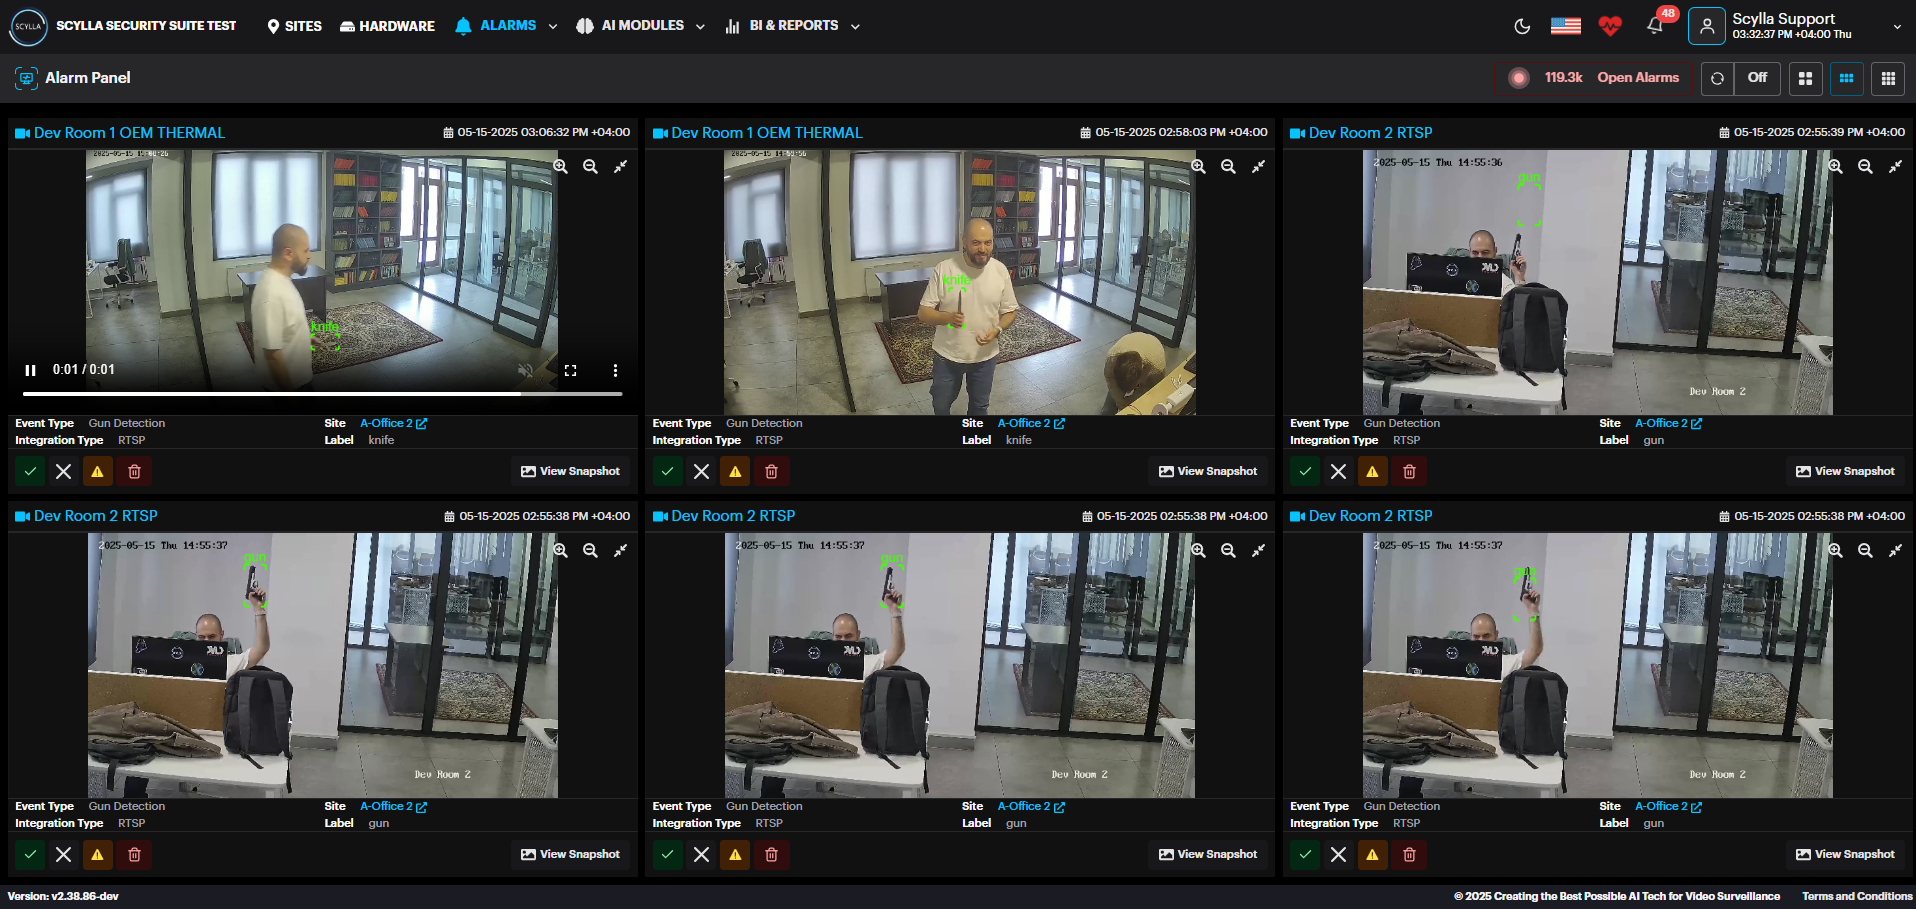
Alarm Panel
Alarm Panel displays incoming alerts in real time, where new alarms will appear Alarm panel as thumbnail. Acknowledge, Dismiss , Mark as False, or Delete the detection by clicking on the corresponding buttons underneath the alarm.
History
Click on the History button to open the Browse Alarms History page but without having
a specific site’s alarm history preselected in the Quick Filters menu.
AI Modules
To access a list of all AI Modules, click on the AI MODULES button on the main toolbar, activating the dropdown menu. Active Modules will be displayed in white, while inactive modules grayed out.
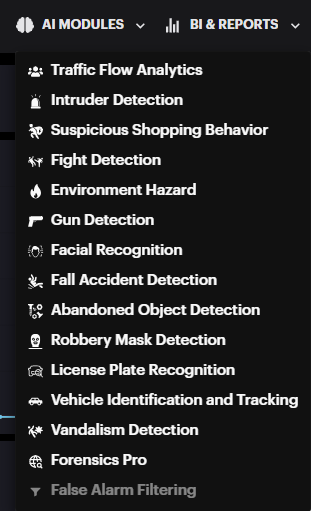
Click on the desired active module to open its dedicated page.
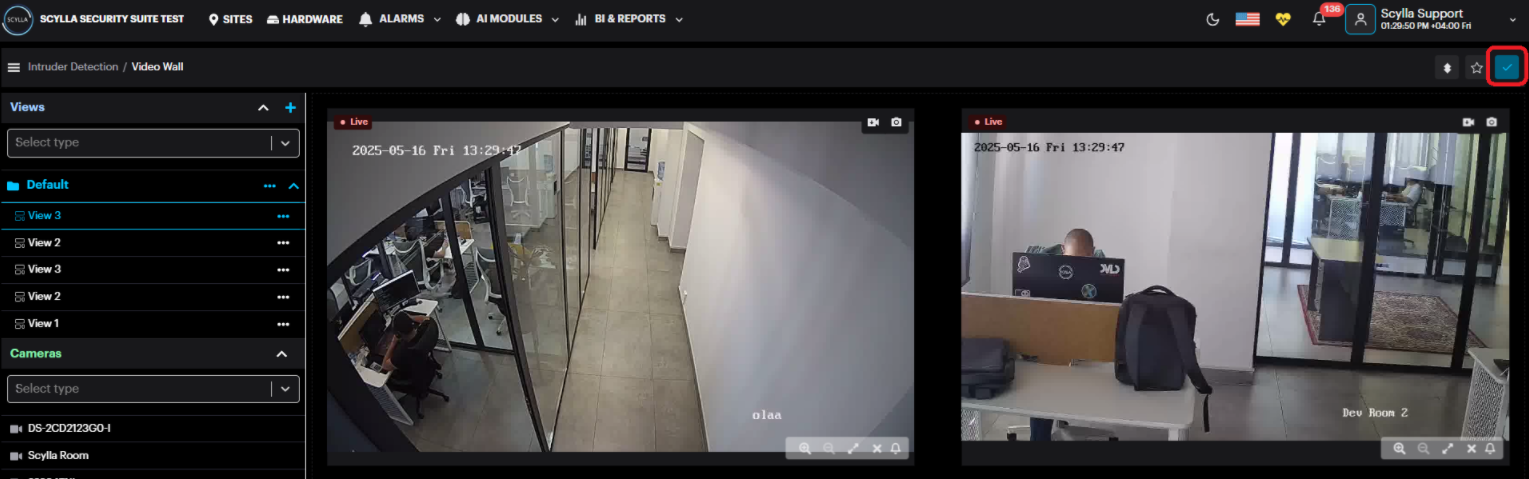
There are three main windows within this page: Video Wall, Views, and Cameras.
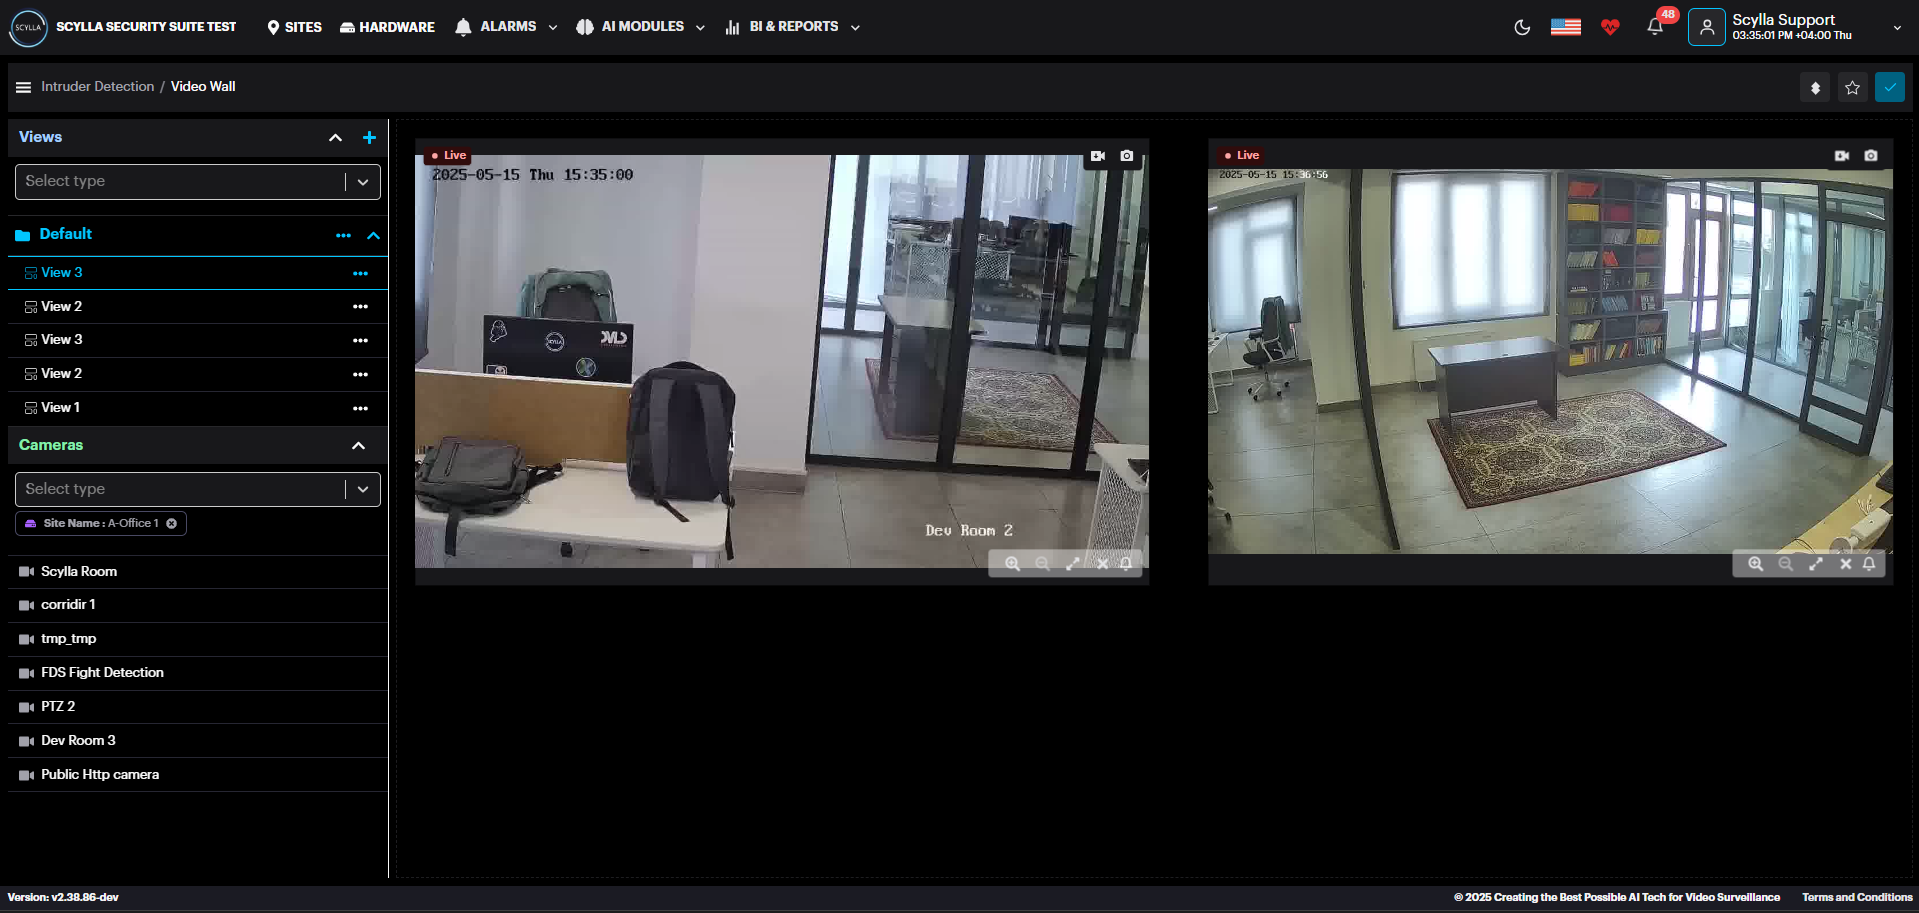
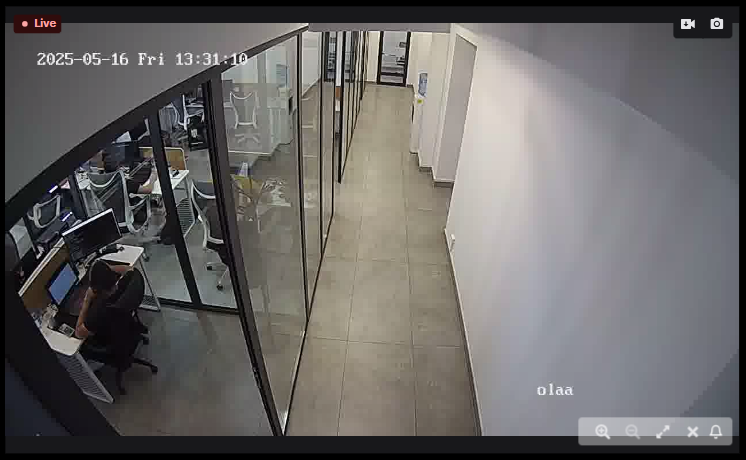
Video Wall
Displays the live streams of connected cameras for the selected model.
Views
Create Groups of Views with customized groups of cameras.
To create the Group, click on the Add new Group button.
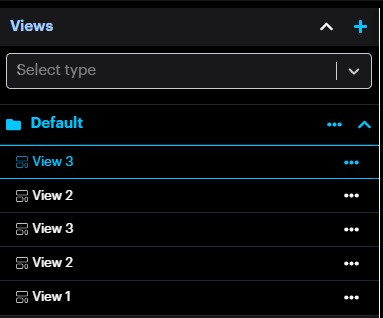
Name the group and click save.

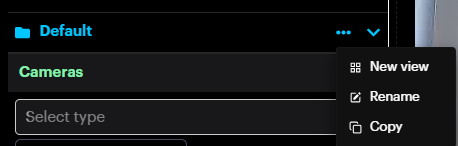
Then, to add View, click on the More Options button on the desired group and click New View. Rename, Copy or Delete the group by clicking the corresponding button.
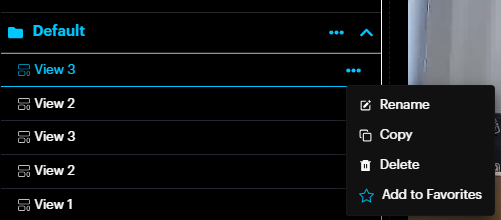
The newly added View will appear inside the group. Rename, Copy, Delete and
Add to Favorite by clicking the corresponding button.
After creating a View, add cameras to customize it. Drag and drop cameras from the Cameras section to create custom layout or use predefined layouts. After adding the cameras click the Save button.
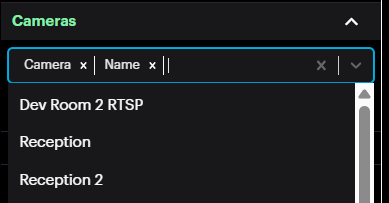
Cameras
On the Cameras section, select existing cameras from the list to add them into Views. There is also option to filter cameras by Group, Site and Camera.
Camera thumbnail has the following features:
- Download 10 sec record.
- Download screenshot.
- Zoom In
- Zoom Out
- Full Screen
- Remove Camera from view.
- Alarm Preview Download 10 sec record.
Download screenshot.
Zoom In
Zoom Out
Full Screen
Remove Camera from view.
Alarm Preview
Face Recognition Layout
Enrollment Matches Page
The Enrollment Matches page displays all matches in a grid view with information such as Site , Camera . Date/time , Name & In watchlist/Whitelist (if true) in real time. A filter panel is available on the left side, allowing you to refine and narrow down the displayed matches.
Clicking on a match opens a details panel on the right side of the page. This panel displays additional information about the match, such as name, age, gender, emotion and more.
It also provides quick action buttons:
-
Search with Image – Filters and displays all matches for the same face image, allowing you to track every occurrence of that face. Search with Image – Filters and displays all matches for the same face image, allowing you to track every occurrence of that face.
-
Add to Watchlist – Adds the face to the watchlist. Add to Watchlist – Adds the face to the watchlist.
-
Add to Whitelist – Adds the face to the whitelist. Add to Whitelist – Adds the face to the whitelist.
A scroll-down button is added to the Grid view in Enrollment Matches & Enrollment Faces pages that quickly navigates to the bottom of the page.
Enrolled Faces Page
The Enrolled Faces page displays a database of all faces. You can view the faces in either List View or Grid View.
In Grid View, clicking on a face opens a details panel on the right side. From this panel, you can:
-
Edit face-related information. Edit face-related information.
-
Add the face to the watchlist or whitelist. Add the face to the watchlist or whitelist.
-
See detections, which will redirect to the Enrollment Matches page showing only the matches for that specific face. See detections, which will redirect to the Enrollment Matches page showing only the matches for that specific face.
Real-time people counting
The Traffic Flow Analytics module now supports real-time people counting directly within the camera’s live view. By configuring virtual crosslines, the system can monitor entrances and exits to calculate and display live occupancy data.
To enable people counting on your device, follow the procedure below:
-
Access Event Rules: Access Event Rules:
- Navigate to the Traffic Flow Analytics module.
-
Navigate to the Traffic Flow Analytics module. Navigate to the Traffic Flow Analytics module.
- Select Event Rules from the menu.
-
Select Event Rules from the menu. Select Event Rules from the menu.
- Click Add to create a new rule.
-
Click Add to create a new rule. Click Add to create a new rule.
-
Define Rule Type: Define Rule Type:
- Select Crossline as the rule type.
-
Select Crossline as the rule type. Select Crossline as the rule type.
- Set the Action Type to Count.
-
Set the Action Type to Count. Set the Action Type to Count.
-
Draw Detection Lines: Draw Detection Lines:
- On the configuration page, select the desired camera.
-
On the configuration page, select the desired camera. On the configuration page, select the desired camera.
- Click the Draw Lines button to initialize the camera frame interface.
-
Click the Draw Lines button to initialize the camera frame interface. Click the Draw Lines button to initialize the camera frame interface.
- Using the mouse, draw the crossline(s) across the intended detection area.
-
Using the mouse, draw the crossline(s) across the intended detection area. Using the mouse, draw the crossline(s) across the intended detection area.
- Observe the Reference Direction (Arrow) displayed on the line.
-
Observe the Reference Direction (Arrow) displayed on the line. Observe the Reference Direction (Arrow) displayed on the line.
- Click Save
-
Click Save Click Save
-
Set Directionality: Set Directionality:
- Enable the Line
-
Enable the Line Enable the Line
- Define the counting logic based on the arrow's orientation:
-
Define the counting logic based on the arrow's orientation: Define the counting logic based on the arrow's orientation:
- Inward: Counts individuals moving in the same direction as the reference arrow.
- Inward: Counts individuals moving in the same direction as the reference arrow.
-
Inward: Counts individuals moving in the same direction as the reference arrow. Inward: Counts individuals moving in the same direction as the reference arrow.
- Outward: Counts individuals moving in the opposite direction of the reference arrow.
- Outward: Counts individuals moving in the opposite direction of the reference arrow.
-
Outward: Counts individuals moving in the opposite direction of the reference arrow. Outward: Counts individuals moving in the opposite direction of the reference arrow.
-
Save Settings: Save Settings:
- Click Save to apply the rule.
-
Click Save to apply the rule. Click Save to apply the rule.
- In few moments the new rule will be applied to configuration.
-
In few moments the new rule will be applied to configuration. In few moments the new rule will be applied to configuration.
-
Now in the Videowall page , drag and drop the camera and you will see the crossline(s) and the counter at the bottom Now in the Videowall page , drag and drop the camera and you will see the crossline(s) and the counter at the bottom
-
By clicking Occupancy detail button in the camera window , the occupancy details window will pop up showing the details.

If you want to reset the count , click the reset count button
IDS Crossline
Crossline (also referred to as tripwire) detection is an advanced capability of the Intrusion Detection System (IDS). In this mode, the system continuously detects and tracks objects within the camera’s field of view, but generates an alarm only when a detected object crosses a predefined virtual line.
-
Line crossings can be evaluated in two ways: bidirectional/tripwire, where crossings are detected regardless of direction, or directional/crossline, where an alarm is triggered only when the object crosses the line in a specified direction.
-
Perimeter Intrusion detection and crossline detection are mutually exclusive operating modes. Only one mode can be active at any given time; they cannot be enabled simultaneously unless the same camera is deployed twice. Each mode has different hardware and computational requirements. Before switching to crossline mode, it is important to ensure that sufficient system resources are available. This can be verified by contacting Scylla Support or by using the online Hardware Calculator available at www.scylla.ai.
-
Crossline detection has stricter pixel-per-meter (PPM) requirements than standard intrusion detection. For person detection, the minimum required PPM is 45, compared to 15 PPM for standard intrusion detection. In practical terms, this means that crossline detection is effective at approximately three times shorter distances than general detection mode.
-
In the current software version, only one crossline can be configured per camera view but upcoming version will allow more. When defining the line, it is important to note that an alarm is triggered as soon as any part of the detected object—specifically, any pixel of the object’s bounding box—crosses the line.
-
Crossline detection allows configuration of Objects of Interest. Only the selected object classes are evaluated for line-crossing events; all other detected objects are ignored and treated as background.
Follow these steps to set up and customize a Crossline detection zone for your Intruder Detection System (IDS).
- Accessing Settings Navigate to the Hardware tab in the main menu.
Select Camera -> More options -> Settings.
Choose Intruder Detection as Category.
Select Crossline from the dropdown.
Click Next to proceed to the configuration interface.
- Defining the Detection Line A drawing pop-up window will appear, displaying the camera frame.
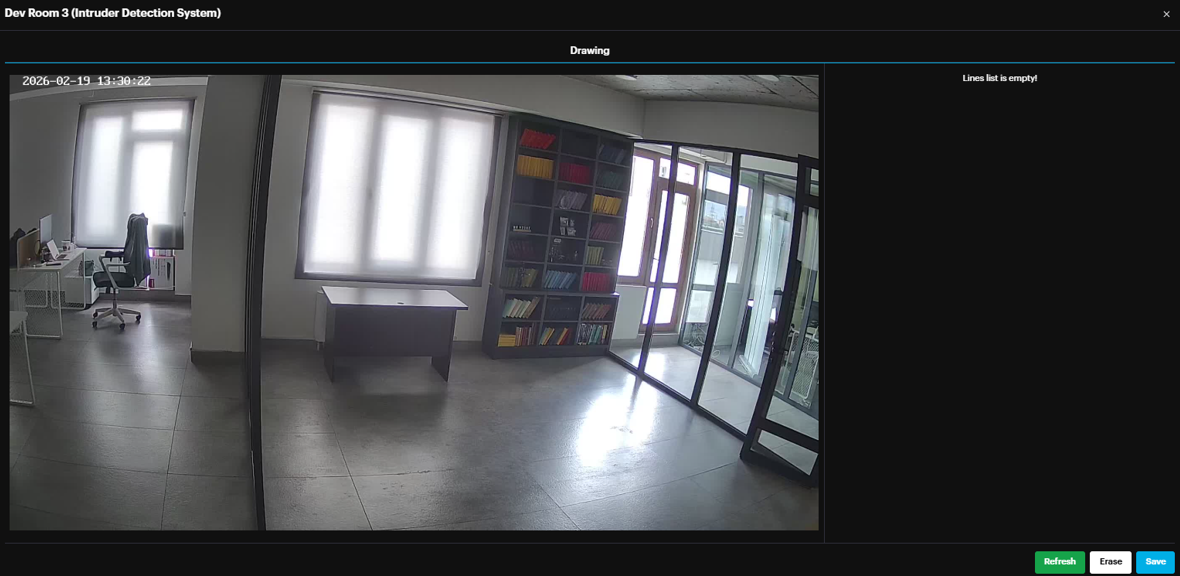
Draw: Use your cursor to draw the crossline directly onto the camera frame where you wish to monitor transit.
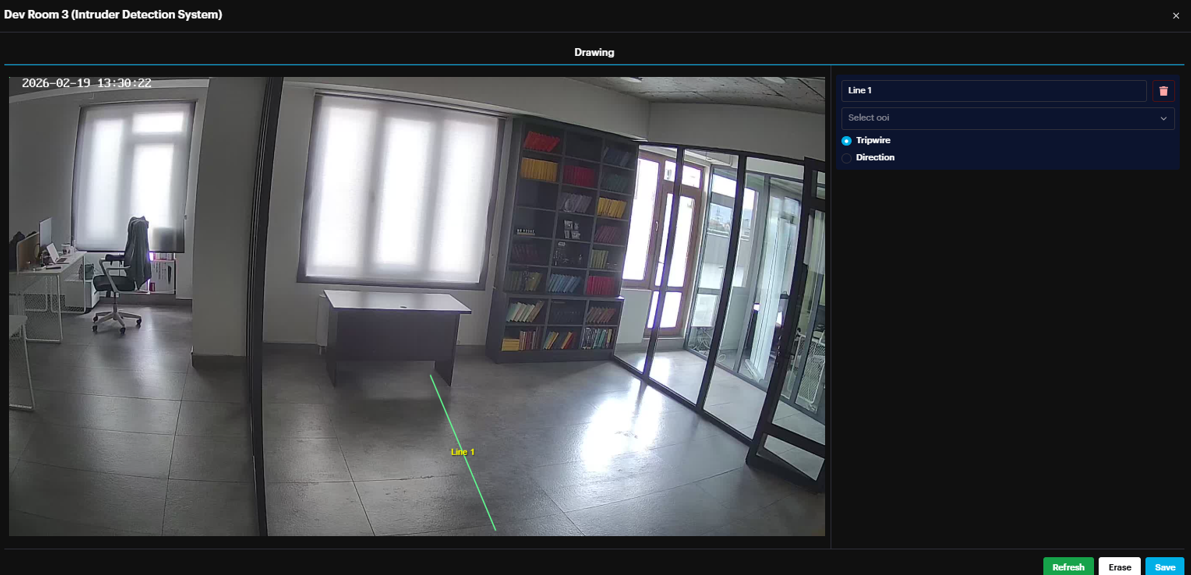
- Configuring Parameters and Direction Once the line is drawn, define the logic for triggering an alarm:
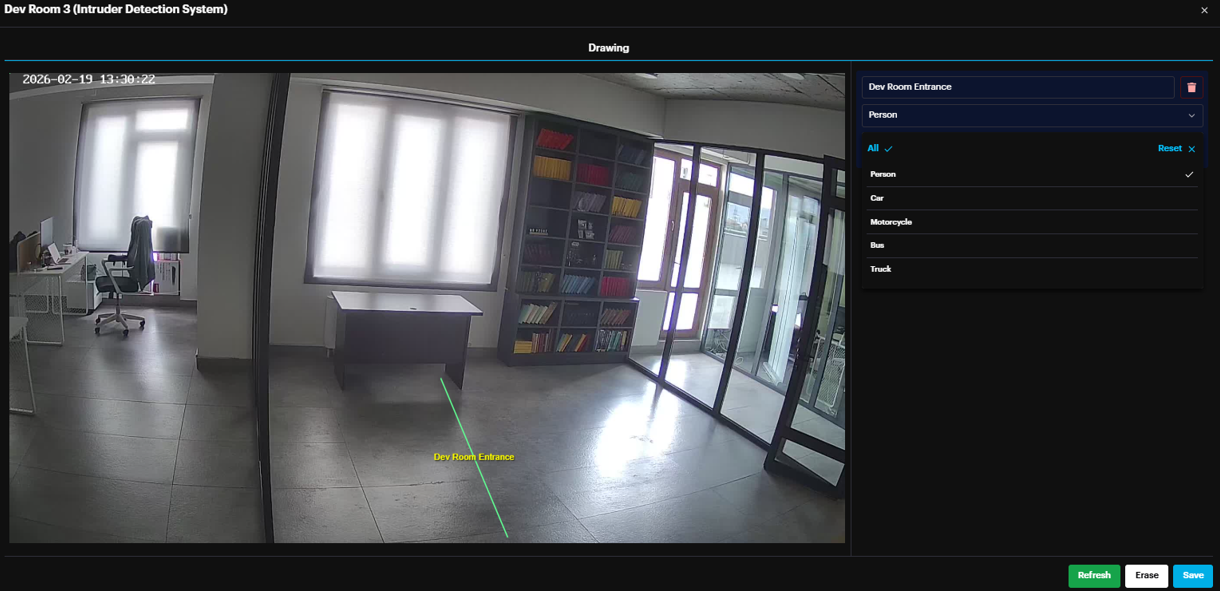
Name: Assign a unique label to the crossline.
Object of Interest: Select the specific object type(s) (e.g., person, car, motorcycle, bus, truck) that should trigger the system.
Trigger Logic:
Tripwire (Bidirectional): Select this to trigger an alarm regardless of which way the object crosses the line.
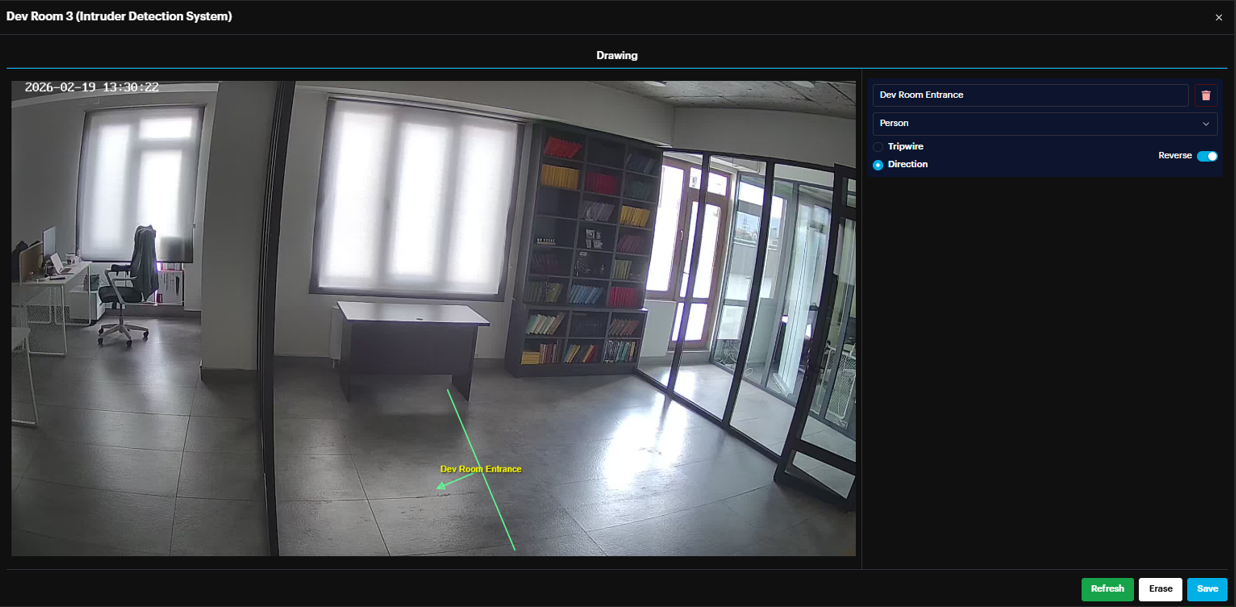
Direction: Select this to trigger an alarm only when an object moves in a specific direction.
Adjusting Flow: If the Direction option is selected, an arrow will appear on the frame. To detect movement in the opposite direction, click the Reverse toggle switch to flip the arrow's orientation.
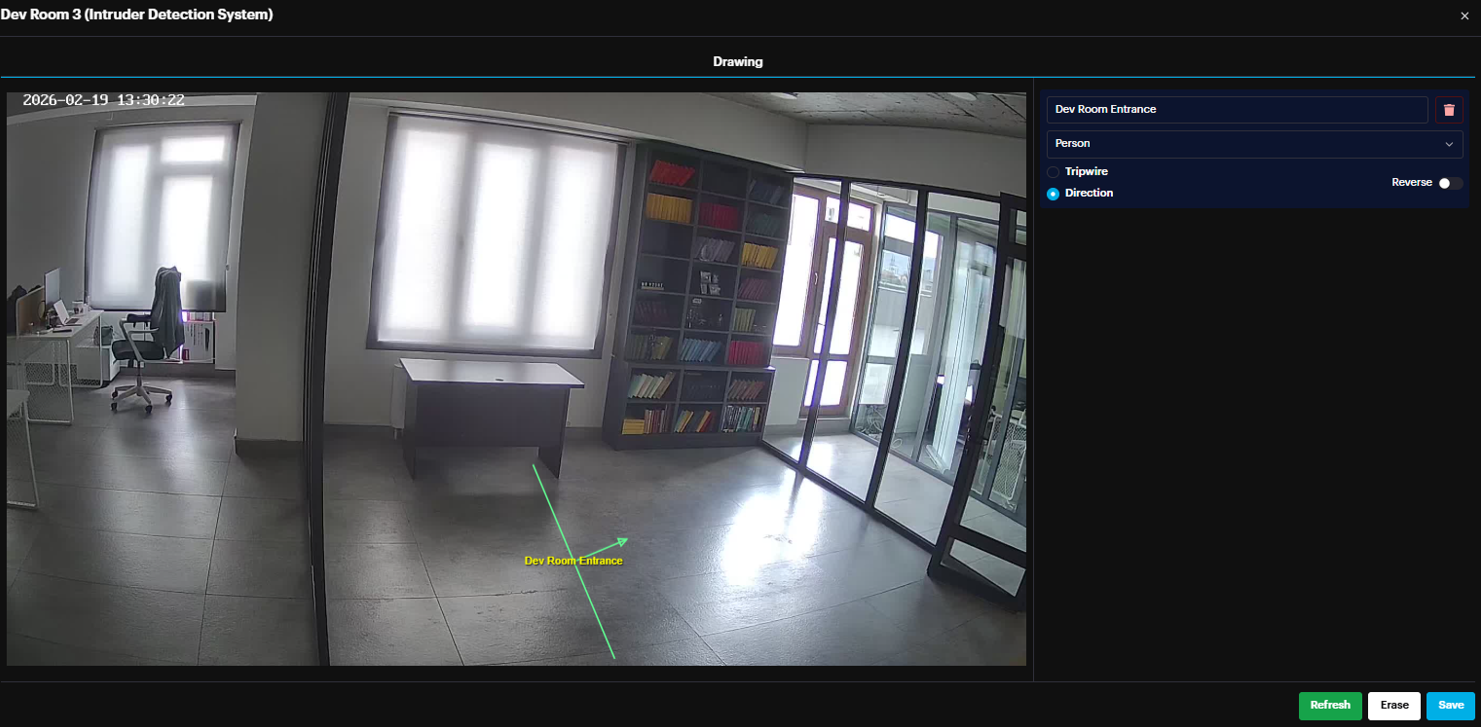
Click Save and make sure the camera is deployed in Intruder Detection AI module. Now if an intruder crosses the line in the specified direction an alarm is triggered showing the crossline direction with video and snapshot evidence.
SCYLLA BI
SCYLLA BI enables users to create dashboards and incorporate various metrics derived from data collected through the following AI modules: Traffic Flow Analytics, Facial Recognition, Vehicle Identification and Tracking. These metrics offer valuable business intelligence insights.
For more details, please refer to the SCYLLA BI manual.
REPORTS
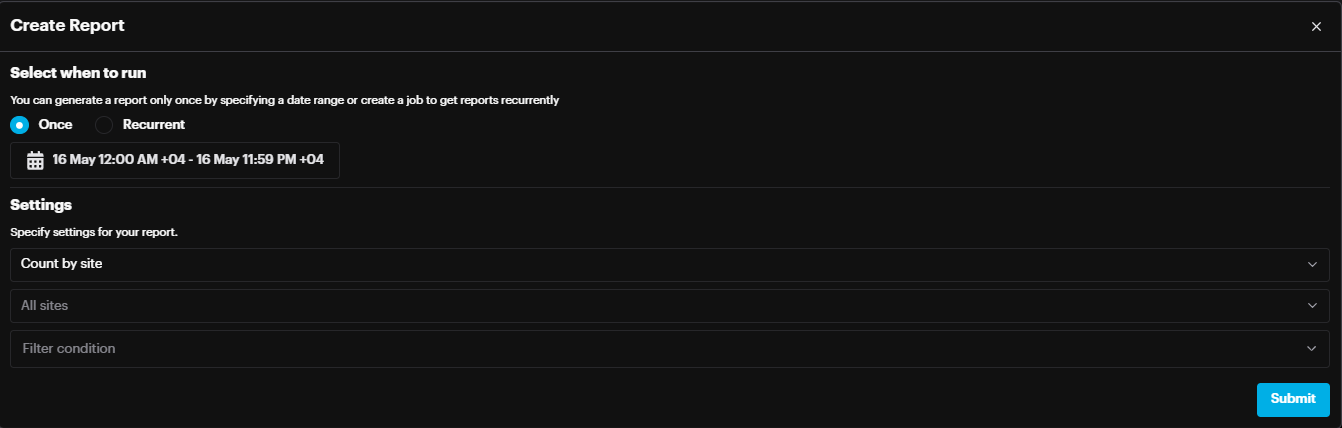
You can create a report from this page by clicking the Create Report button.

On the Create Report pop-up select the report generation type (once or recurrently), desired date or a period specify settings for your report and click Submit
![]()
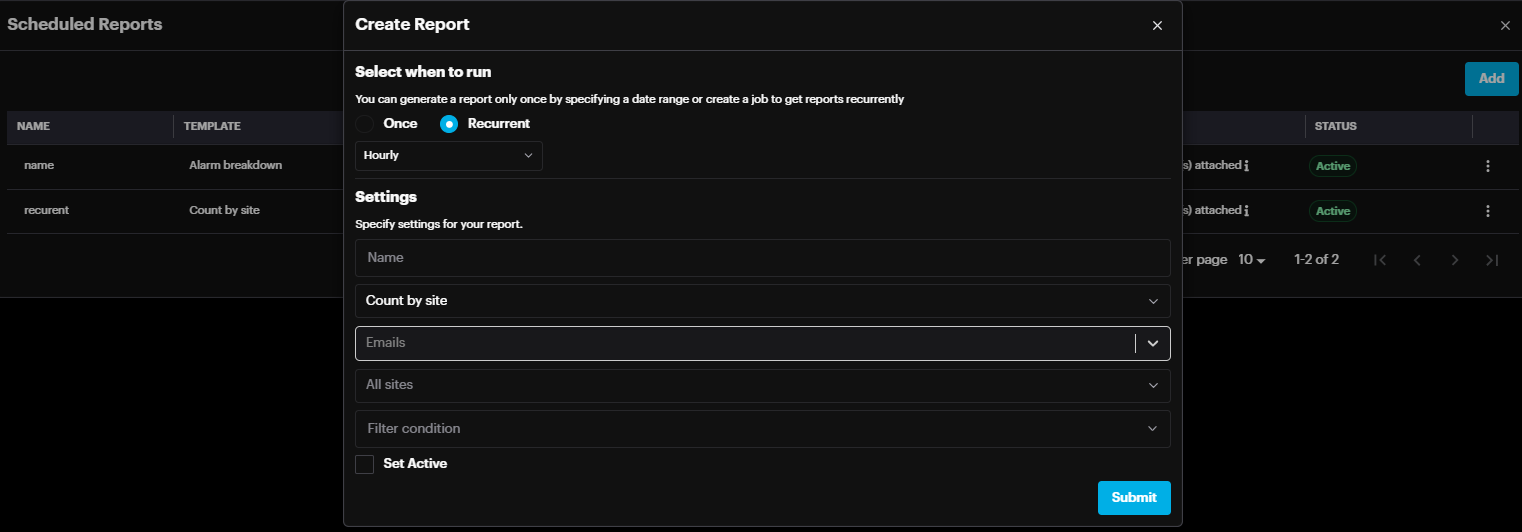
To view scheduled reports or add a new one, click the Scheduled Reports button.
In the Scheduled Reports pop-up, click the Add button. On the Create Report page, choose the report generation type (one-time or recurring), configure the report settings, and click Submit to finalize.
Dark/Light Mode
The User Interface includes a Dark/Light mode feature, allowing users to choose their preferred display mode. To switch between Dark and Light modes, simply click the mode button located in the top menu bar.

Clicking the mode toggle button in the top menu bar will switch the interface to Light mode (if currently in Dark mode), or to Dark mode (if currently in Light mode).
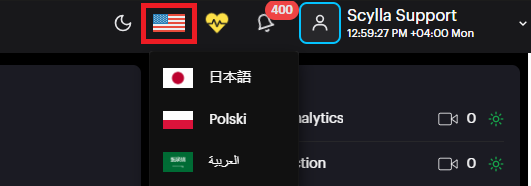
Language
Users can select their preferred language for the interface. Scylla currently supports the following languages:
- English (default)
- Polish
- Japanese
- Arabic
To change the language, click the language button and choose from the available options.
Notification
The notification menu alerts you to events such as Asteria and Netrinos connectivity status (e.g., online or offline).
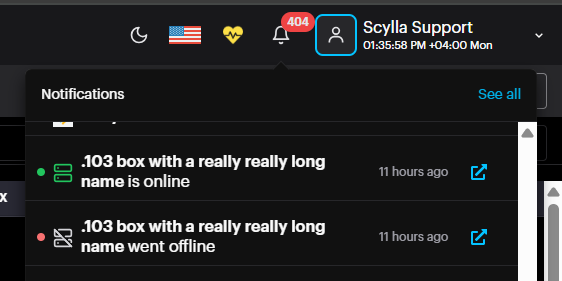
To view all notifications history , click the See All button.
Profile
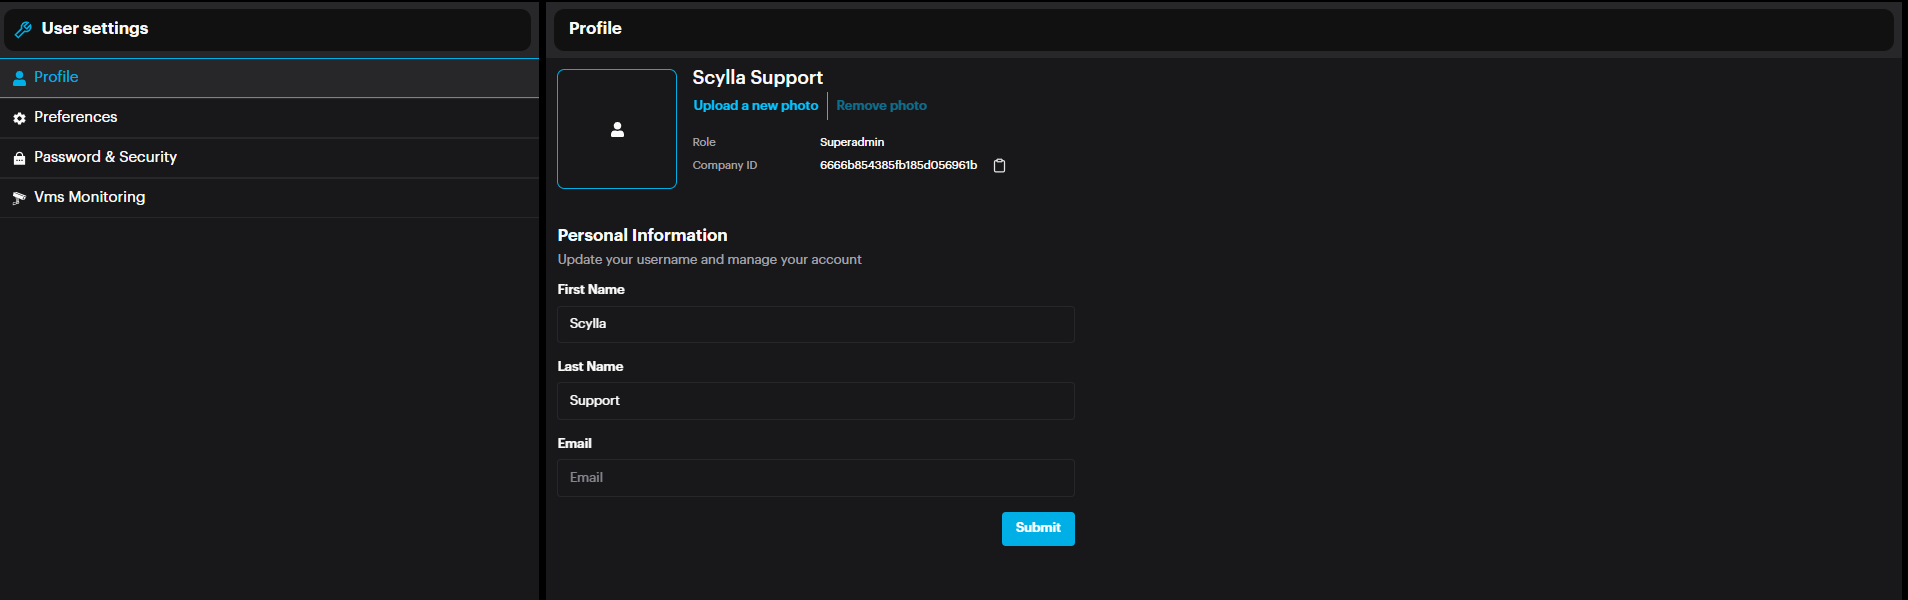
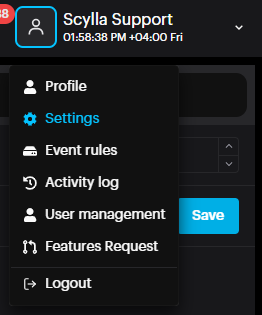
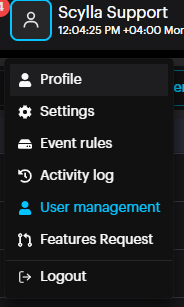
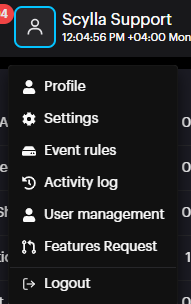
To access User Settings, click your username or profile picture located in the top-right corner of the main toolbar, then choose Profile from the dropdown menu.
From the Profile page, view and edit the user account’s personal information (Name & email address) & photo, and view the role.
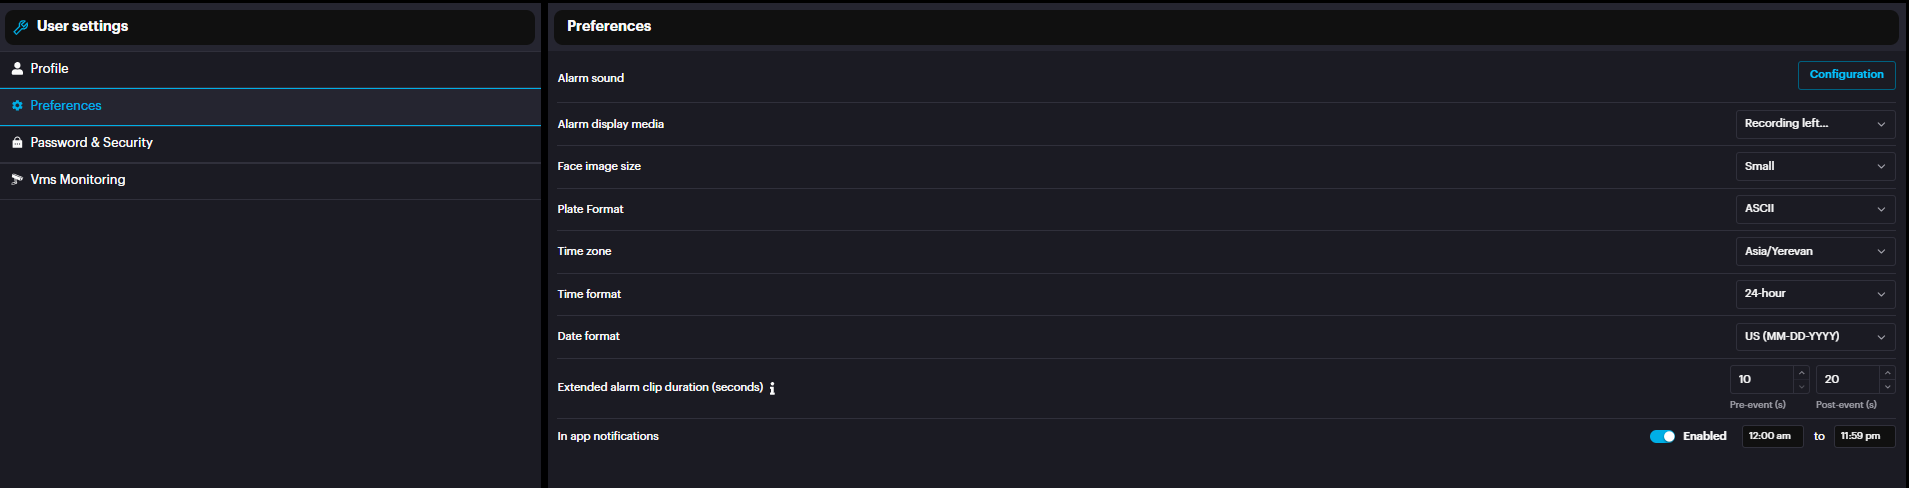
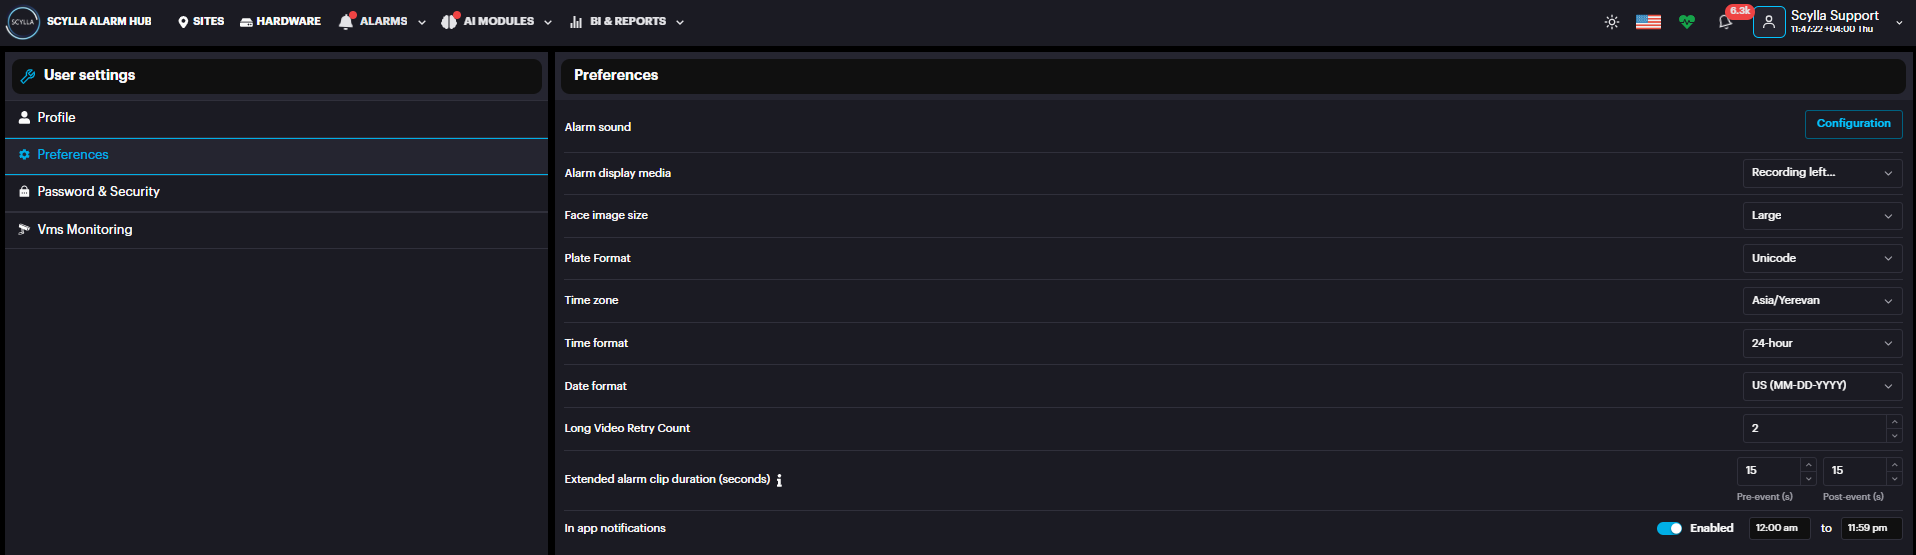
In the Preferences section, which is per user configuration, Configure the Alert sound settings by clicking on the Configuration button. Select the preferred Alarm display media( Recording,Snapshot, Full frame or snapshot, Recording Left Snapshot Right ). Set the Face image size to be displayed once an alarm occurs, as well as the Time zone , Time format and Date format. License Plate format can be set as ASCII or Unicode to display the plate number on scylla dashboard based on the user preference. To configure Pre/Post event video duration , set the desired Extended alarm clip duration (seconds). Turn notifications on or off for when another user is processing the same alarms. You can also set a schedule for when these notifications are active
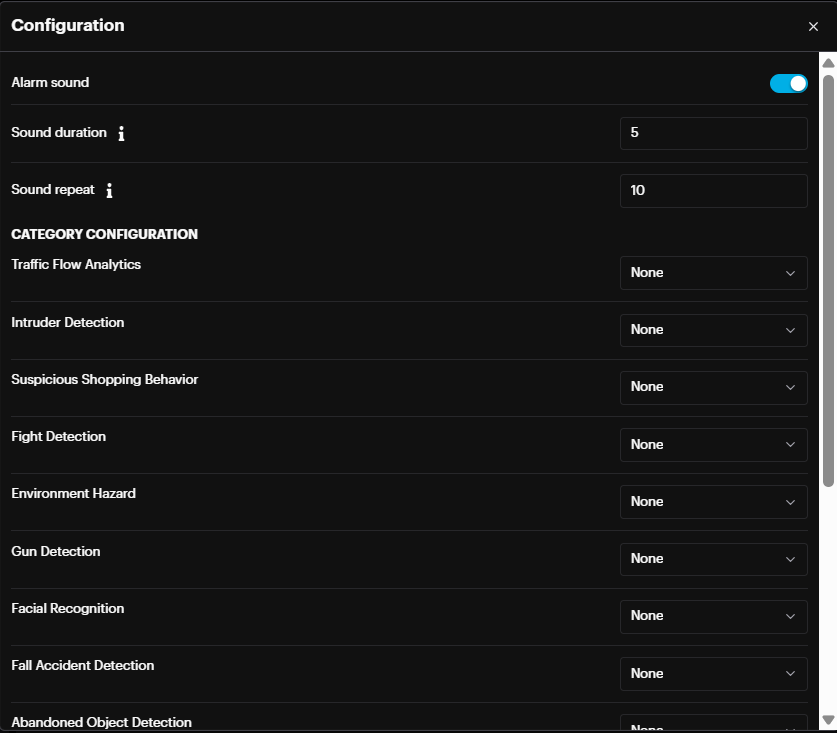
From the Configuration window, toggle the Alarm Sound On or Off. Also set the Sound duration and Sound repeat in seconds. In the Category Configuration section, select a sound for each module.
In the Password & Security section, can change the password of the current account and/or Enable Two Factor Authentication.
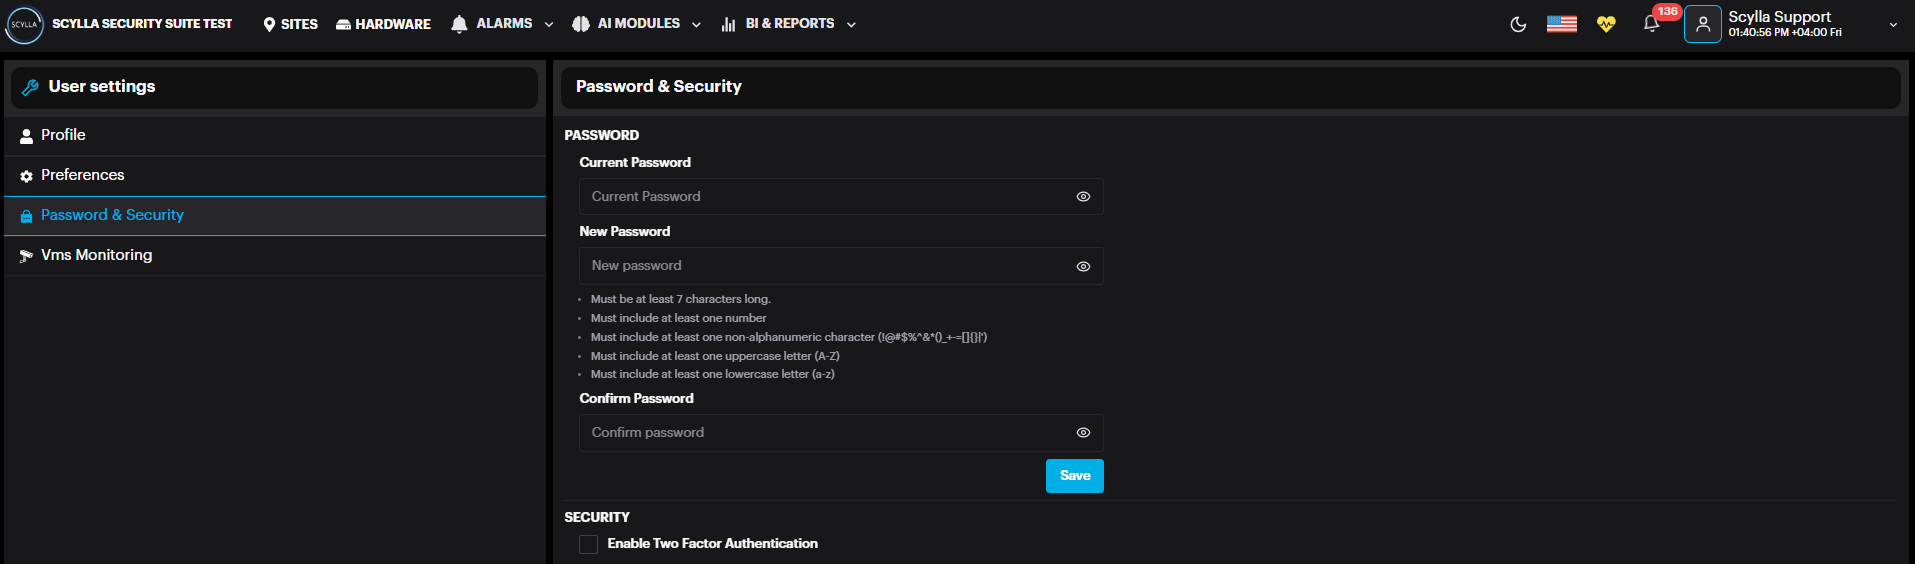
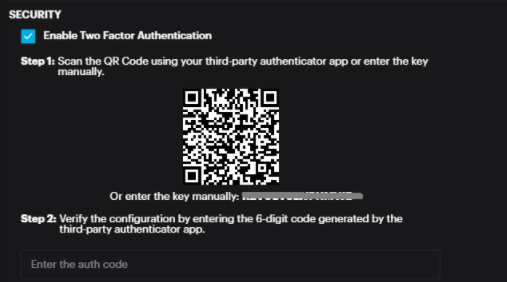
Once Two Factor Authentication is enabled, two steps will appear to complete the configuration.
Step1: Scan the QR code using your party authenticator app or enter the key manually.
Step2: Verify the configuration by entering the 6-digit code generated by your third-party authenticator app.
In the VMS Monitoring section , integration with Scylla VMS client application is created by mapping the cameras on Scylla Dashboard to cameras on VMS and hence triggering VMS client actions once there are alarms.
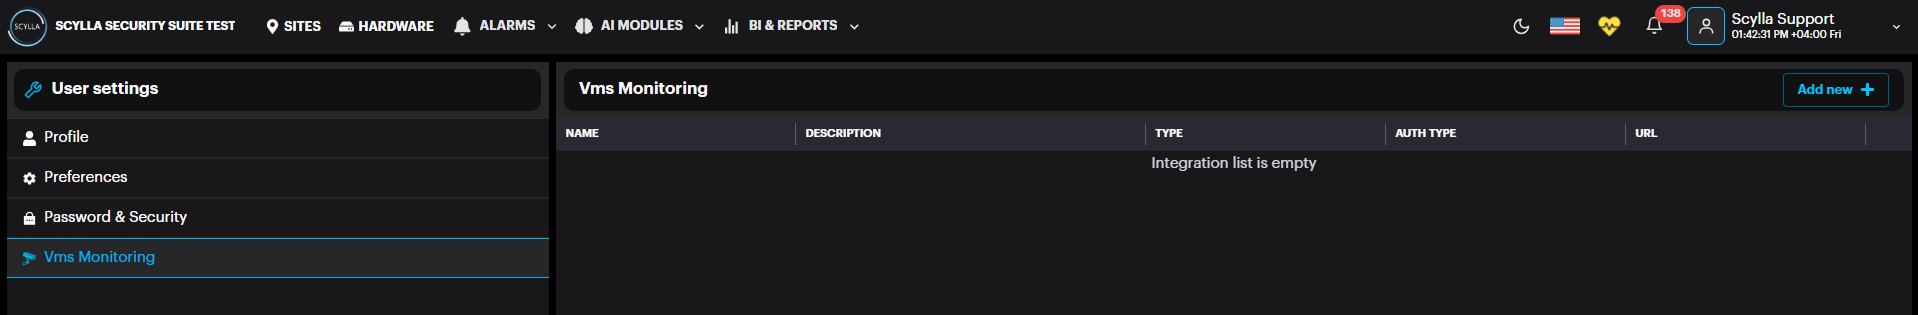
Adding new integration
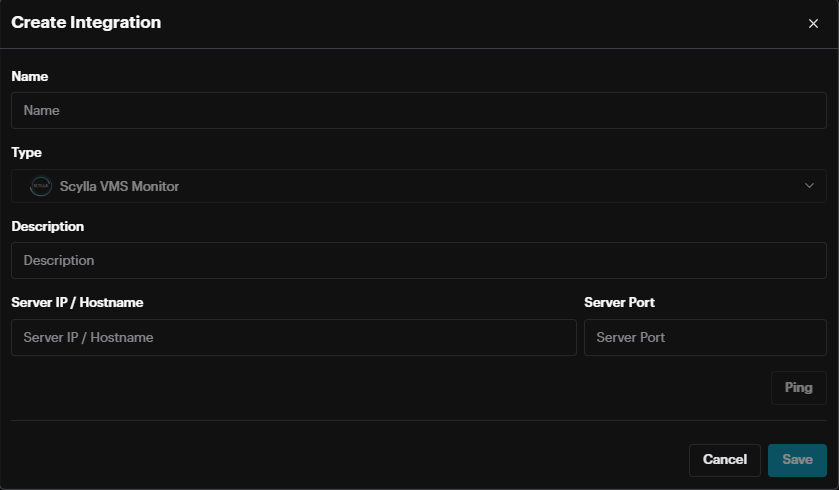
Name: Name of integration
Type: Predefined Scylla VMS Monitor
Description: Information about the integration
Server IP / Hostname: IP address or hostname where the ScyllaVMS client is installed
Server Port: HTTP API port defined in ScyllaVMS client application settings
Settings
The system Settings option is found directly below the Profile option in the main dropdown menu.
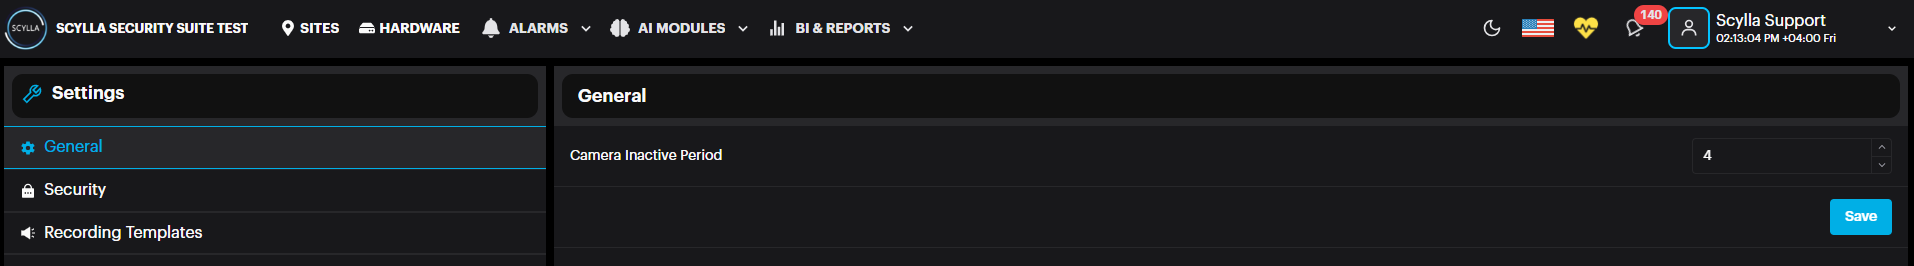
On the General page, the Camera Inactive Period setting (in days) allows the user to specify the number of days after which the camera status changes to inactive if no alarms are generated during this period. Default is 7 days.
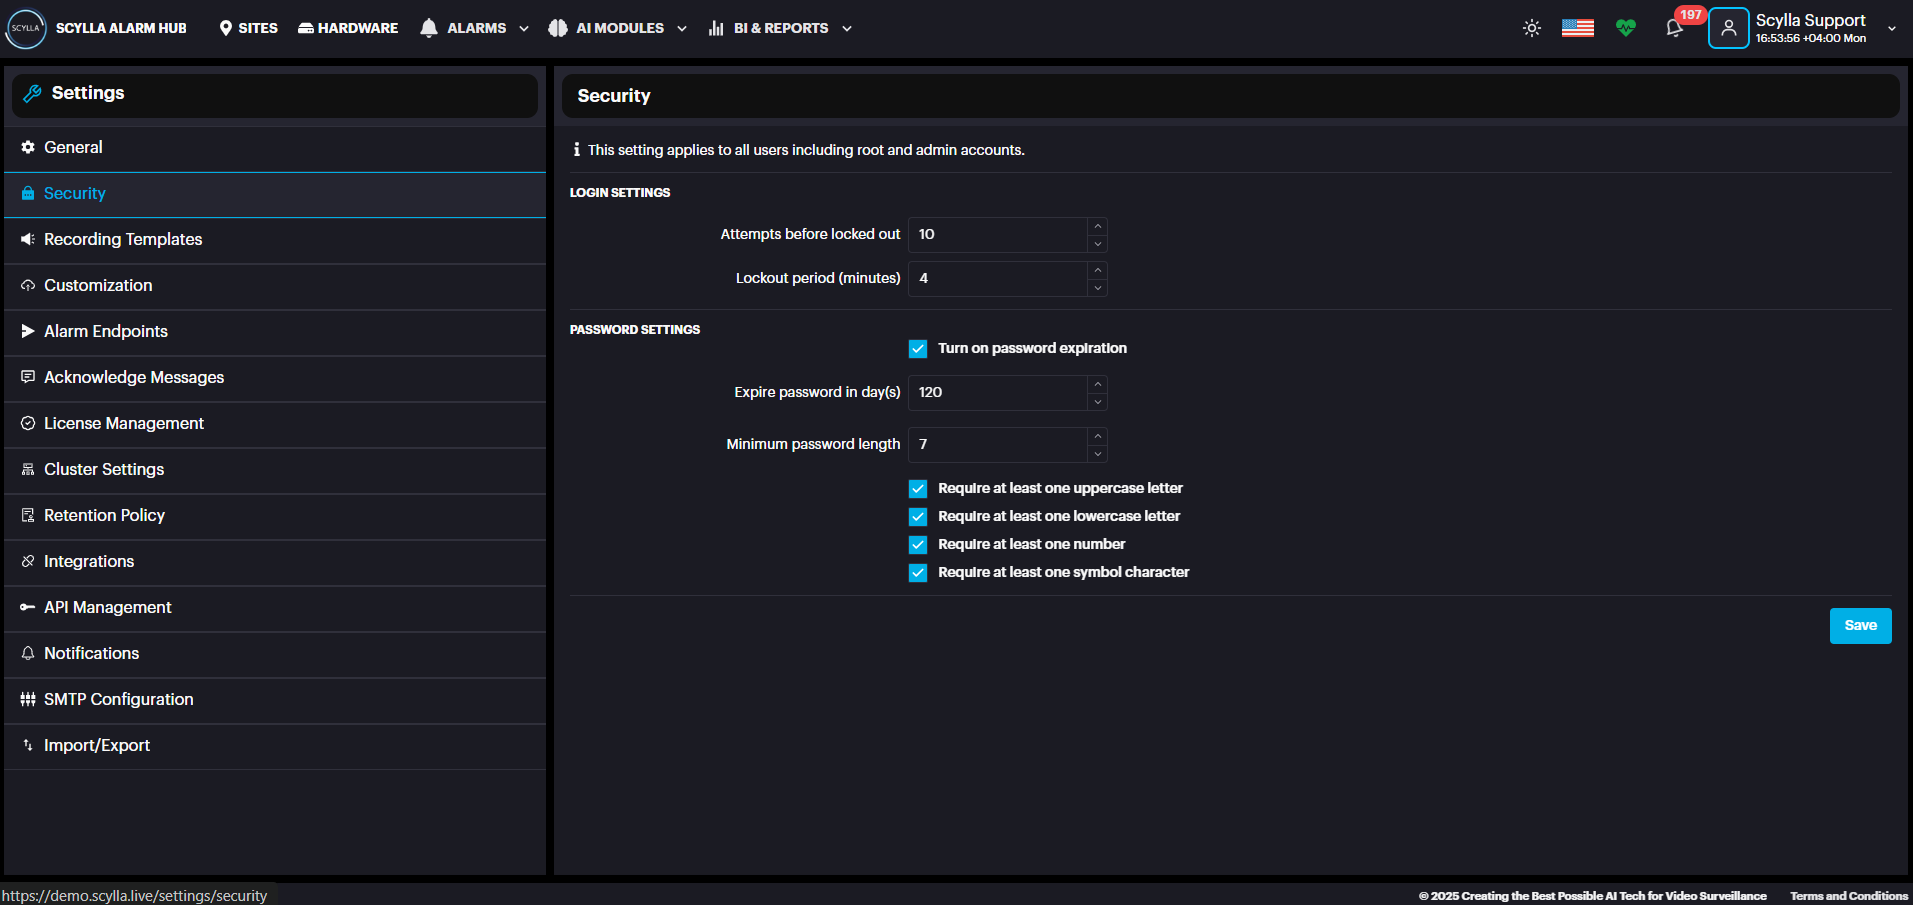
Security page defines Login settings such as Attempts before lockout & Lockout Period. Configure Password settings such as Minimum password length and complexity requirements.
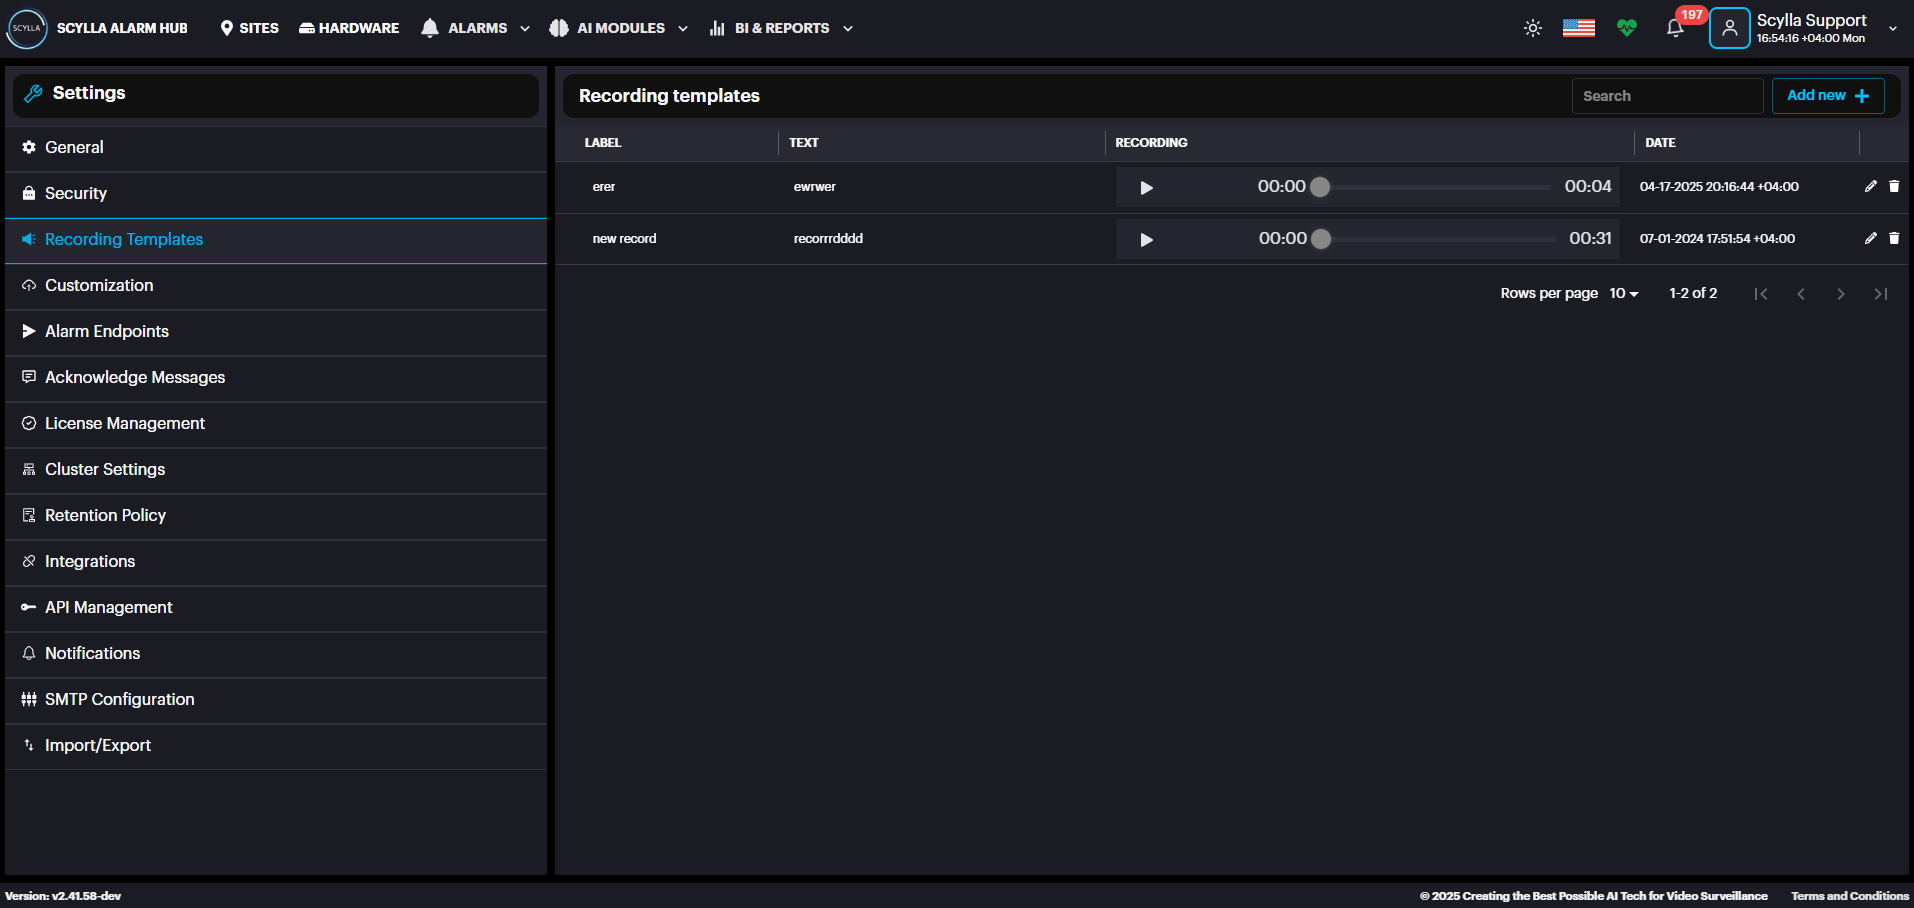
In the Recording Templates section, create recording templates by uploading Media (MP3, WAV, WAVE) or by recording from web browser using the Click to Speak. Click the Add New + button to begin. This will send the recording to the Asteria device, which will play the file through the attached speaker.
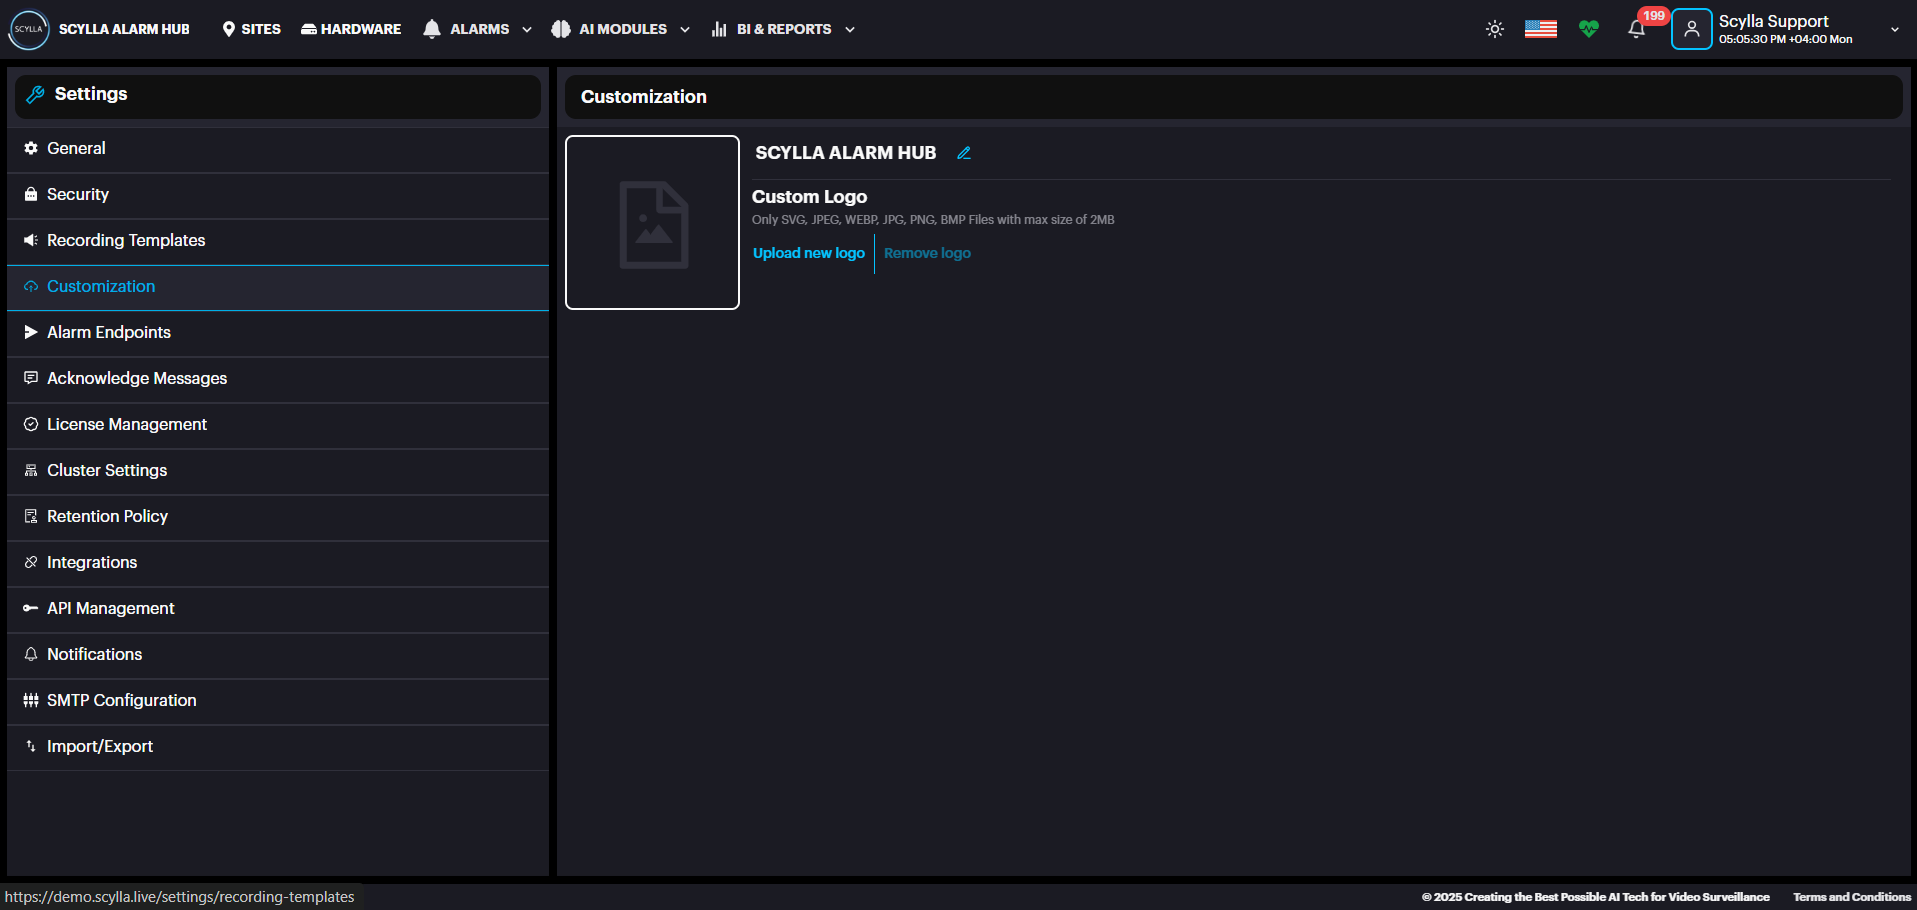
Customization: Upload your company logo (only JPEG, PNG, WEBP, BMP, SVG files with max size of 2MB).
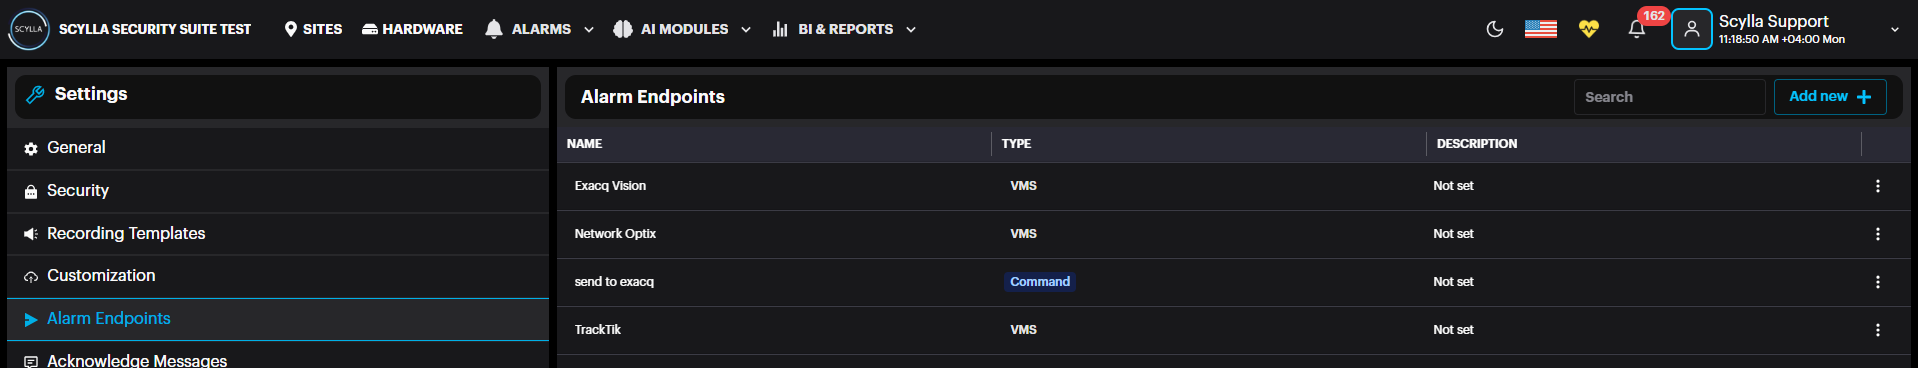
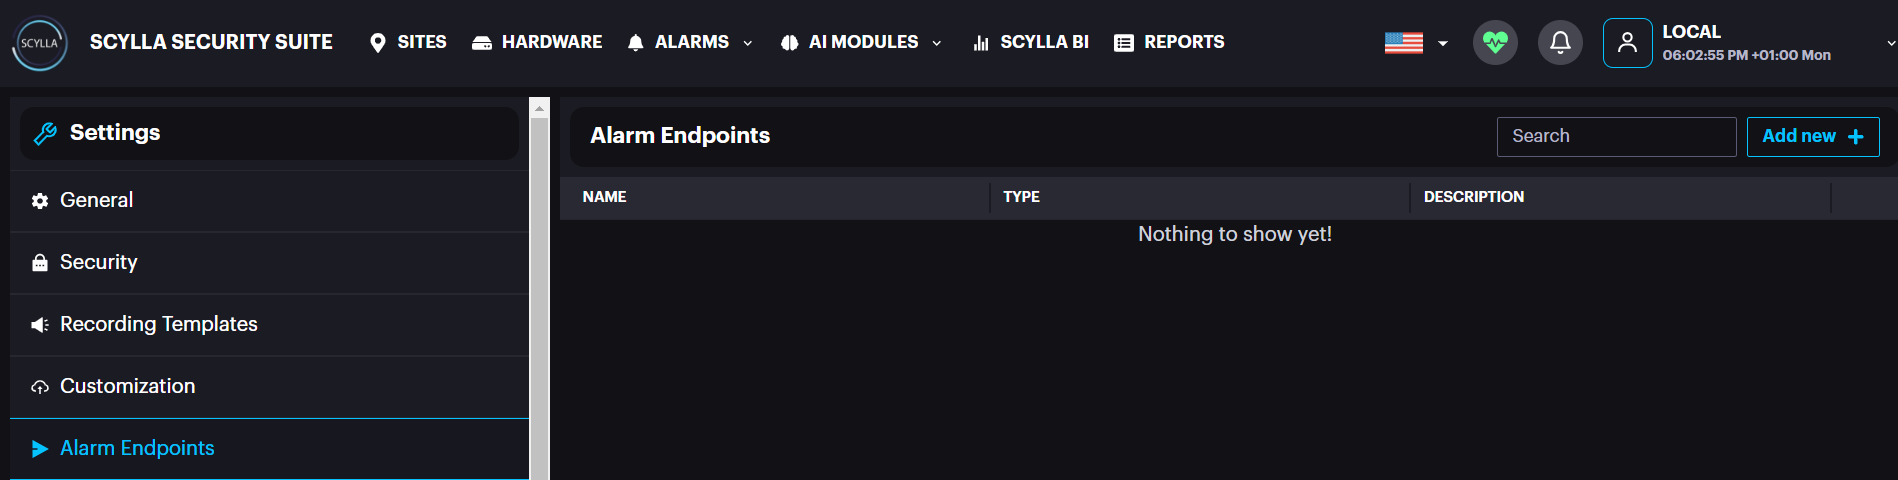
Alarm Endpoints: create the endpoints (Command – http/tcp/udp , HTTP, SMTP, Scylla Cloud) which will later be selected as Action in the Event Rules.
Sync with Scylla Cloud
To Generate Push token and Integration ID from cloud dashboard: Login to cloud dashboard. Go to Sites, choose/create a site, properties, manage devices
Then open the driver, Add Camera
Event Based
On-Premises System
Name the integration, click Create and continue Copy the integration details and paste it in alarm endpoints section on the local dashboard
Now copy the Integration ID and Push Token and paste it in the alarm endpoint Created on the On-Premise server. To do that Add New, Scylla Cloud Endpoint
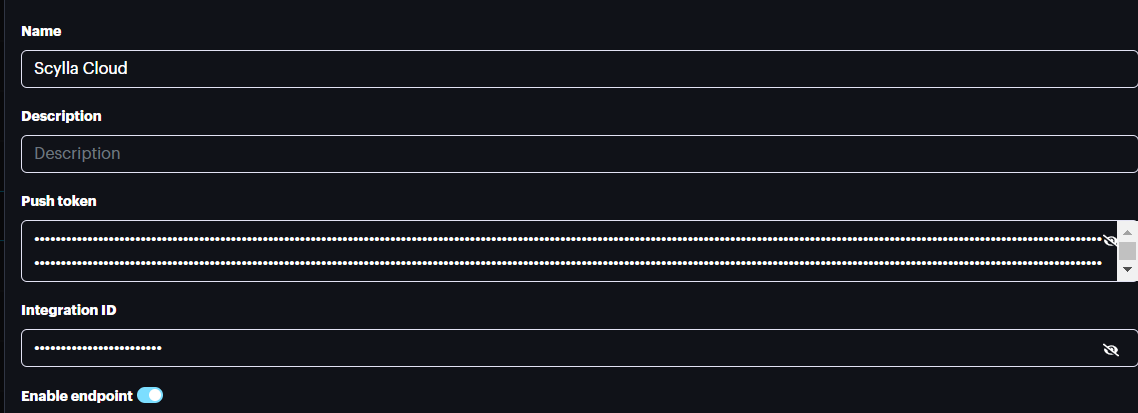
Paste the Push Token and Integration ID from the cloud Dashboard. Click Submit. To Activate the alarm endpoint, event rule must be created. Acknowledge Messages: View existing messages and create new ones by clicking the Add New + button. These are predefined acknowledgment messages, allowing users to select a message when acknowledging an alarm instead of manually typing one.
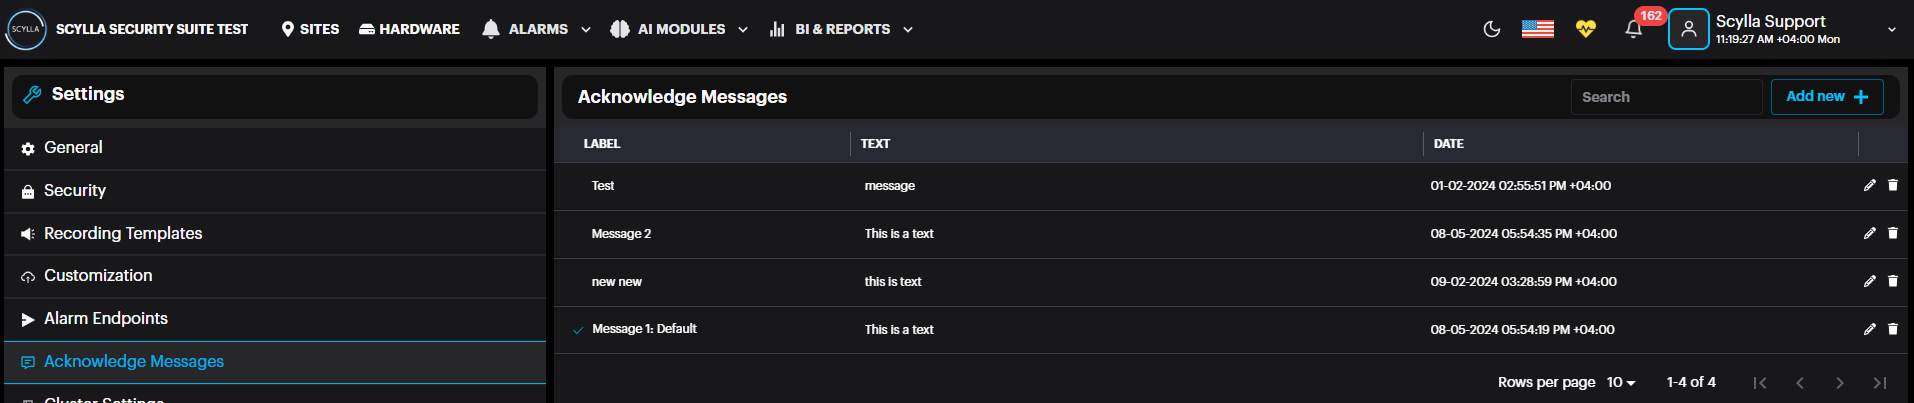
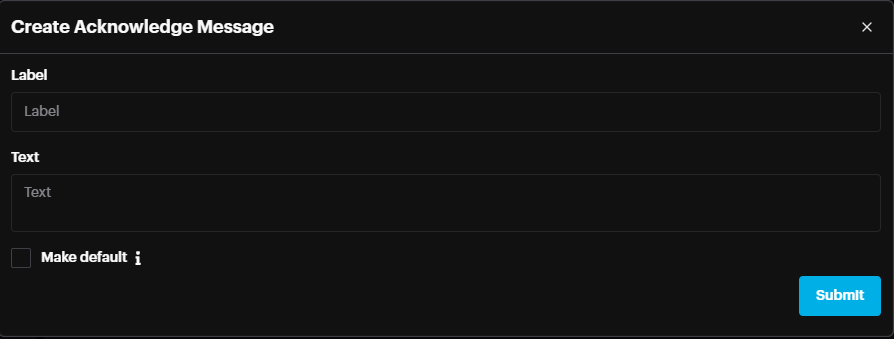
Add a label, text contents, and make the message your default if needed. Then click Submit.
License Management: Use this section to view, add, and manage the licenses for your AI modules.
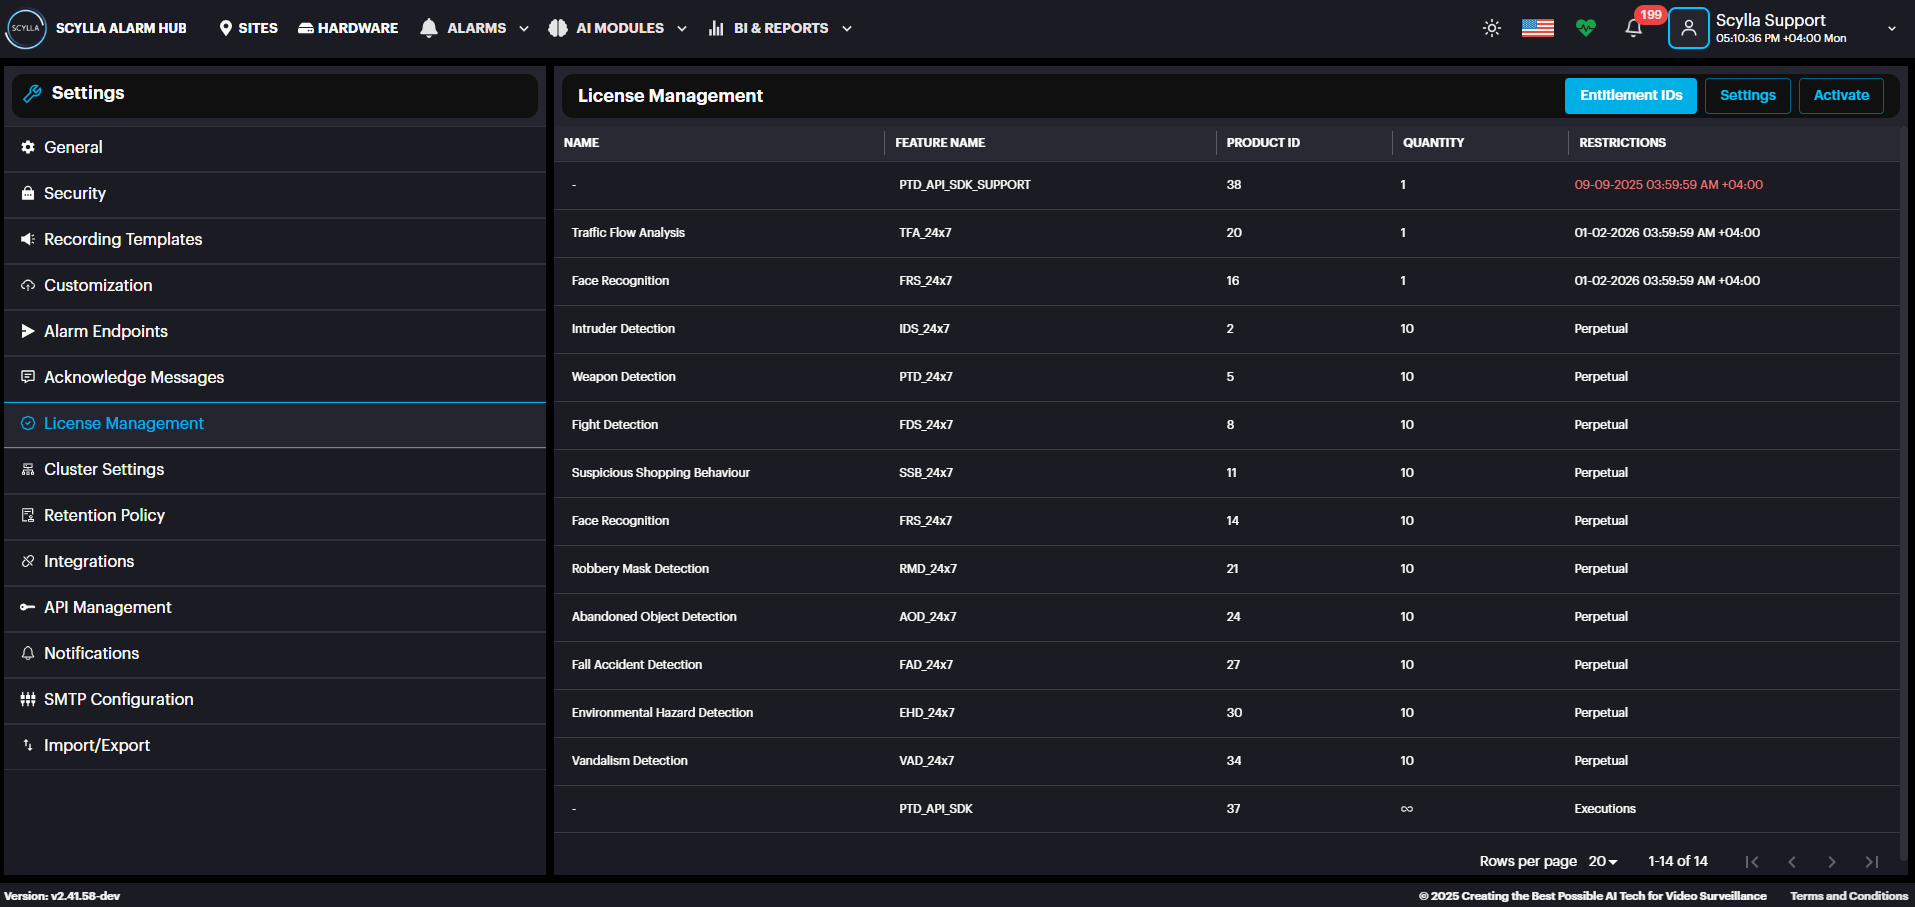
The list displays all existing licenses, detailing the following information for each:
- Module Name: The AI module the license applies to.
- Feature Name: The module name and type.
- Quantity: The number of supported channels (or concurrent connections).
- Restriction: Validity period of the license.
- Module Name: The AI module the license applies to.
- Feature Name: The module name and type.
- Quantity: The number of supported channels (or concurrent connections).
- Restriction: Validity period of the license.
First, you must enter the license server address by clicking the Settings. If you have any questions, please contact support@scylla.ai.
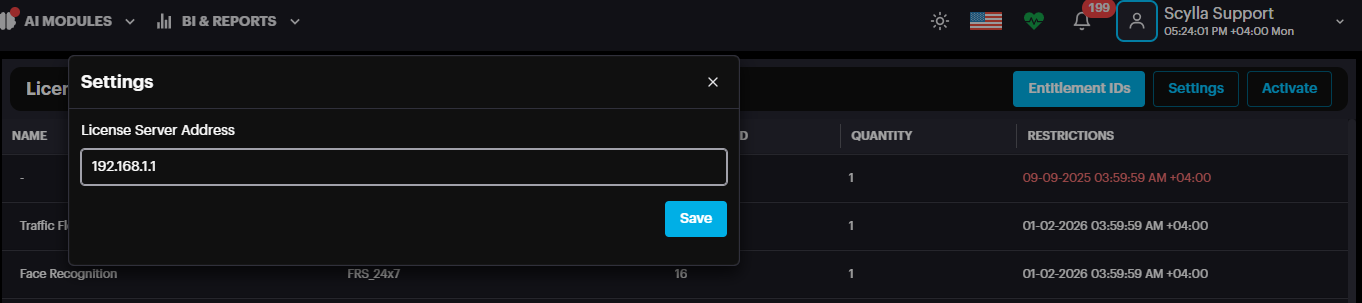
The AI Server address is typically used as the license server address. For larger enterprise installations using master/worker nodes, the license server address is the master node's address. Once the server address is entered, the next step is to activate the license. Click the Activate button to open a window presenting two options: Activate Offline and Activate Online.
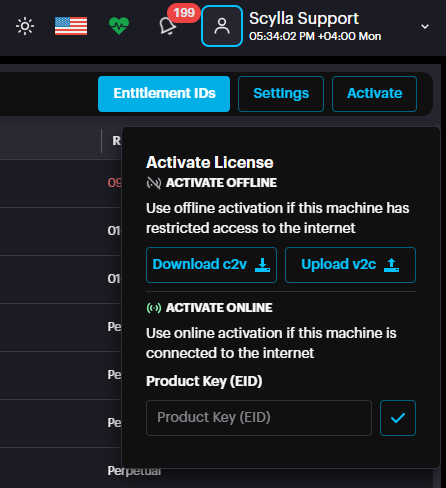
Online Activation
To activate the license online, confirm that the server is connected to the internet. The entire process requires only the Product Key (EID), which you should have received in a separate email.

Copy the EID from the email and paste it into the Product Key (EID) field under Activate Online and press the Apply button.

After the license is successfully activated, a confirmation message will appear.

Once the license is successfully activated, the license details will appear in the list below, displaying the AI module, quantity (number of cameras), and restrictions (such as an expiration date or if it is perpetual).
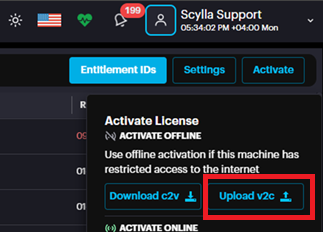
Offline Activation
If there is no internet access, the license can be activated offline. First, download the C2V file from the activation window.
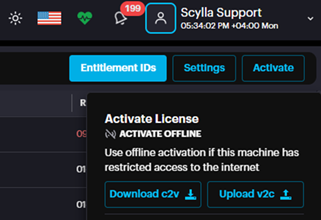
This action will download the C2V file to your device.
In the initial License email, you will find a link to access the Entitlement Management System.

On another device with internet access, open the link from the email to access the Entitlement Management System (EMS).
Link : https://scyllaspzoo.prod.sentinelcloud.com/customer

On the EMS login page, click on the EID tab and enter the EID provided in the email and click Login.
After logging in successfully, the Entitlement page will be displayed. Click the "Activate Offline" button.

Next, click the "Select File" button to upload the C2V file that was downloaded from the Asteria device.

After successfully uploading the file, click the "Complete Activation" button.

The user has two options to download the V2C file:
- Click the "Download License" button at the bottom.
- Download it from the email received after activation. Click the "Download License" button at the bottom.
Download it from the email received after activation.

After downloading the V2C file, transfer it to the Server and upload it from the activation window.
Note: An orange banner will appear on the dashboard 14 days prior to the license expiration date to notify the client. If the user closes the banner, it will not reappear; otherwise, it will remain visible.
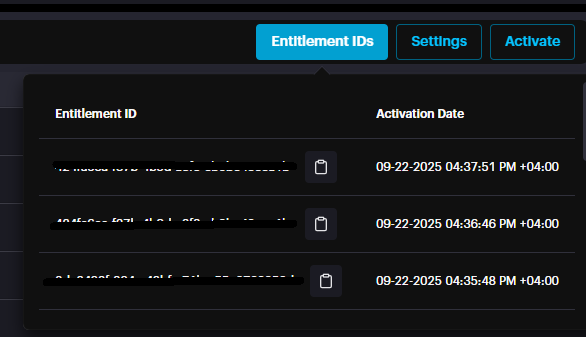
The user can navigate to the License Management page to activate the renewal license or contact support@scylla.ai for assistance. Clicking the Entitlement IDs button opens a window that lists all the EIDs (Product Keys) used to activate the licenses currently in your system.
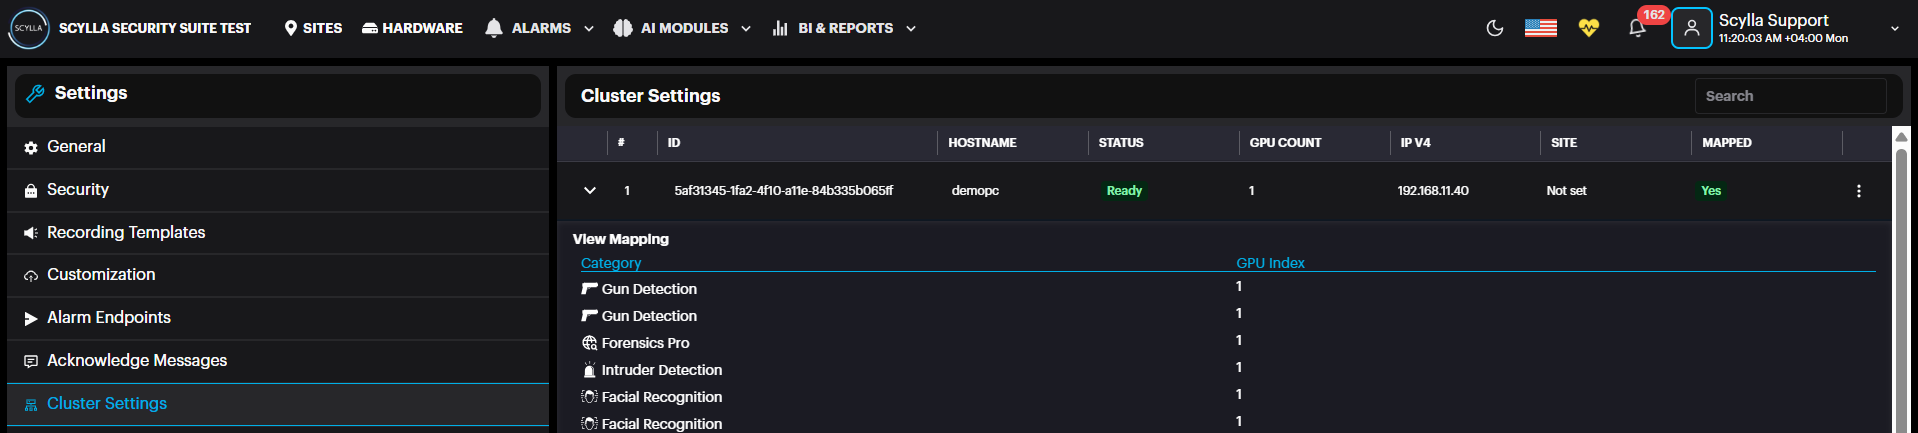
Cluster Settings: View the hardware details if each hardware cluster. Click on the cluster to expand the mappings window, where the GPU index for each module is displayed.
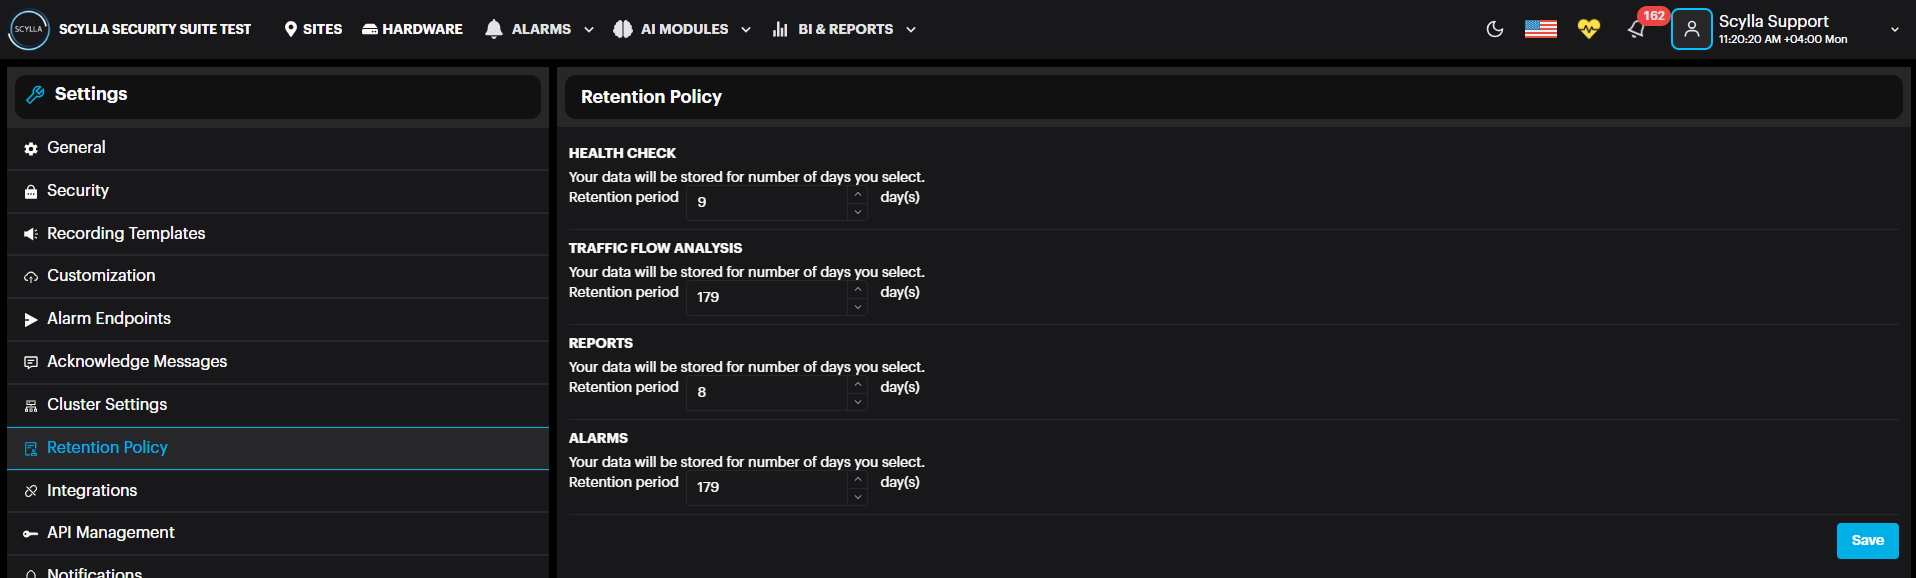
Retention Policy: Define the number of days your data will be stored.
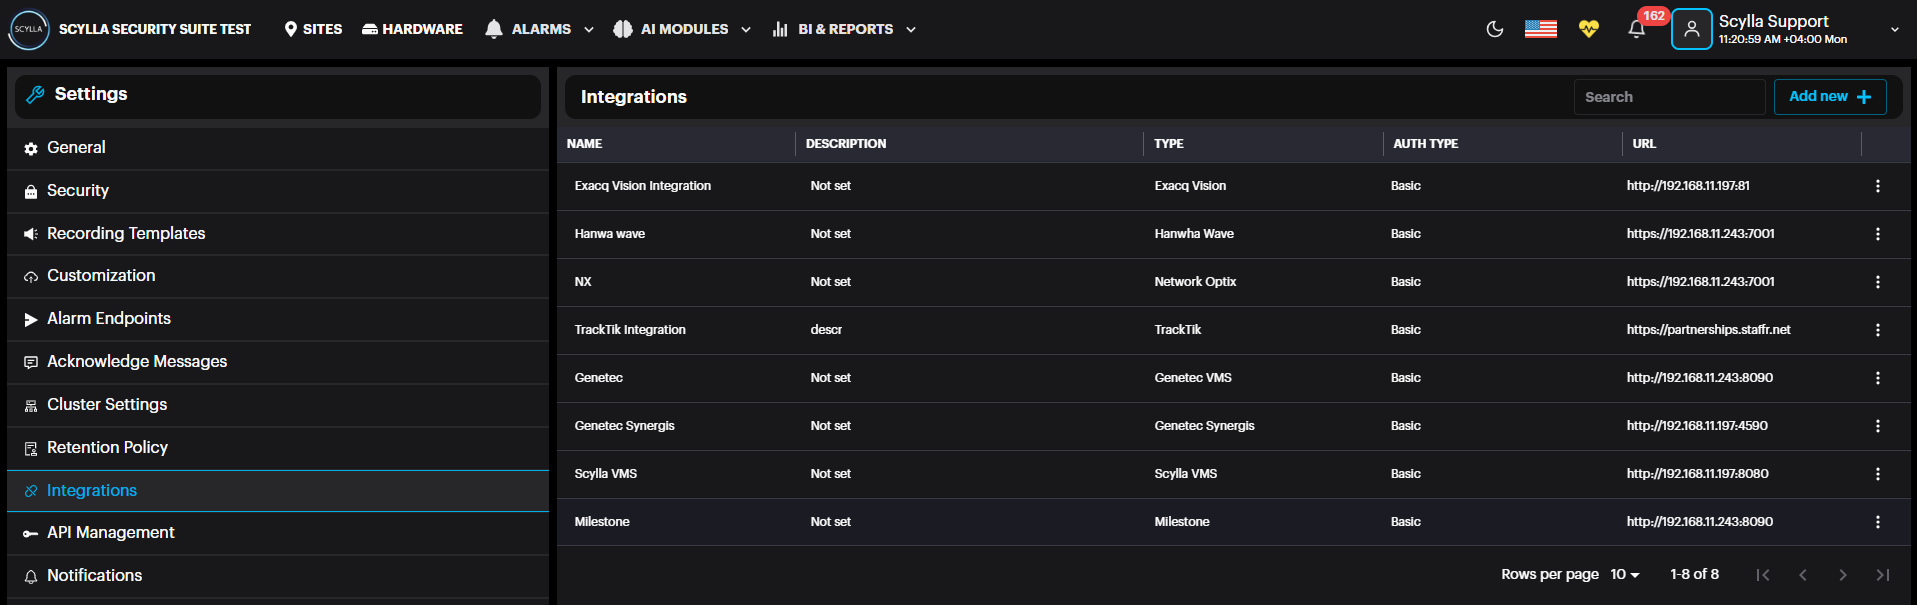
Integrations: add an integration with Genetec, Milestone, Network Optix, Sylla VMS and other platforms by clicking Add new + button and filling in the required info. Check the manual for each type of integration.
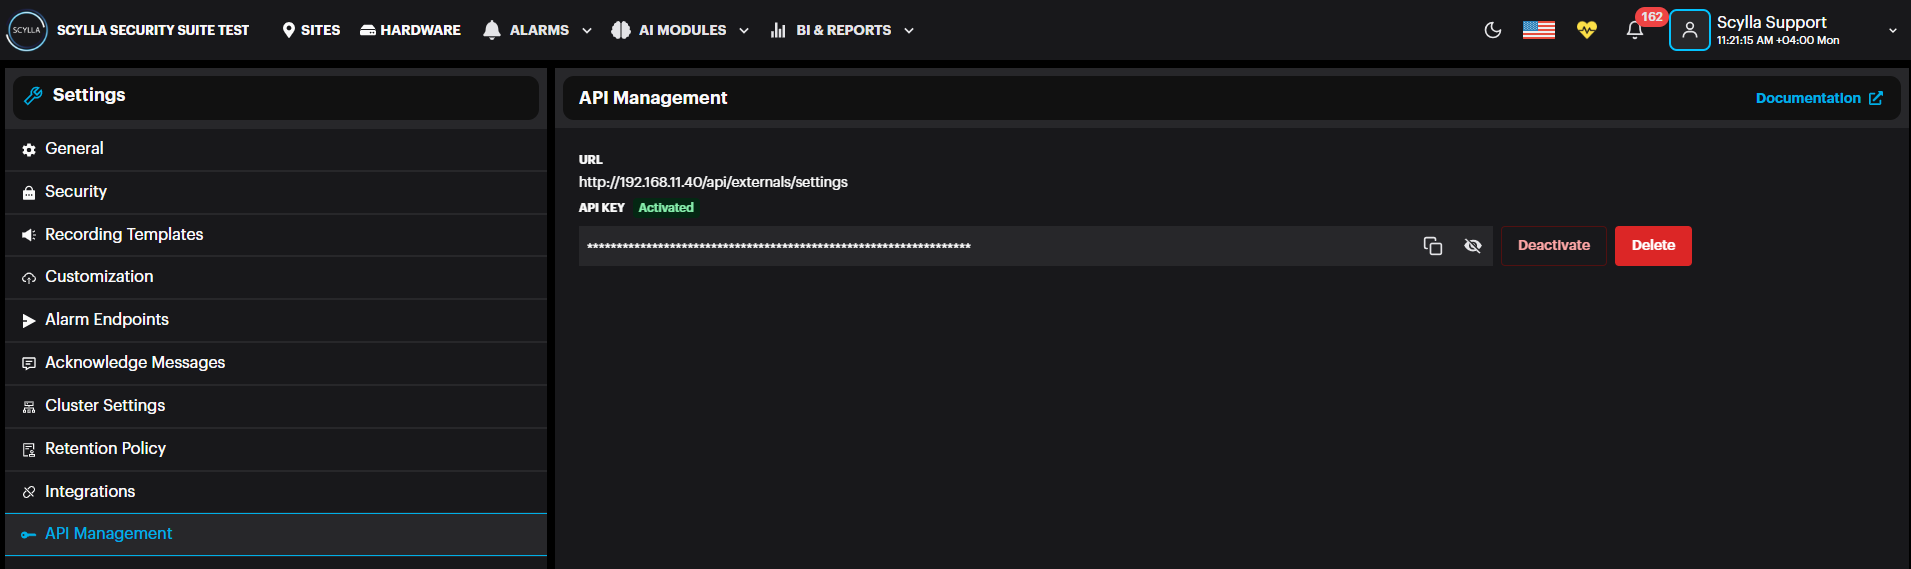
API Management includes documentation for APIs that are available for integration purposes.
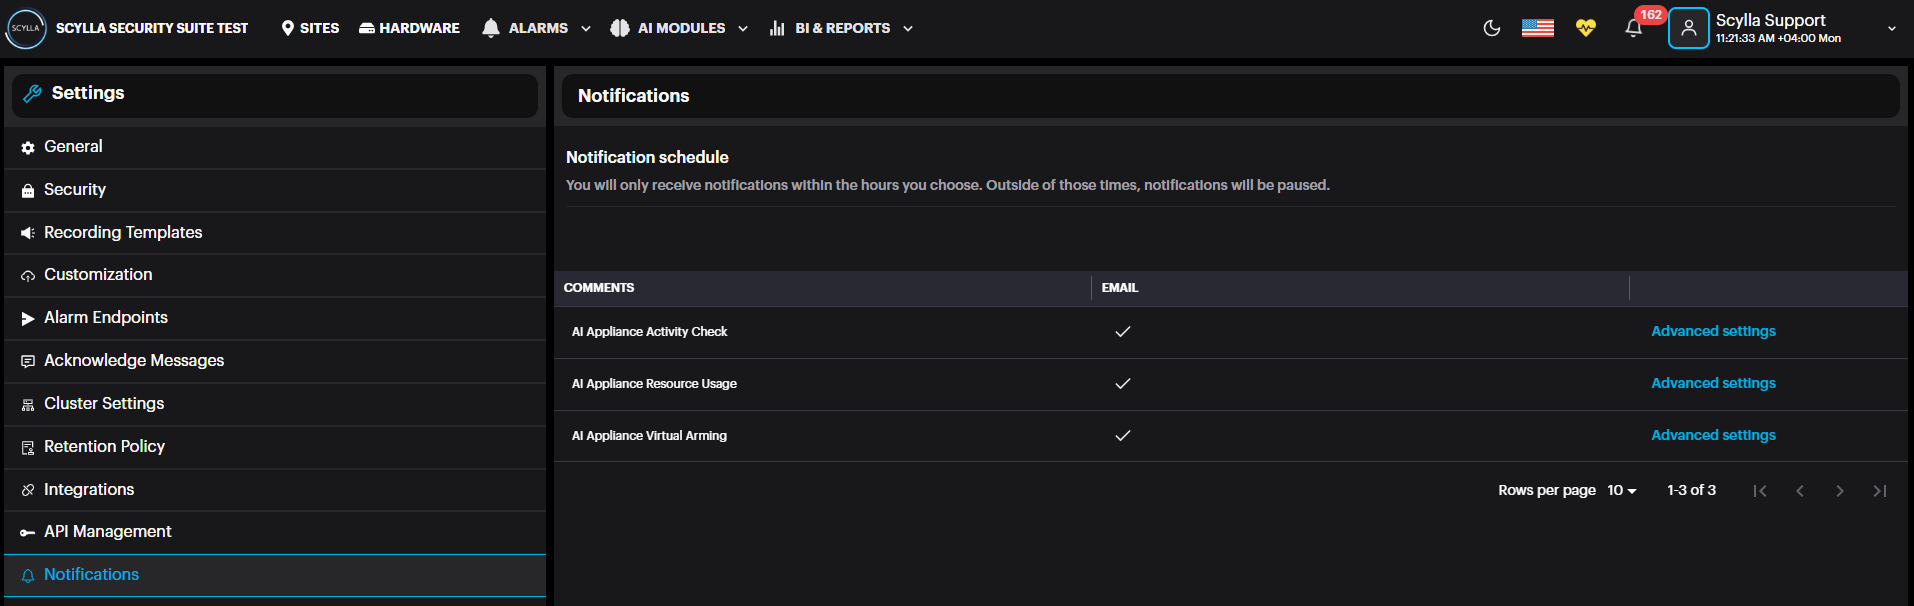
Notifications includes three types of notifications that can be configured and enabled to send an email when a specified condition is exceeded.
AI Appliance Activity check to check when the Asteria box connected to the on-prem is offline , AI Appliance Resource Usage when Asteria box resource usage exceeds the threshold & AI appliance Virtual Arming when it is enabled on Asteria box.
![]()
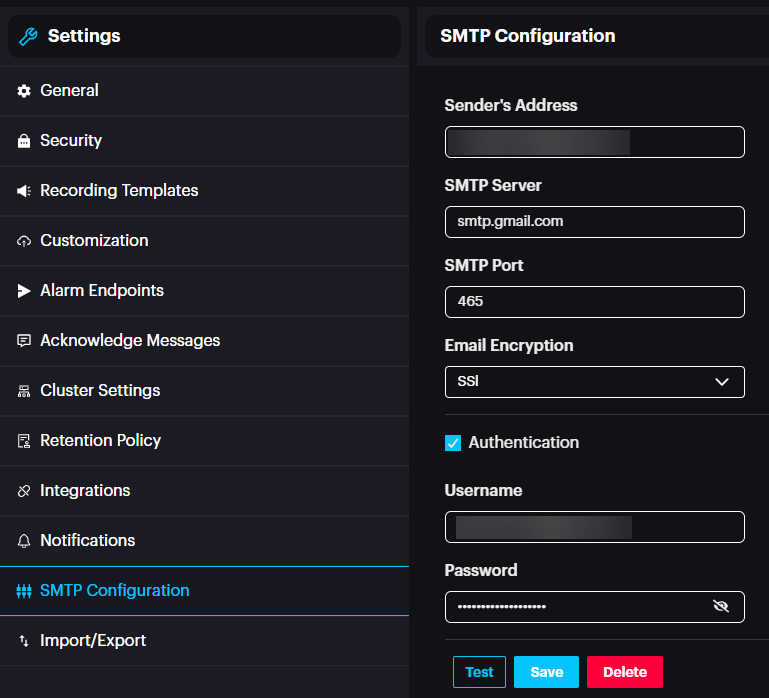
SMTP Configuration: Configure SMTP server sender settings. This is used if Scylla Asteria is connected to On-premise server & Virtual arming is enabled on Asteria box. e.g The typical monitoring period is from 6 PM to 6 AM, during which on-premise personnel actively monitor the dashboard for alarms.
However, in cases where customers arm the system before 6 PM, they may require alarm notifications via email or a local SMTP server. These notifications should remain active until 6 PM, after which regular monitoring resumes.
To enable this, the input port must be configured to be armed virtually on Asteria box. Once armed, this status is transmitted to the on-premise dashboard, allowing alarms to be routed through the SMTP server to the designated recipients. This functionality should only operate within the defined schedule.
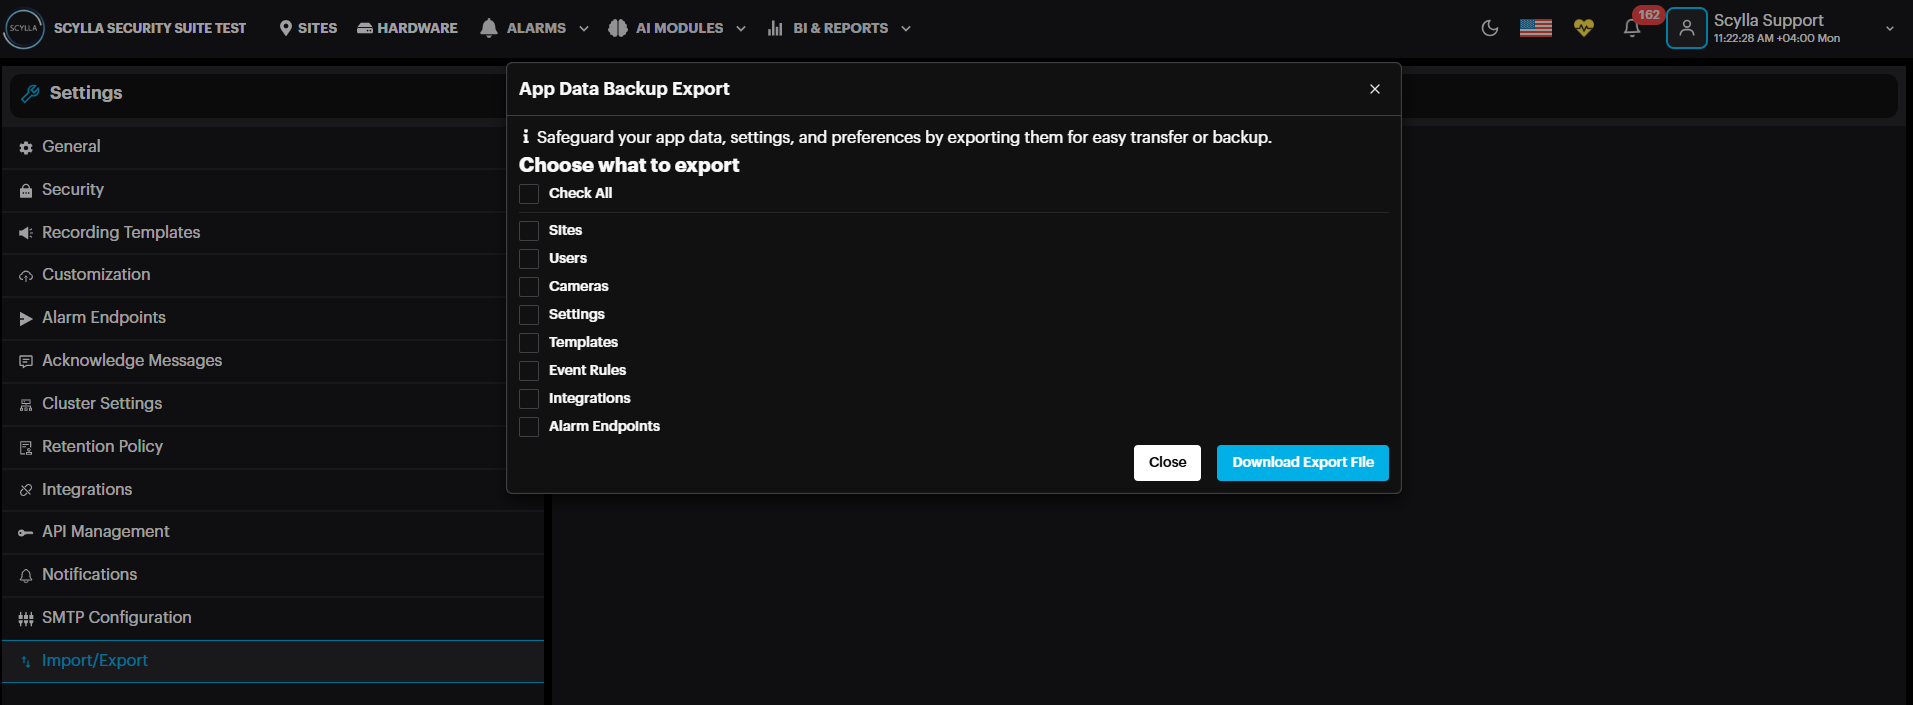
Import/Export: Import or export your app data, settings, and preferences. To back up your data to a zipped file on the local computer, click Export.
In the Data Export window, select which setting to back up, or Check All, the click Download Export File.
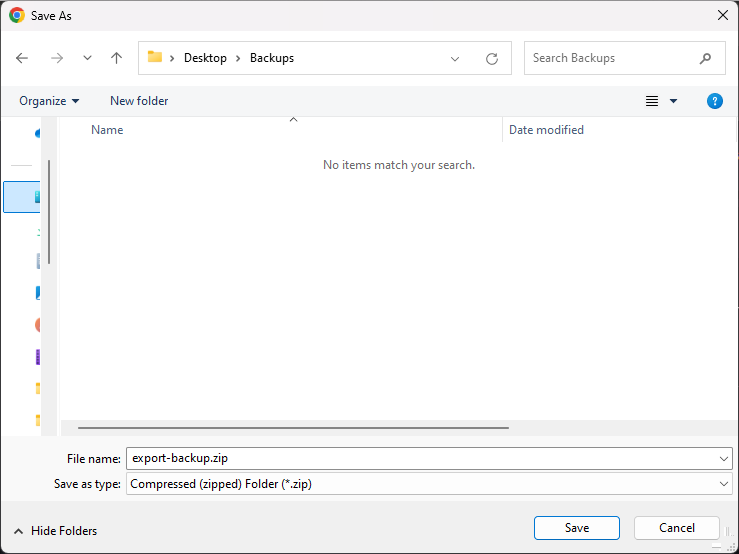
There will be a windows dialogue to select the target folder and filename for the export. Do so and click Save. This will download the zip file to the specified target path.
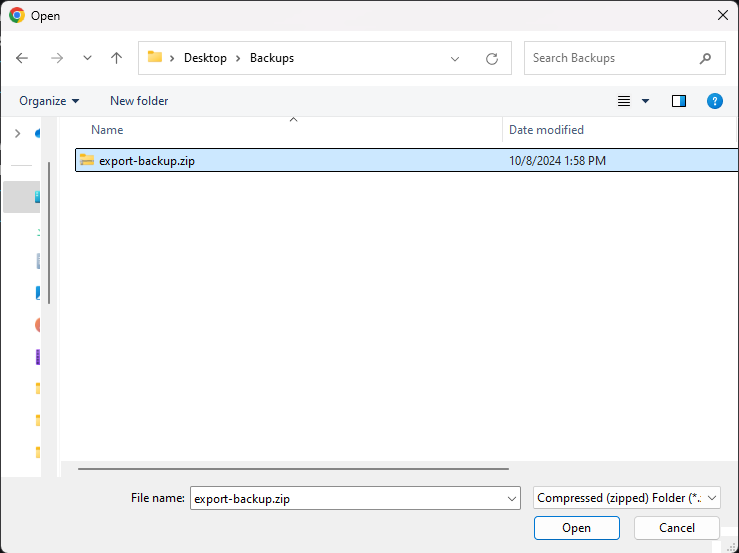
To import a previous backup, click Import. Select a backup zip file and click Open in the dialogue.
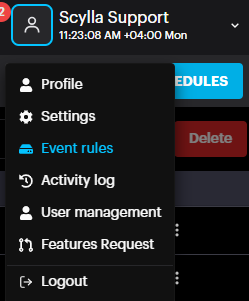
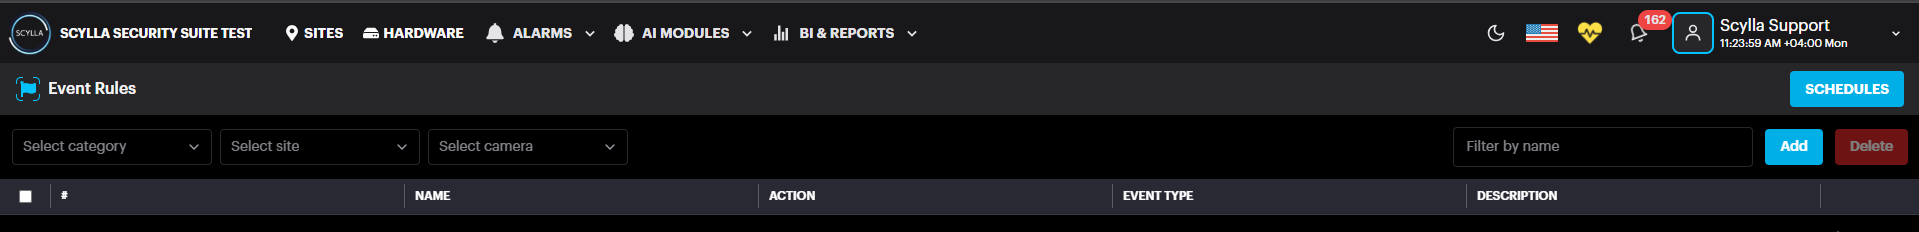
Event Rules
To access, click on your username and select Event Rules from the dropdown, below Settings.
On the Event Rules page, create schedules, as well as event rules.
Click the Add button.
Click create schedule.
Name the schedule, select the days when this schedule will be active and select the time on the right by disabling the “24-hours Tracking” toggle and creating customized time by clicking + button. The example below is from 16:00 till 8:30am.
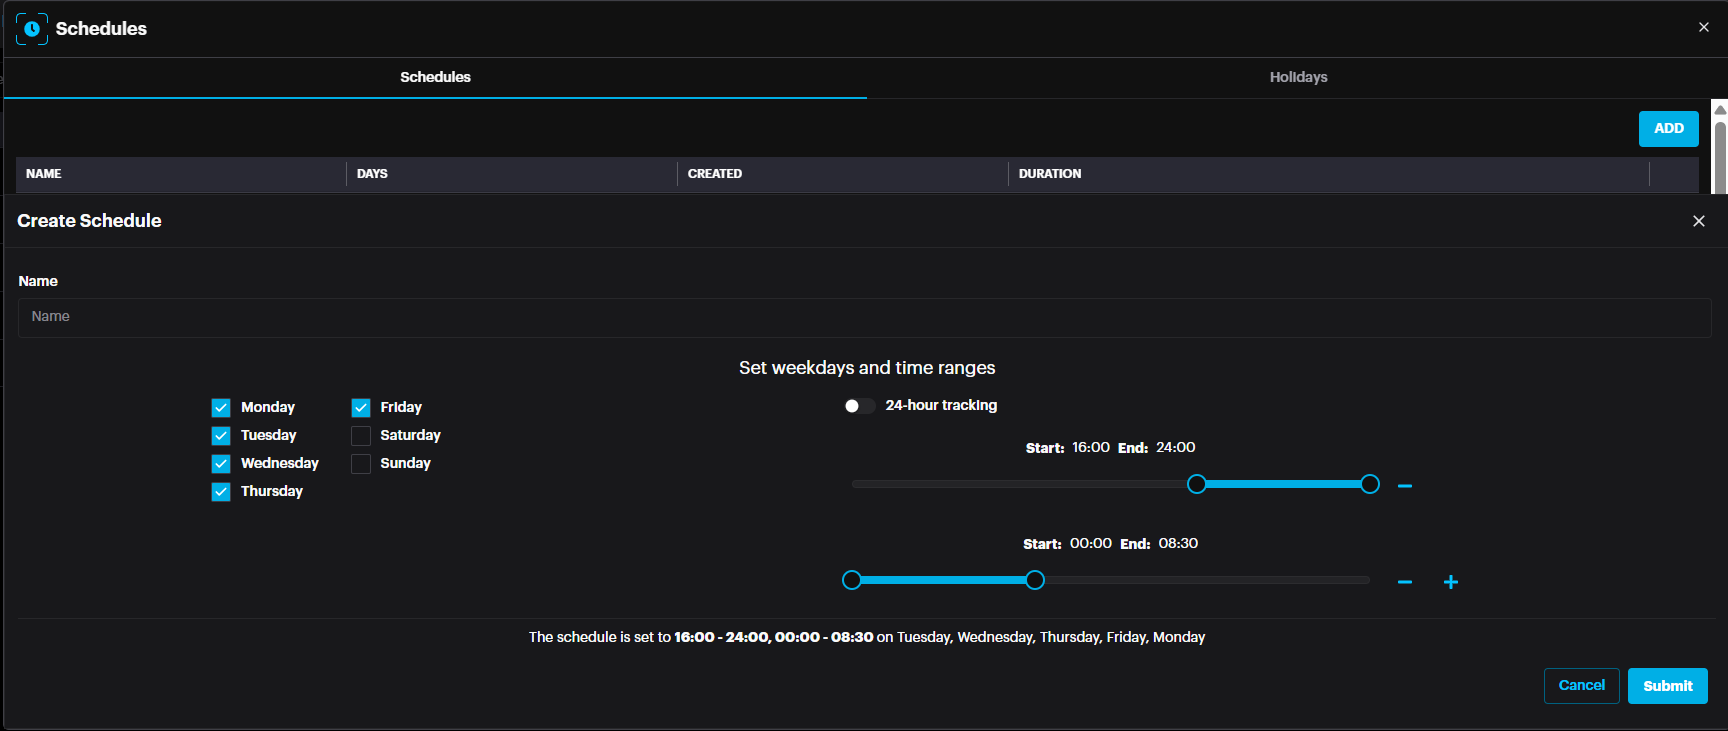
Click Submit.
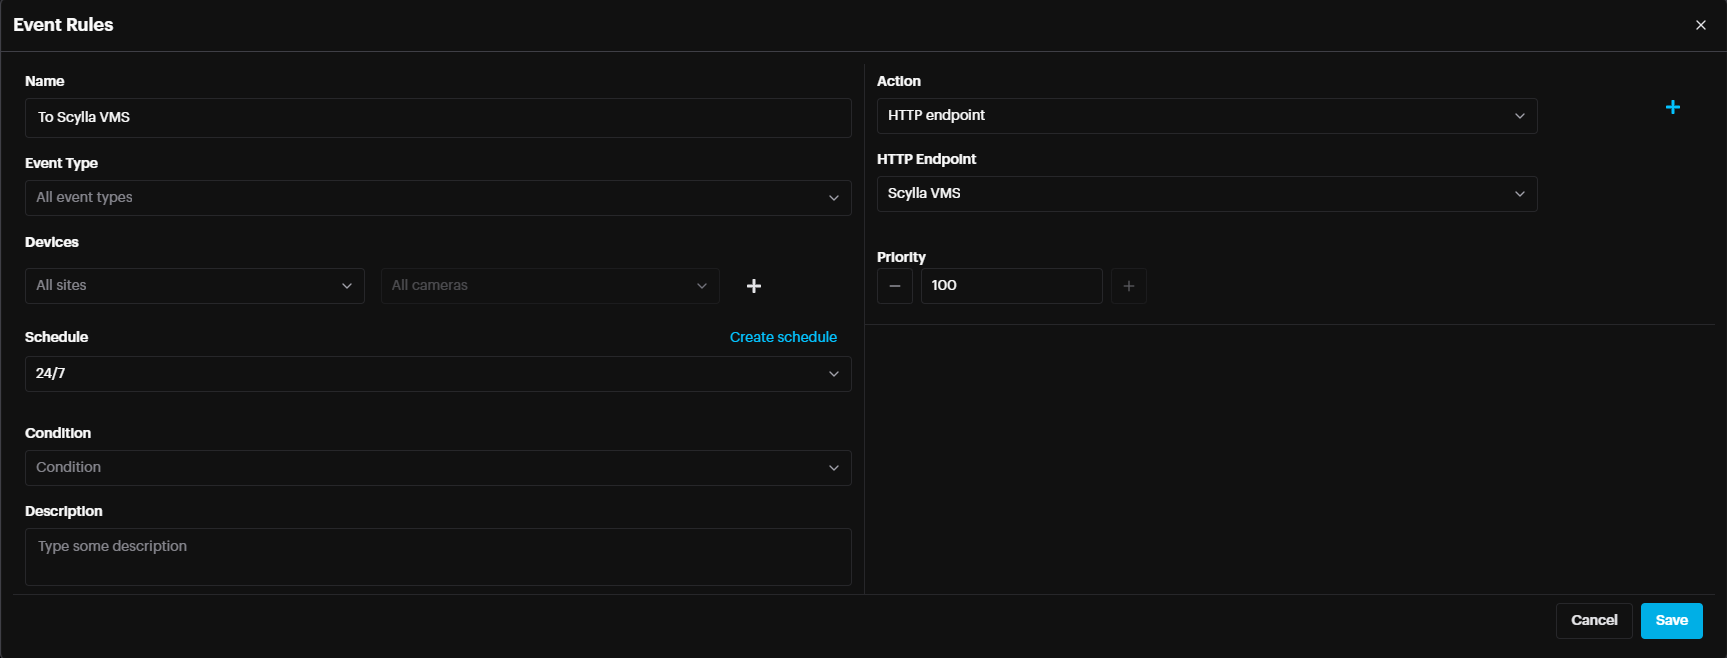
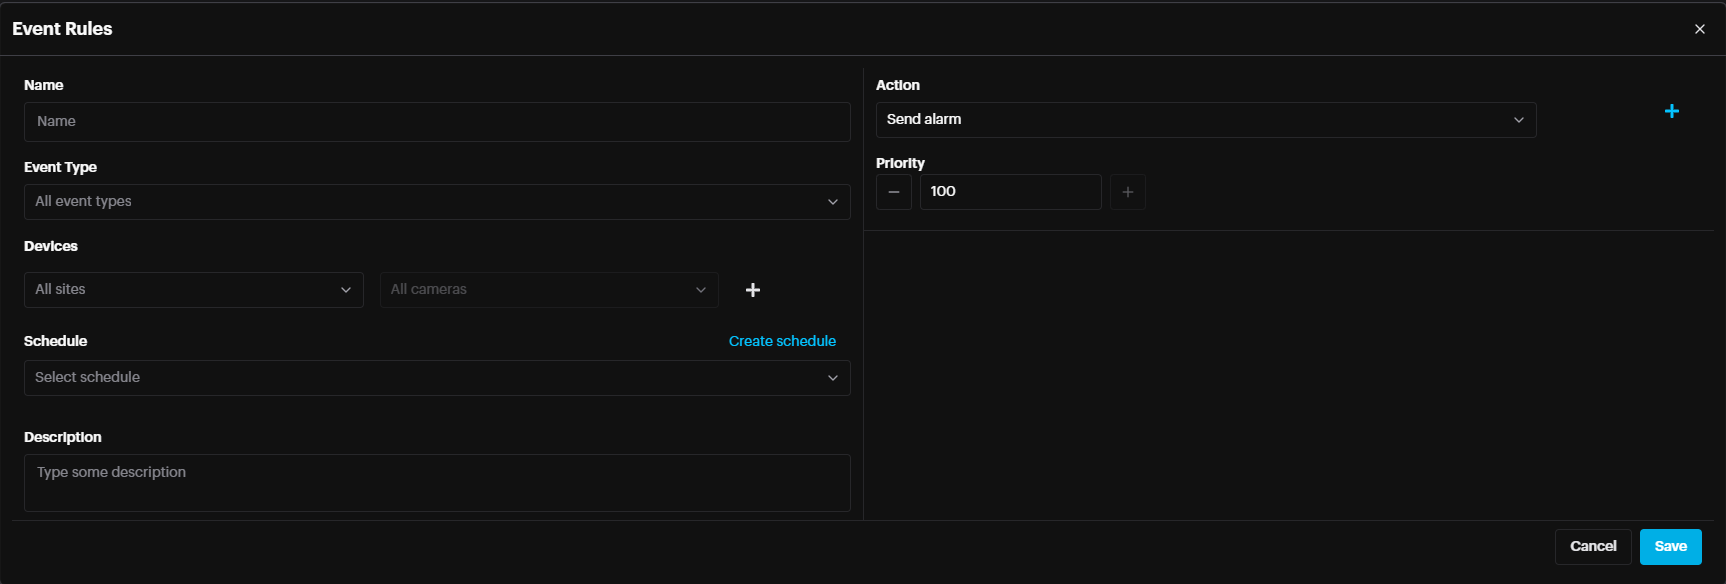
Name the event rule, select the event type (AI module that will trigger this event rule), select the site and cameras that will follow the schedule (if not selected, all sites and All cameras are considered). Note: Be sure to select the Schedule which was created in the previous step, from the dropdown.
In the Action field, select
- Send Alarm – sends alarm to your dashboard
- Send Command – send TCP/UDP/http command (first need to create Command endpoint in the Alarm endpoints page)
- HTTP endpoint – send alarm to Scylla Cloud, VMS, HTTP … (first need to create HTTP endpoint/Scylla Cloud Endpoint in the Alarm endpoints section in settings page)
- Send SMTP – Send email (first need to create SMTP endpoint in the Alarm endpoints section in settings page Send Alarm – sends alarm to your dashboard
Send Command – send TCP/UDP/http command (first need to create Command endpoint in the Alarm endpoints page)
HTTP endpoint – send alarm to Scylla Cloud, VMS, HTTP … (first need to create HTTP endpoint/Scylla Cloud Endpoint in the Alarm endpoints section in settings page)
Send SMTP – Send email (first need to create SMTP endpoint in the Alarm endpoints section in settings page
Alarm Conditions for External Endpoints
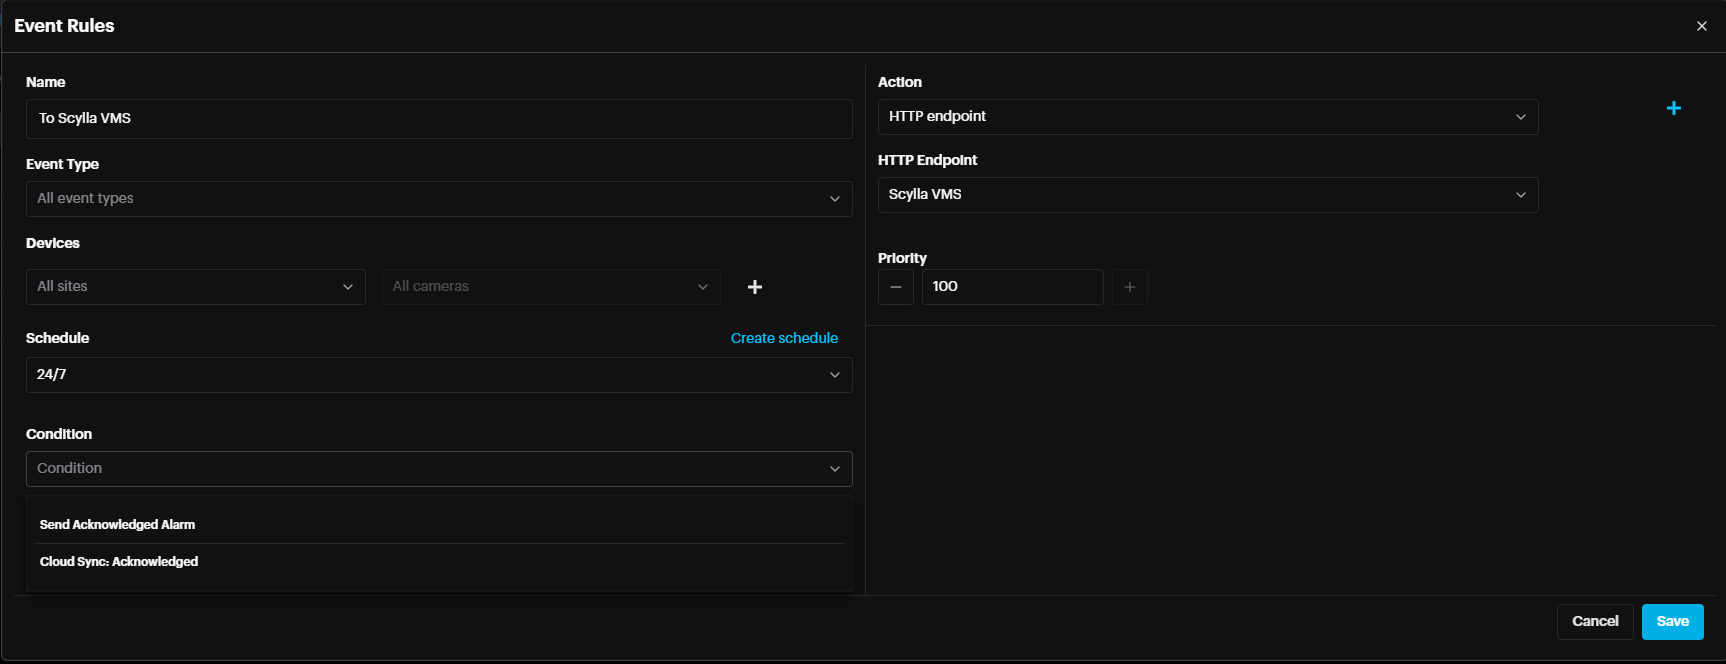
It is possible to define a condition for the alarms that should be sent to external endpoints. Send Acknowledge Alarm – Only alarms that have been acknowledged will be sent to the external endpoint. Send Synced Alarm – Only alarms that have been acknowledged on Cloud account and synced to On-prem system will be sent to the external endpoint.
Multiple External endpoints per camera zone for IDS If a camera has several active areas/zones/polygons , it is possible to trigger multiple external endpoints per camera area/zones/polygon.
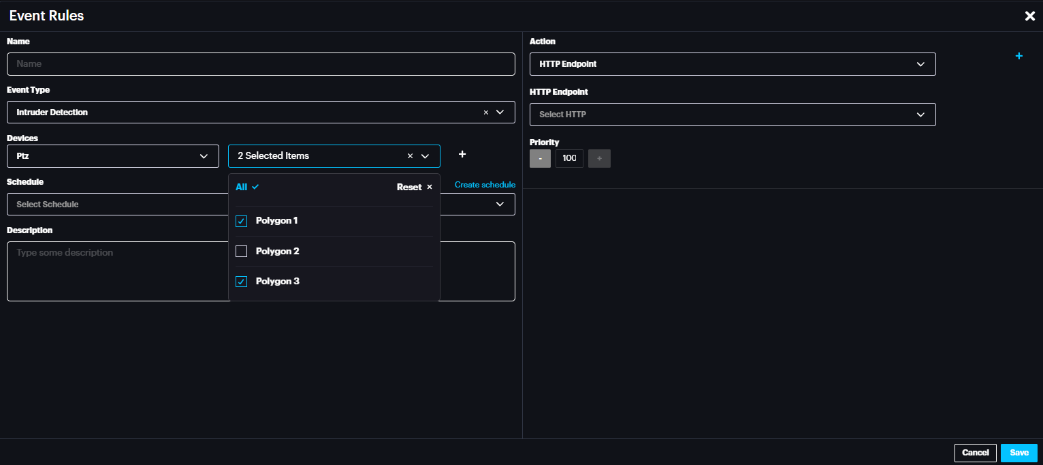
To trigger different endpoint per area/zone/polygon , select the camera under Devices and select the required area/zone/polygon under the Areas . Then , in the action tab select the required action to external endpoint.
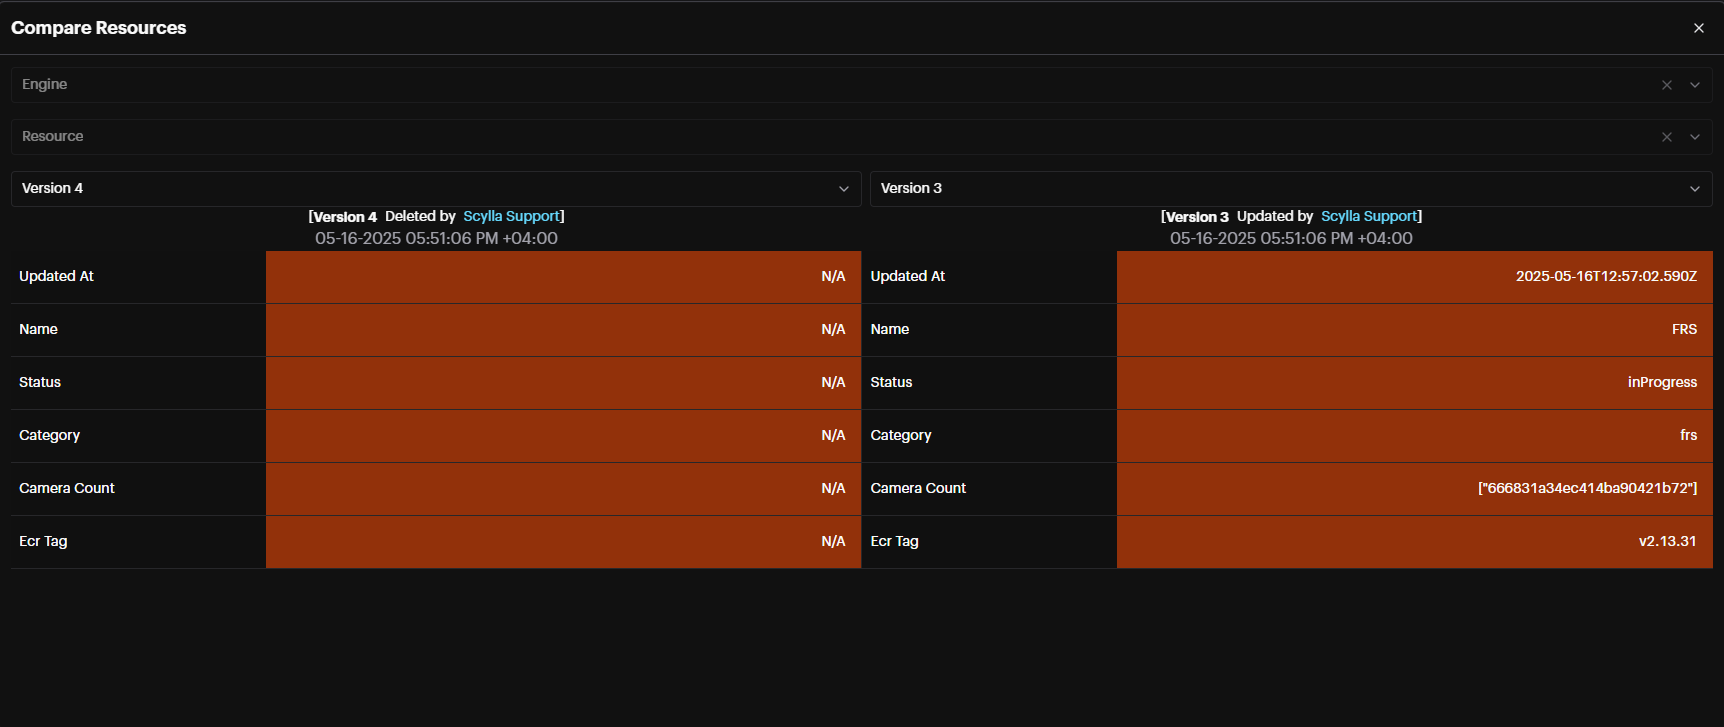
Activity Log:
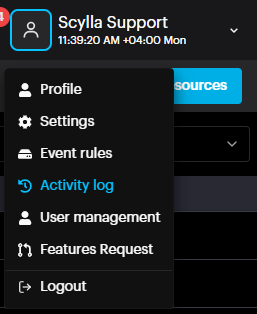
Follow up for the latest actions (create, update, delete) on the dashboard made by Users.
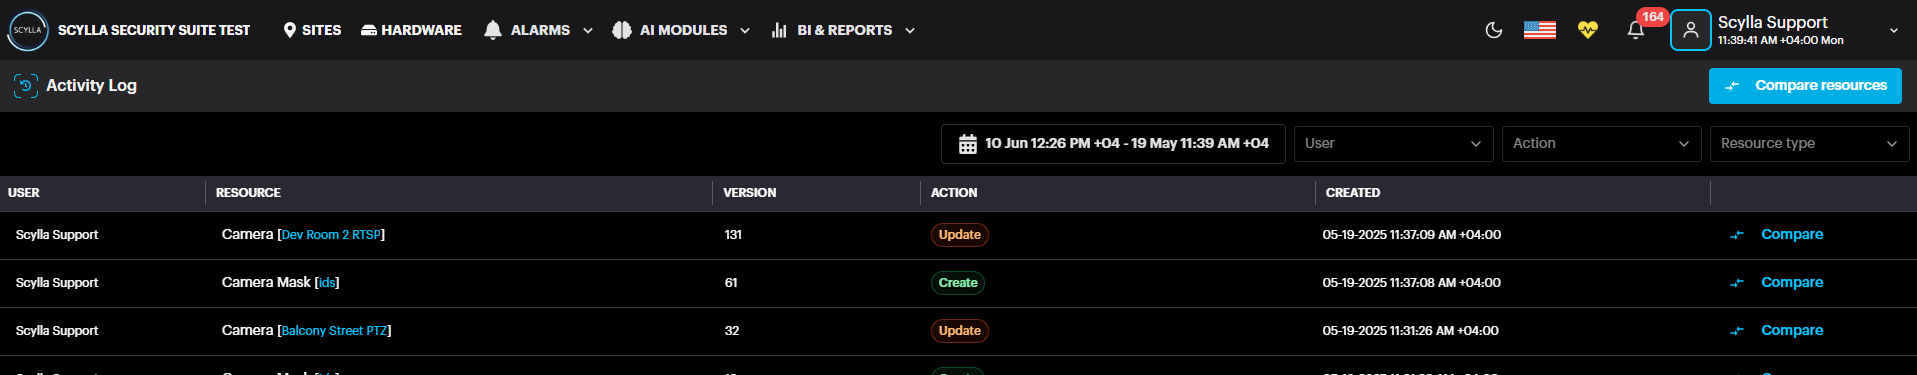
Perform a version comparison for each action by clicking the Compare button, and selecting the versions in the following window.
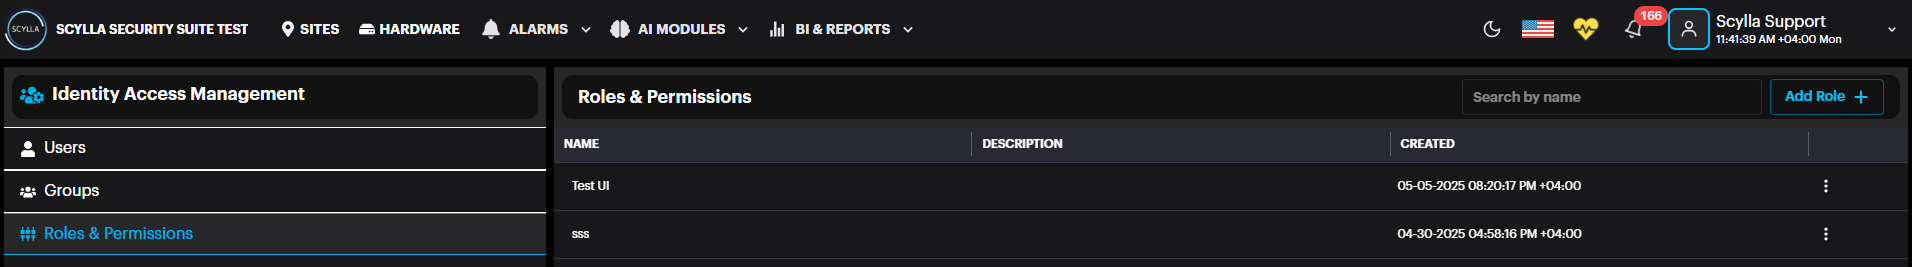
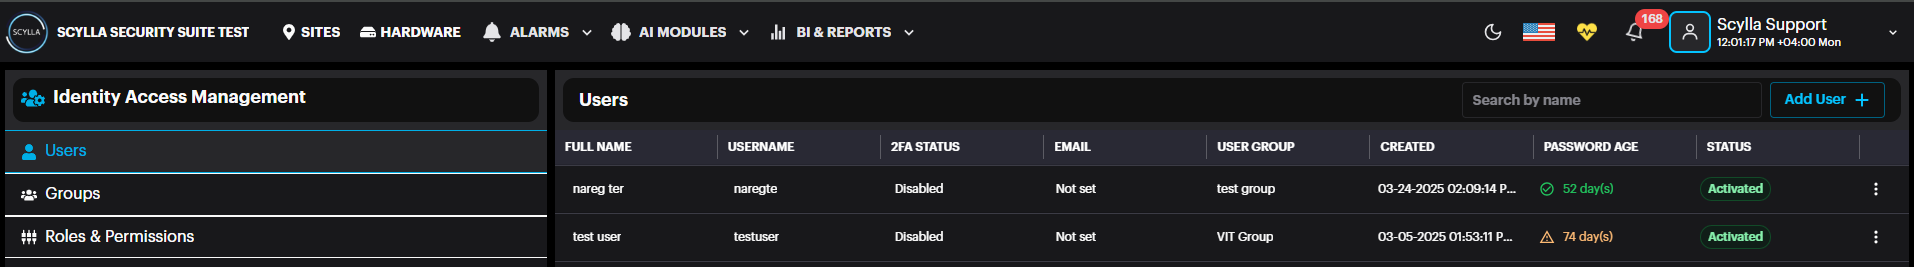
User Management
To create dashboard users and user groups with their specific roles, click on account menu and select User Management from the dropdown menu. This opens the Identity Access Management page. There are three sections, User, Groups, and Roles & Permissions. For new setups, it is recommended to begin with creating Roles & Permissions.
Roles & Permissions
Create a role by selecting Roles & Permissions from the left menu then click Add Role +
The Add Role window will appear.
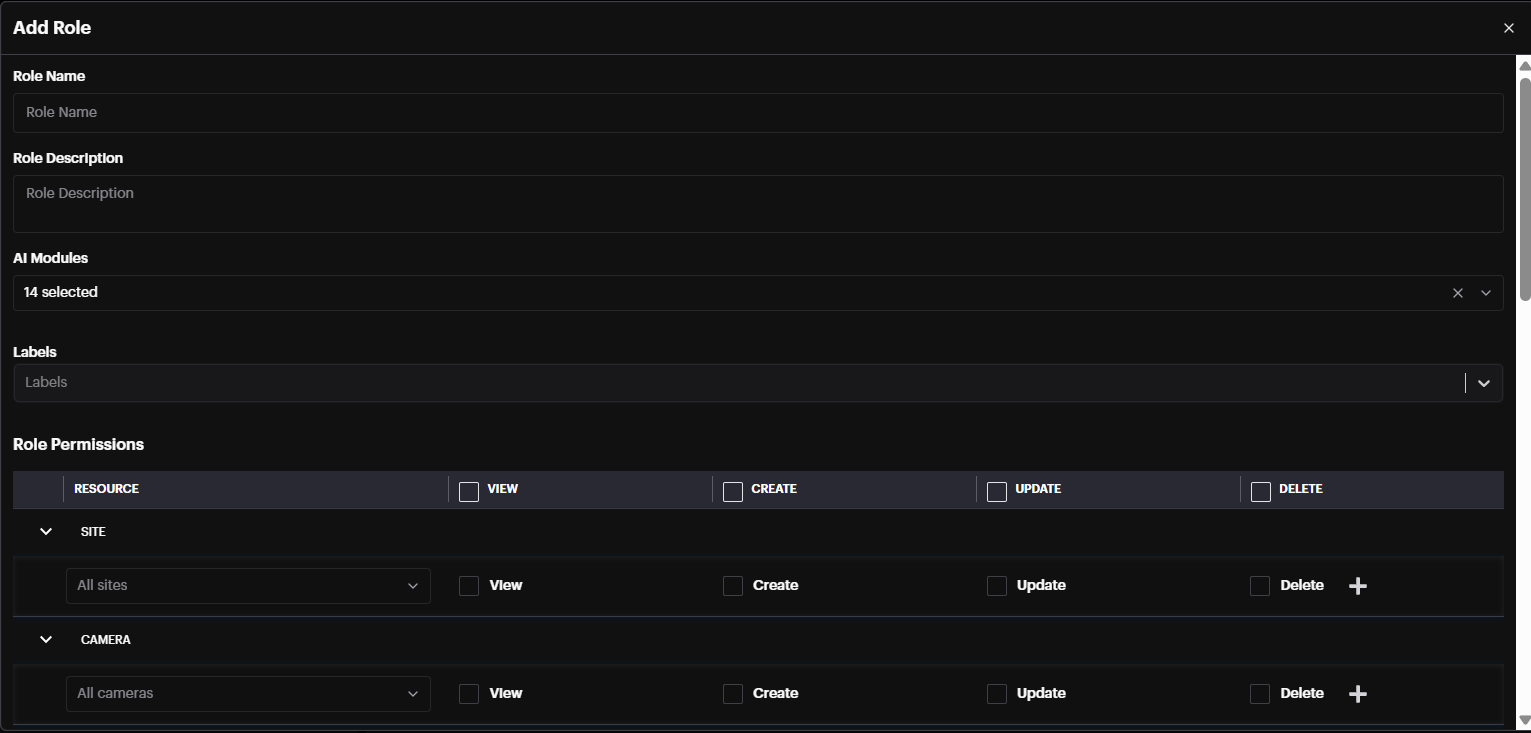
Role Description: additional info about the role
AI Modules: Select AI module(s) the user will have permission to
Labels: For Facial Recognition module, if specific labels are selected, users in this group will only receive alarms for faces with the chosen labels (e.g., VIP).
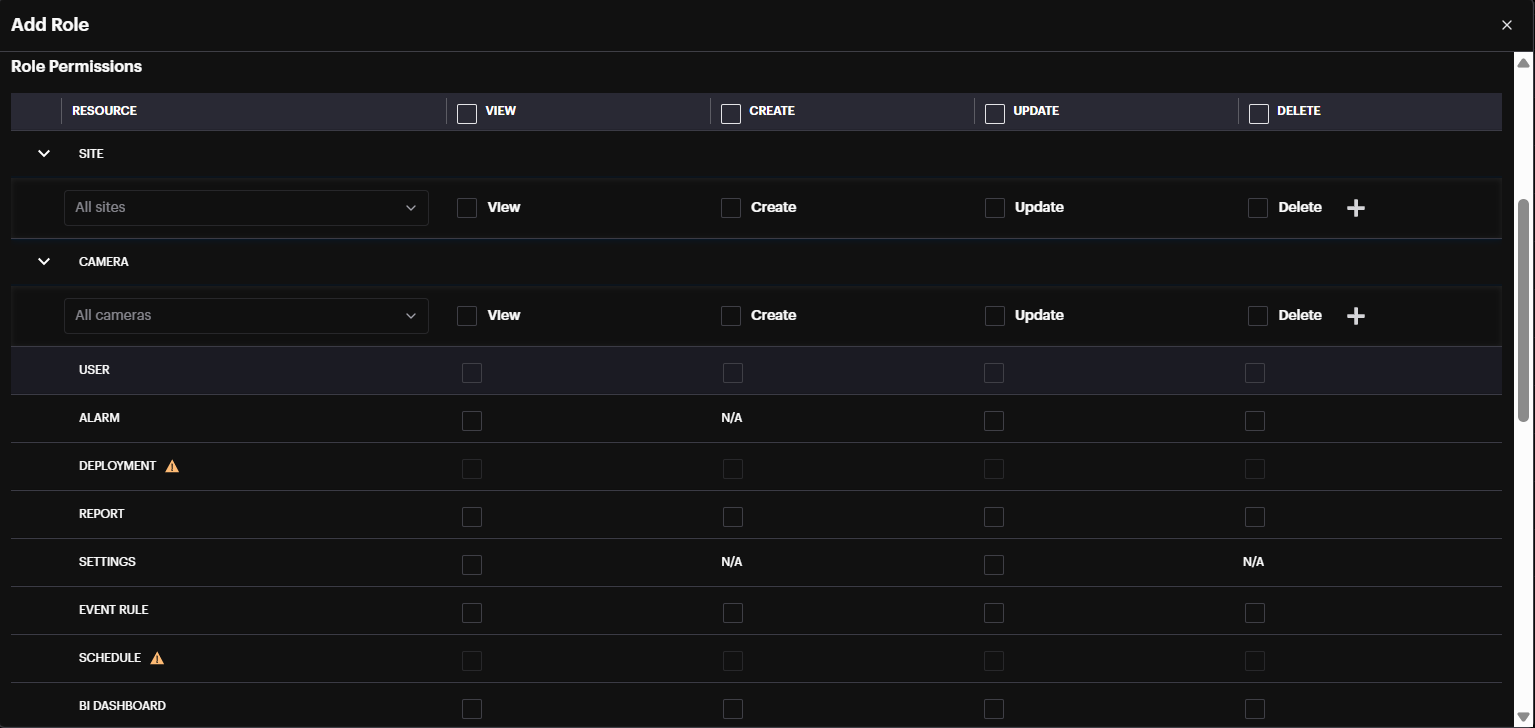
There are four types of Permissions: View, Create, Update, and Delete.
Each Resource can be configured to have different permissions.
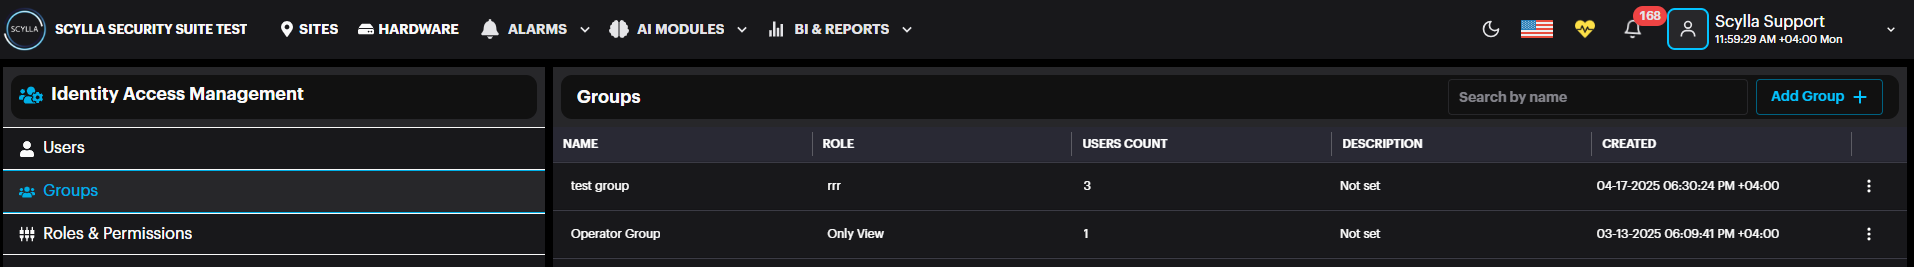
Groups
After Creating Roles & Permission, Groups should be created and linked to the Role & Permission. Select Group from the left menu then click Add Group +.
Add Group window will pop up
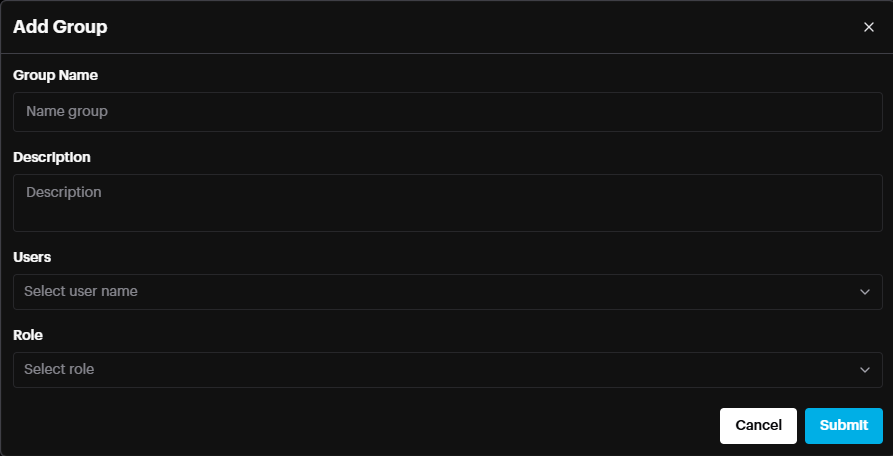
Group Name: Name the group
Description (optional): more info about group
User(optional): Select the users of this group in case the users are already created.
Role: Select the Role (Roles Permissions) that this group will have.
Click Submit.
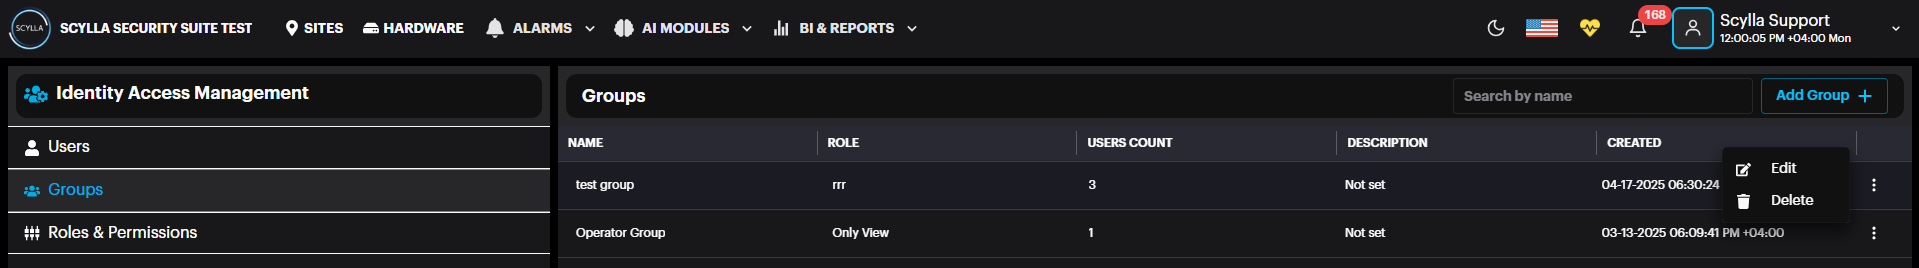
The newly created Group is added to the list. It is possible to edit or delete a group by clicking the three dots.
Users
After Creating a Group, the User should be created and linked to the Group -> the user therefore will have the Roles & Permissions granted to this Group. Click the Users from the left menu then click Add Users.
Add User window will pop up
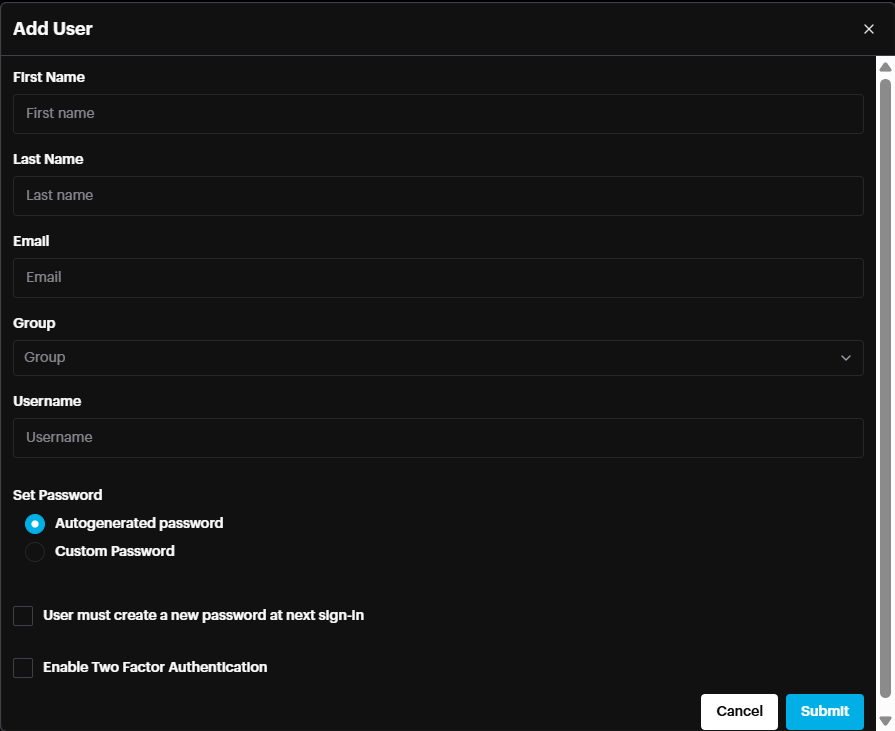
First Name and Last Name of the user.
Email address (optional)
Group: Select the Group to which this user belongs, inheriting the permissions of this group.
Username: Type a username which will be used for Login
Set Password: Either autogenerated password or User defined password.
- Autogenerate password will pop up a window with autogenerated password. Autogenerate password will pop up a window with autogenerated password.
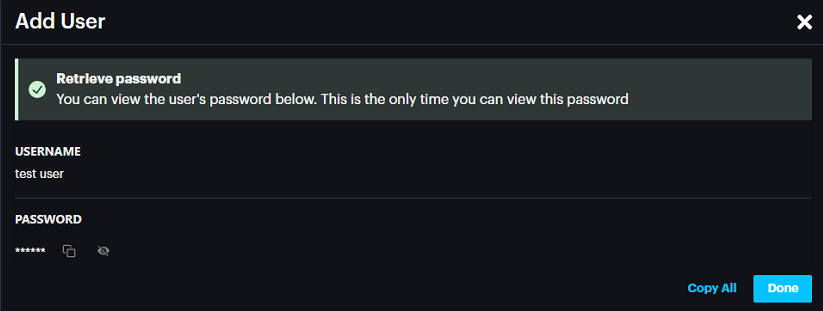
Click Done.
- Custom password enabled the user to set a password based on the Security settings configured on dashboard. Custom password enabled the user to set a password based on the Security settings configured on dashboard.
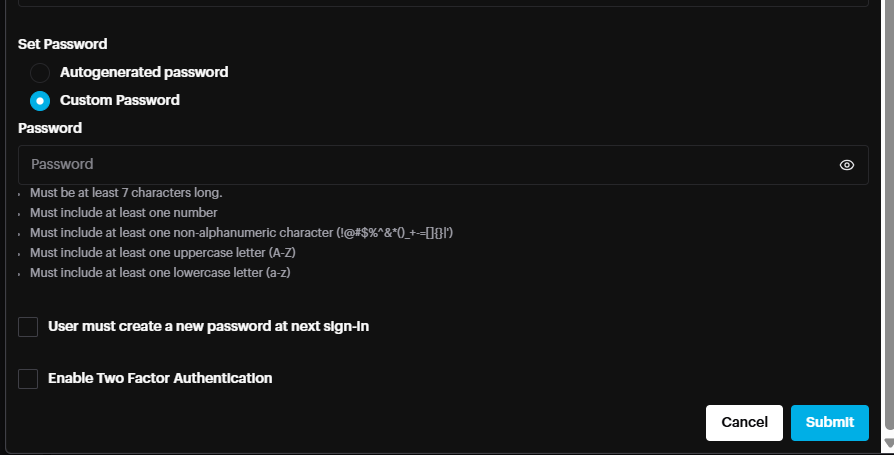
User must create a new password at next sign-in: User can define new password next time he login
Enable Two Factor Authentication: 2FA will be enabled for this user based on the 2FA settings in Profile-> Password & Security
Click Submit.
The newly created user is ready to login and will have the permissions granted to the group belongs to.
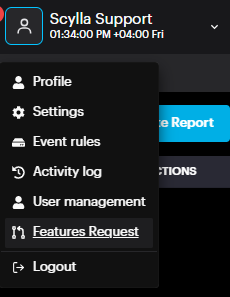
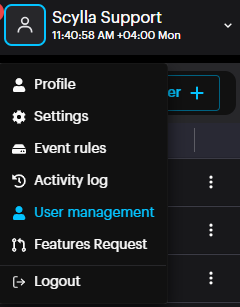
Features Request
To access the Feature Request form, click on your username, then select Features Request from the drop-down menu.
A new tab will open in your browser, containing the New Feature Request form.
Fill out the following fields.
Task name: give your new feature or function a unique name.
Task description: provide enough information to fully explain how the new feature or function should work and how it would make your use of Scylla more enjoyable.
Attachment: Attach screenshots or drawings to assist us in better understanding the request.
Submitted by: Kindly enter your first and last name.
Finally, complete the CAPTCHA and click Submit.
Logout
To log out from your user account, click on the username and click Logout.
We value and appreciate your feedback. If you have any questions or suggestions, please contact support@scylla.ai or submit a request to the Scylla Help Center at https://support.scylla.ai/portal/en/home.