Immix Autopatrol
This manual provides an overview of Scylla - Immix Auto Patrol integration and instructions on how to use it.
Immix Auto patrol is used to run automatic HealthCheck (tampering & scene change detection) and Intruder detection on cameras found on immix and based on schedule(s) specified in immix account.
Immix Configuration
Login to Immix account and navigate to System -> Auto Patrol Vendors
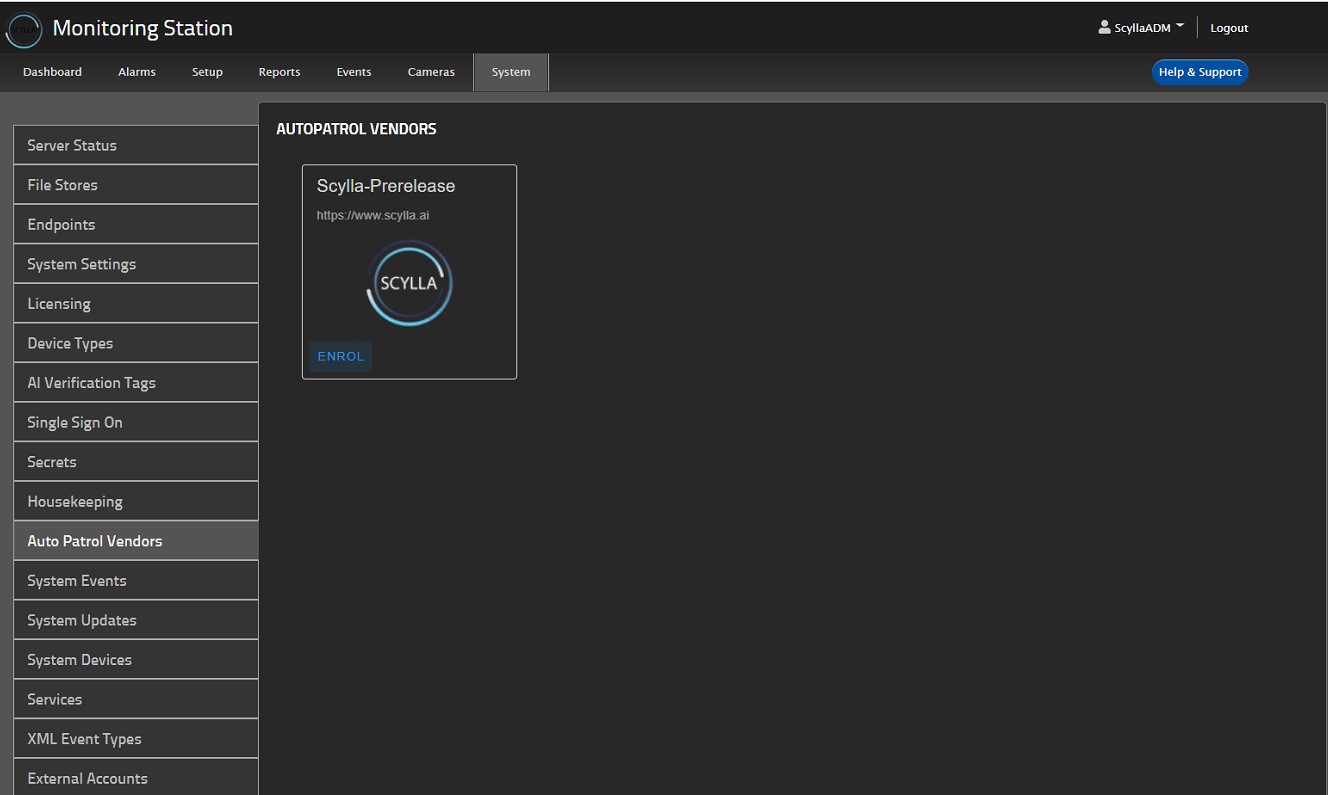
Now Click the ENROL button inside SCYLLA thumbnail.
Once enrolled, an email will be sent to support@scylla.ai activate the contract, once activated the user will receive an email with login credentials of a Scylla Portal.
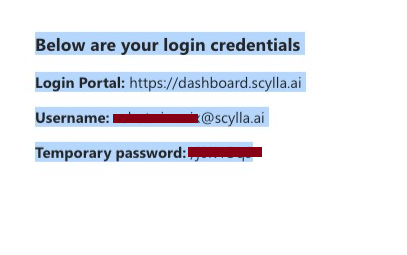
Login to https://dashboard.scylla.ai using the temporary password and you are asked to enter a new password.
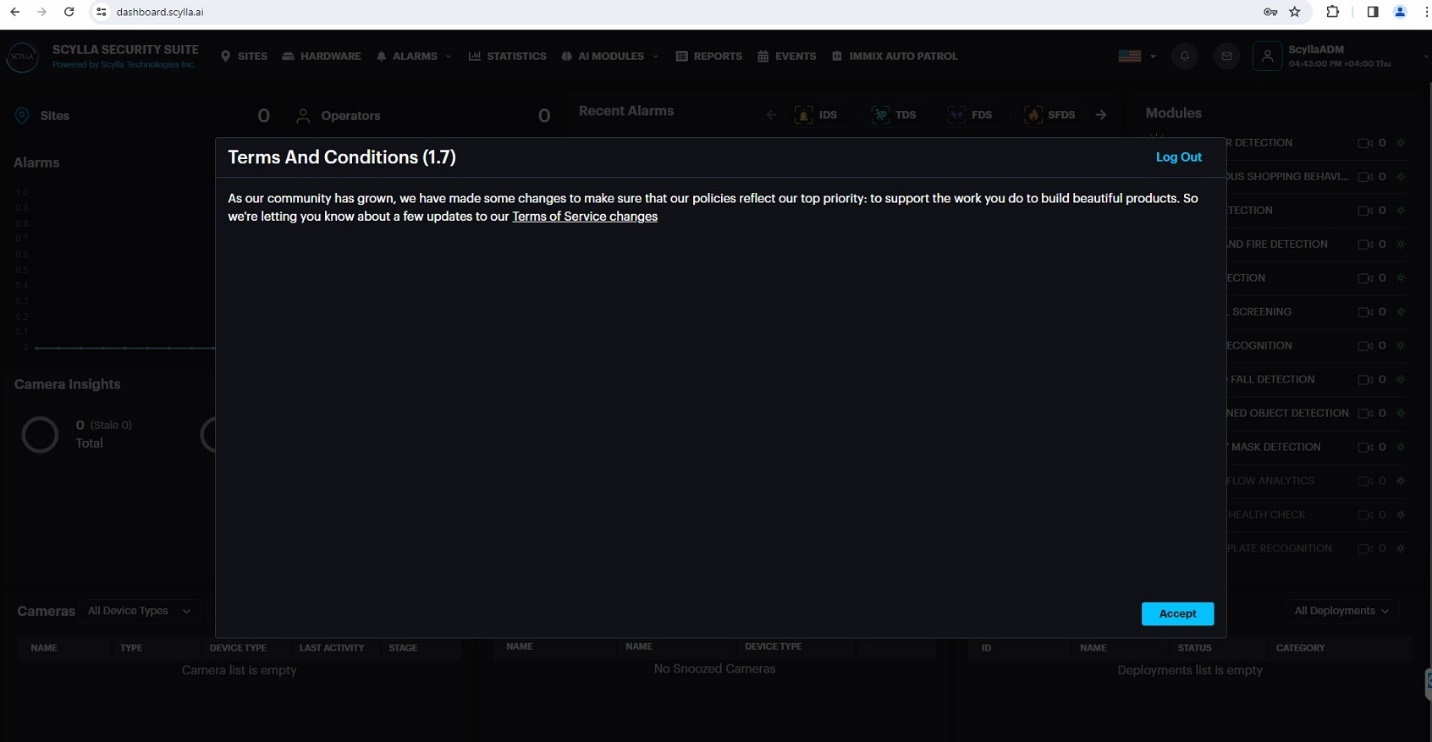
Once a new password is set, the following page appears.
Camera Reference Shot
Back to immix, go to Setup menu
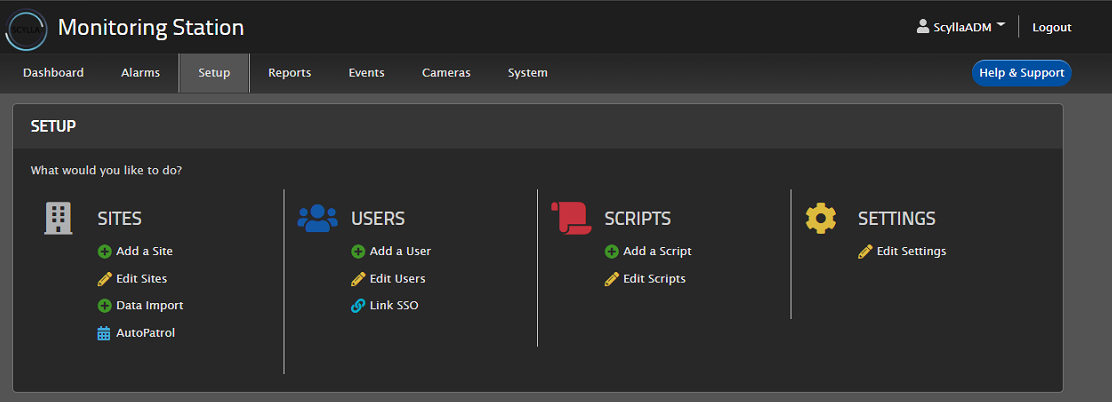
Click Edit Sites (assuming Site with cameras already exist)
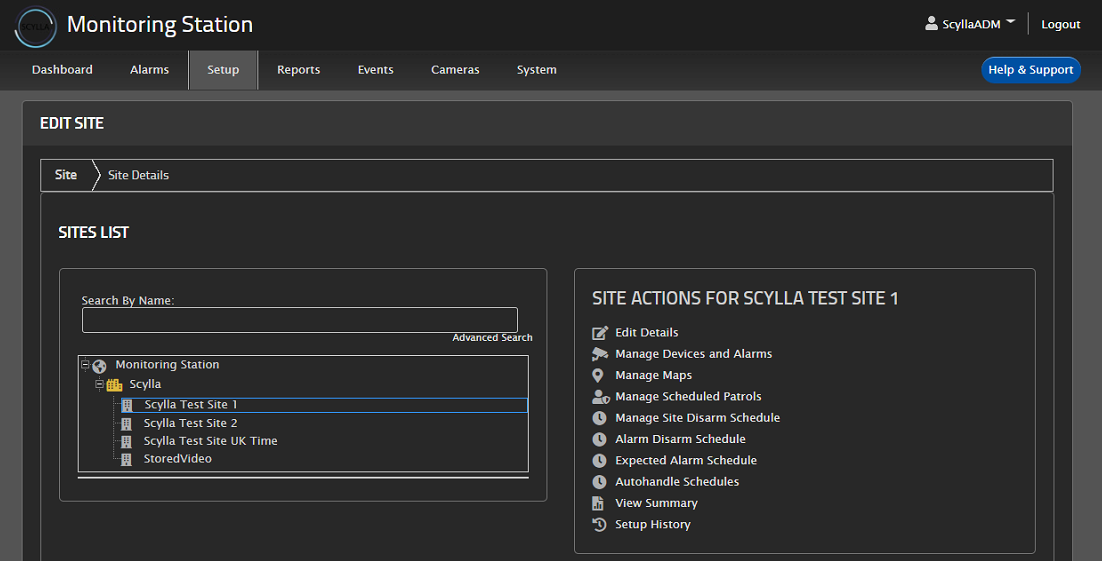
Select the site on the left, click Manage Devices and Alarms from the right section
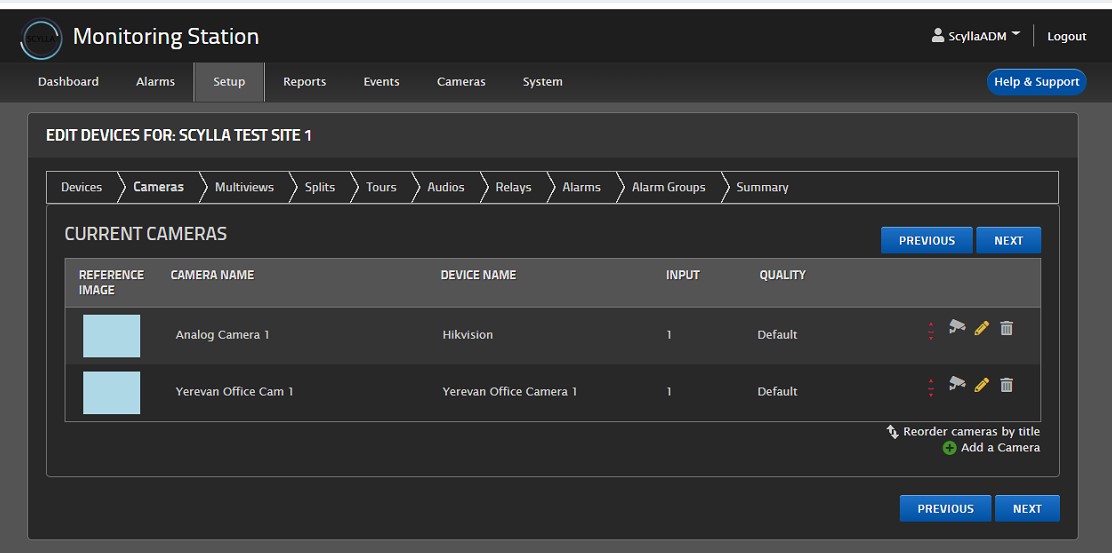
Select the Cameras tab
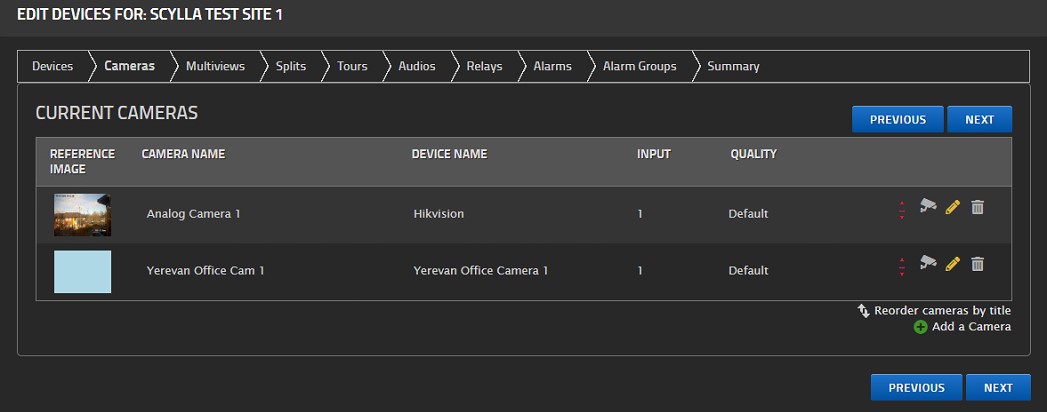
To take a reference shot for a camera, click the camera icon for a camera
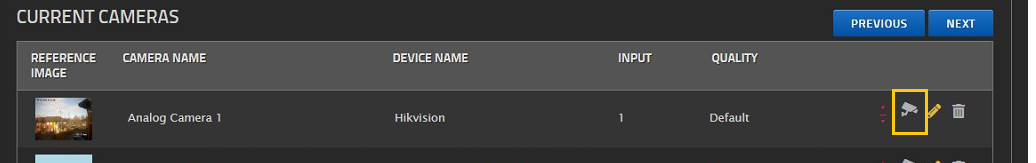
Camera Preview window appears, click TAKE REFERENCE SHOT button.
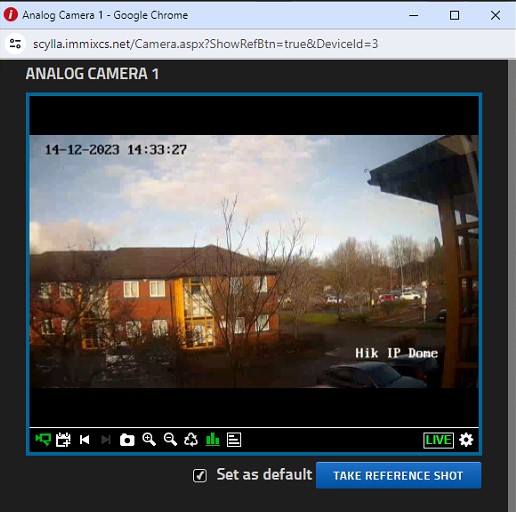
Close the window and the reference shot will appear in the camera record.
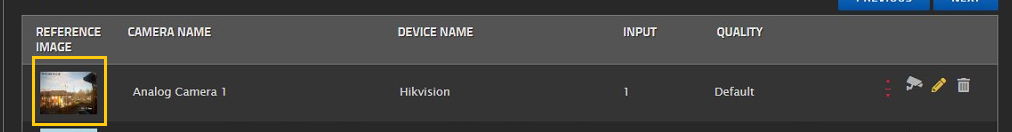
This reference shot is important to appear also in Scylla Dashboard. Repeat for all cameras that do not have a reference shot.
Immix Plan and Action
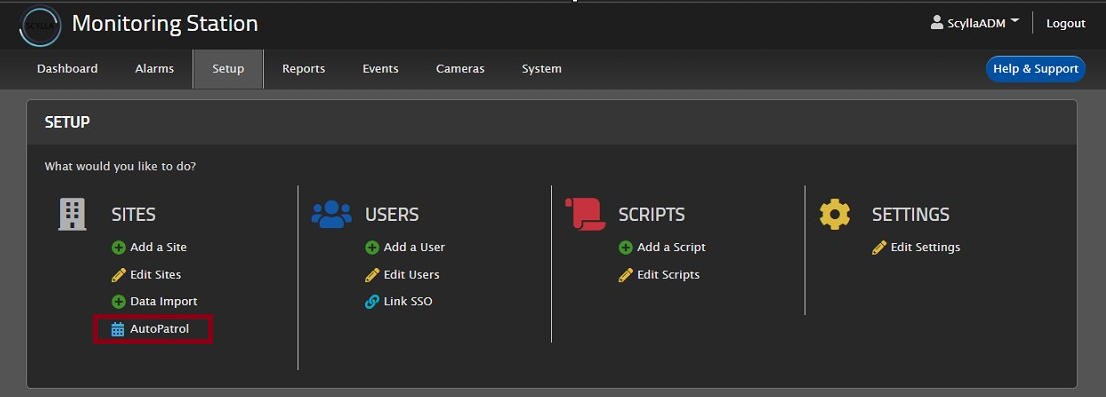
To Create Plan and action on immix, go to Setup -> Sites-> AutoPatrol
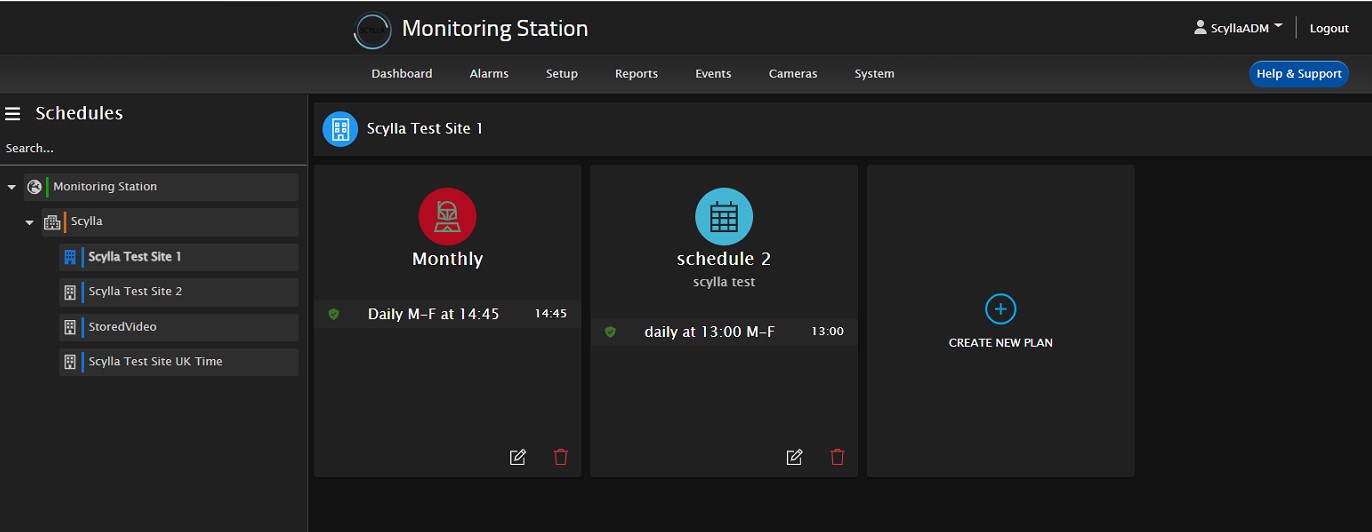
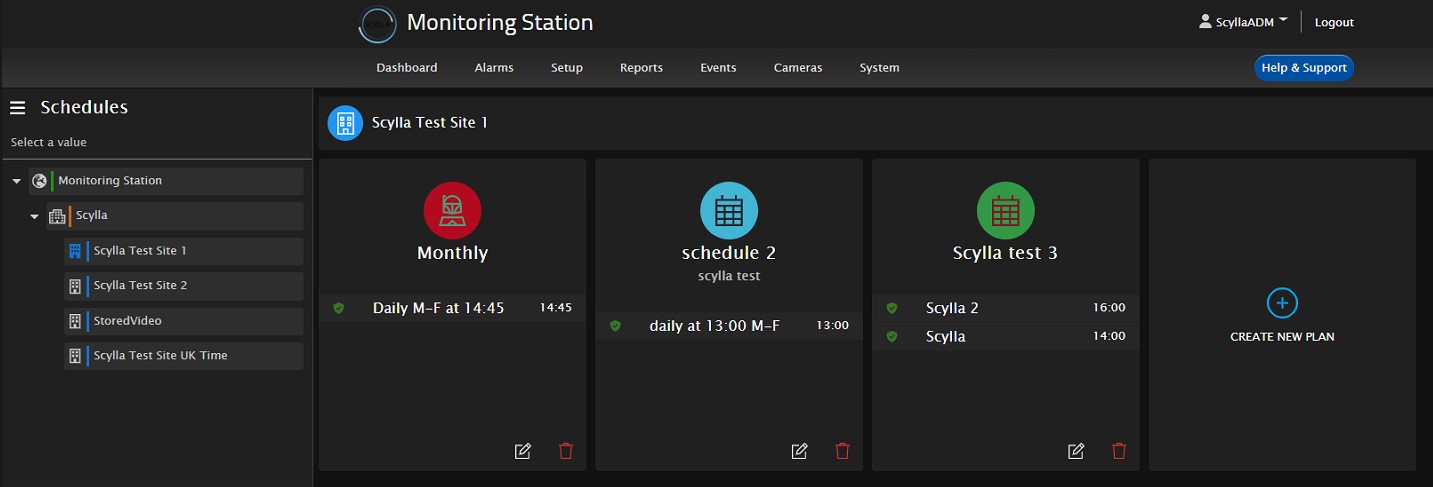
In the Schedules page, select the site from the left list then Create New Plan.
The plan and action created here will be synchronized to scylla dashboard. Synchronization occurs every minute.
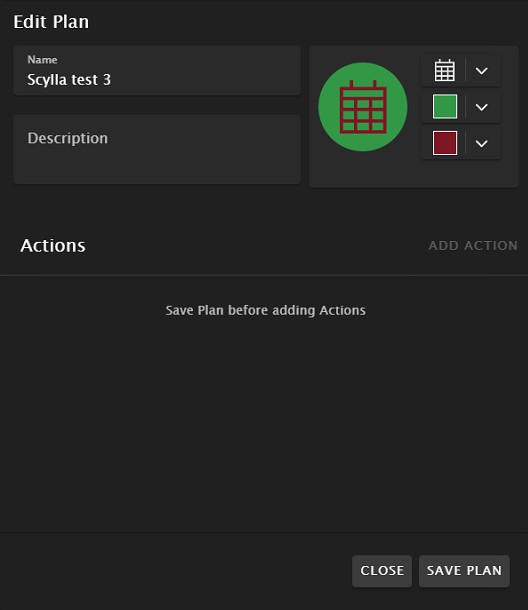
Name the Plan, add a description, change the icon shape and color.
Click SAVE PLAN.
Once Plan is saved, the ADD ACTION button will become active.

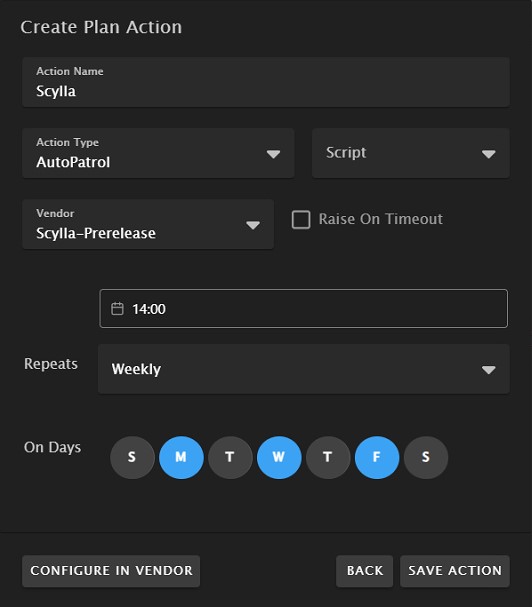
Click ADD ACTION
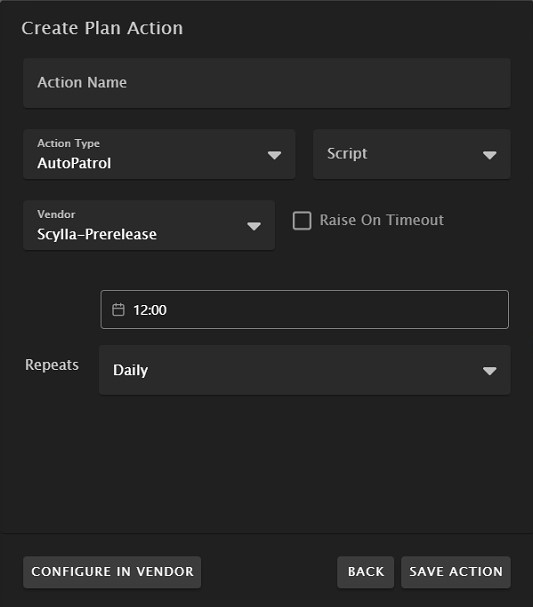
Name the action, select Auto Patrol as Action Type, Select Scylla as Vendor.
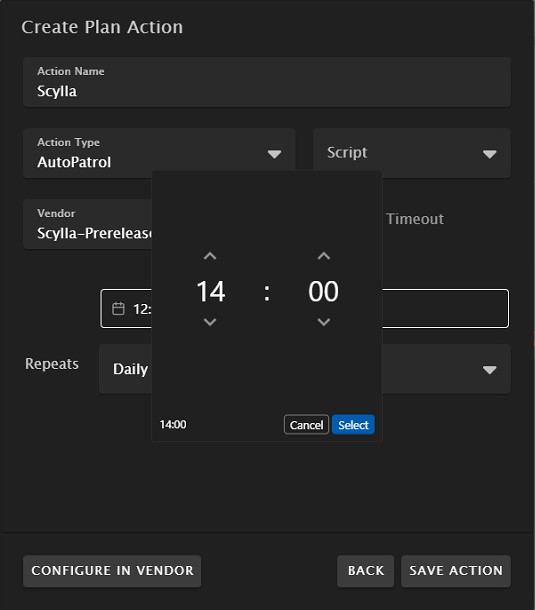
Set the time by clicking on the time and selecting the required time for Auto patrol.
In the Repeats Section, choose Daily, Weekly or Monthly and select the days for this action to be active.
Daily will repeat the action every day at the mentioned time.
Weekly will repeat the action every selected day of week.
Monthly will repeat the action every selected day of the month.
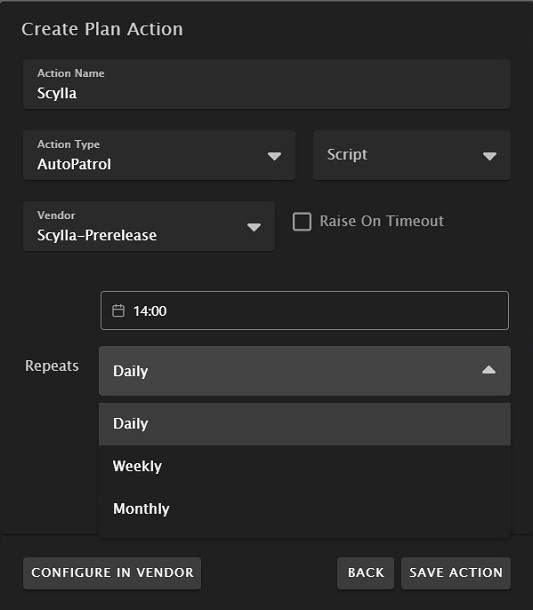
Choosing weekly will show the days. Select the required days and click Save action.
Now the Plan will show the newly created action. The icon besides the action will have Awaiting status until it is synchronized with Scylla.
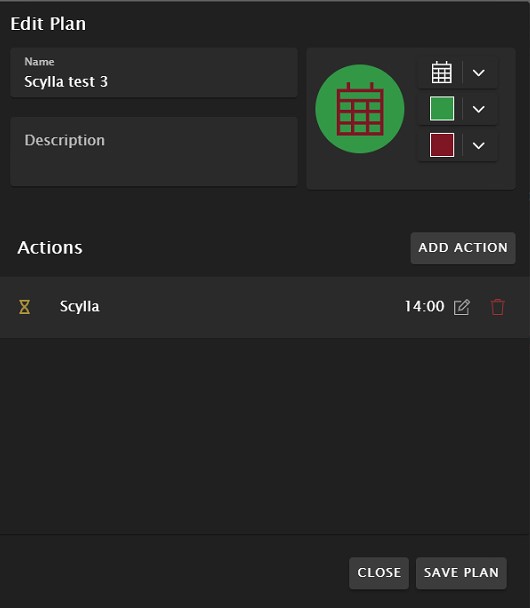
Close the Plan page.
Back to the Schedules page, all the plans will appear with their actions.
Scylla Dashboard
Login to Scylla Dashboard
To use Scylla Security Suite, you first need to login to the dashboard.
Dashboard is publicly accessible by the following URL: https://dashboard.scylla.ai/login
If you are already logged in, you will be redirected to the main Dashboard page.
If you are not logged in, you need to enter your Email and Password into the corresponding fields and click the Login button.
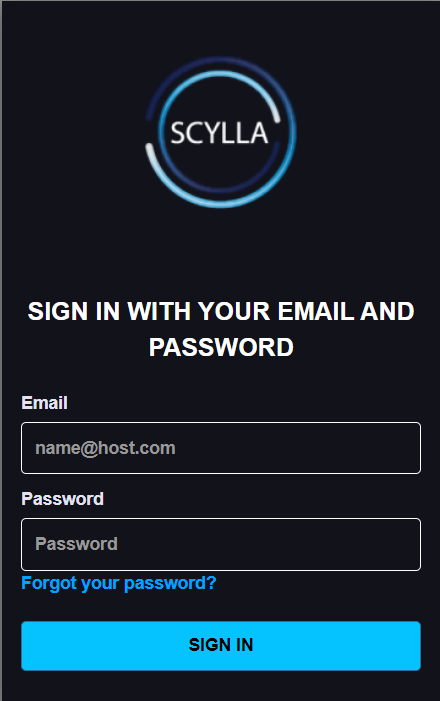
Please be attentive while entering your username and password into the fields. Make sure you have not copied any additional characters.
After entering your credentials and clicking the Login button you will be redirected to the Dashboard page.
If you see the “Incorrect username or password” message, that means you have entered wrong credentials.
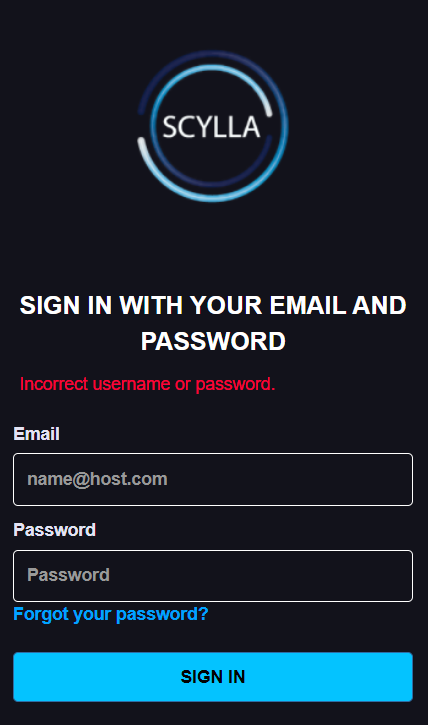
Double-check and reenter your credentials. If this message appears again, contact your administrator, or reset your password. See the Reset Password section for more instructions.
If you are not able to log in and there is no message, try to clean your browser’s cache and try again. See this article for detailed instructions on how to clean your browser’s cache. If cleaning the cache does not solve the problem, you are always welcome to submit a request on the Help Center.
Reset Password
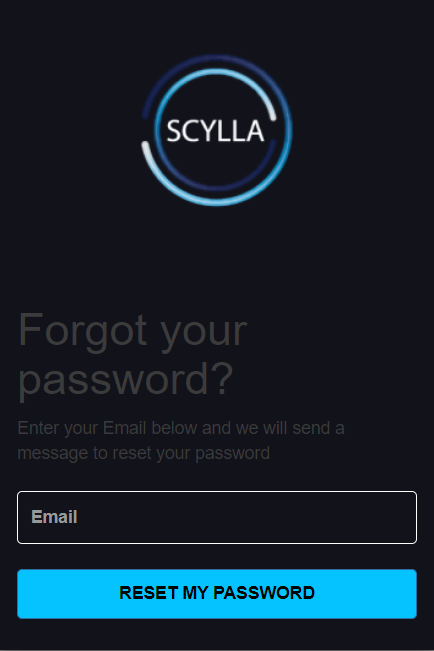
To reset your password, click the Forgot your password? button on the Login page.
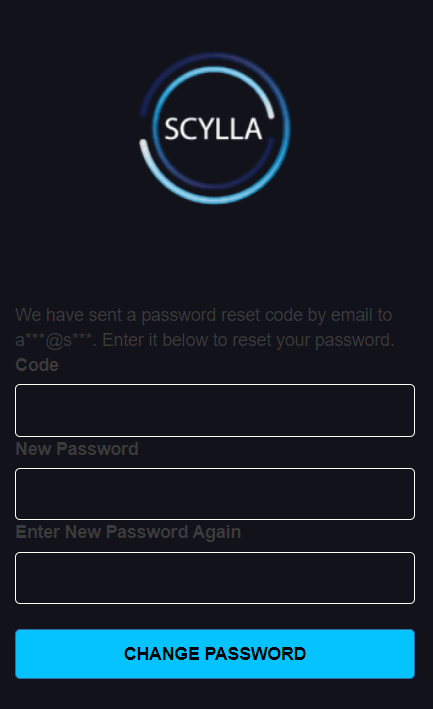
Then enter your email and click on Reset my password button to receive your reset code.
Then fill all fields with the required information and click the CHANGE PASSWORD button.
Immix AutoPatrol
Login to Scylla dashboard and navigate to IMMIX AUTO PATROL page.
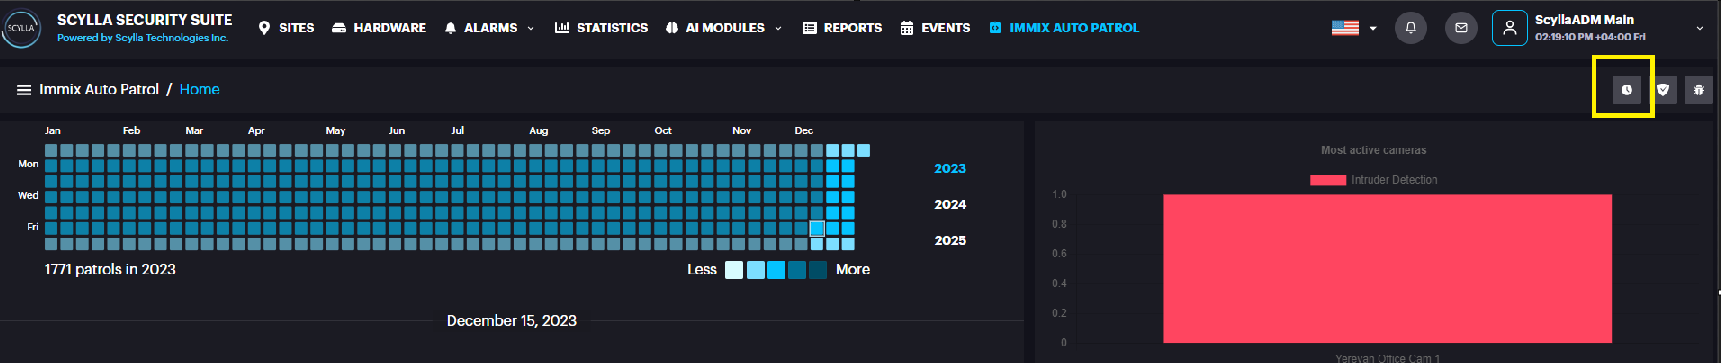
Home
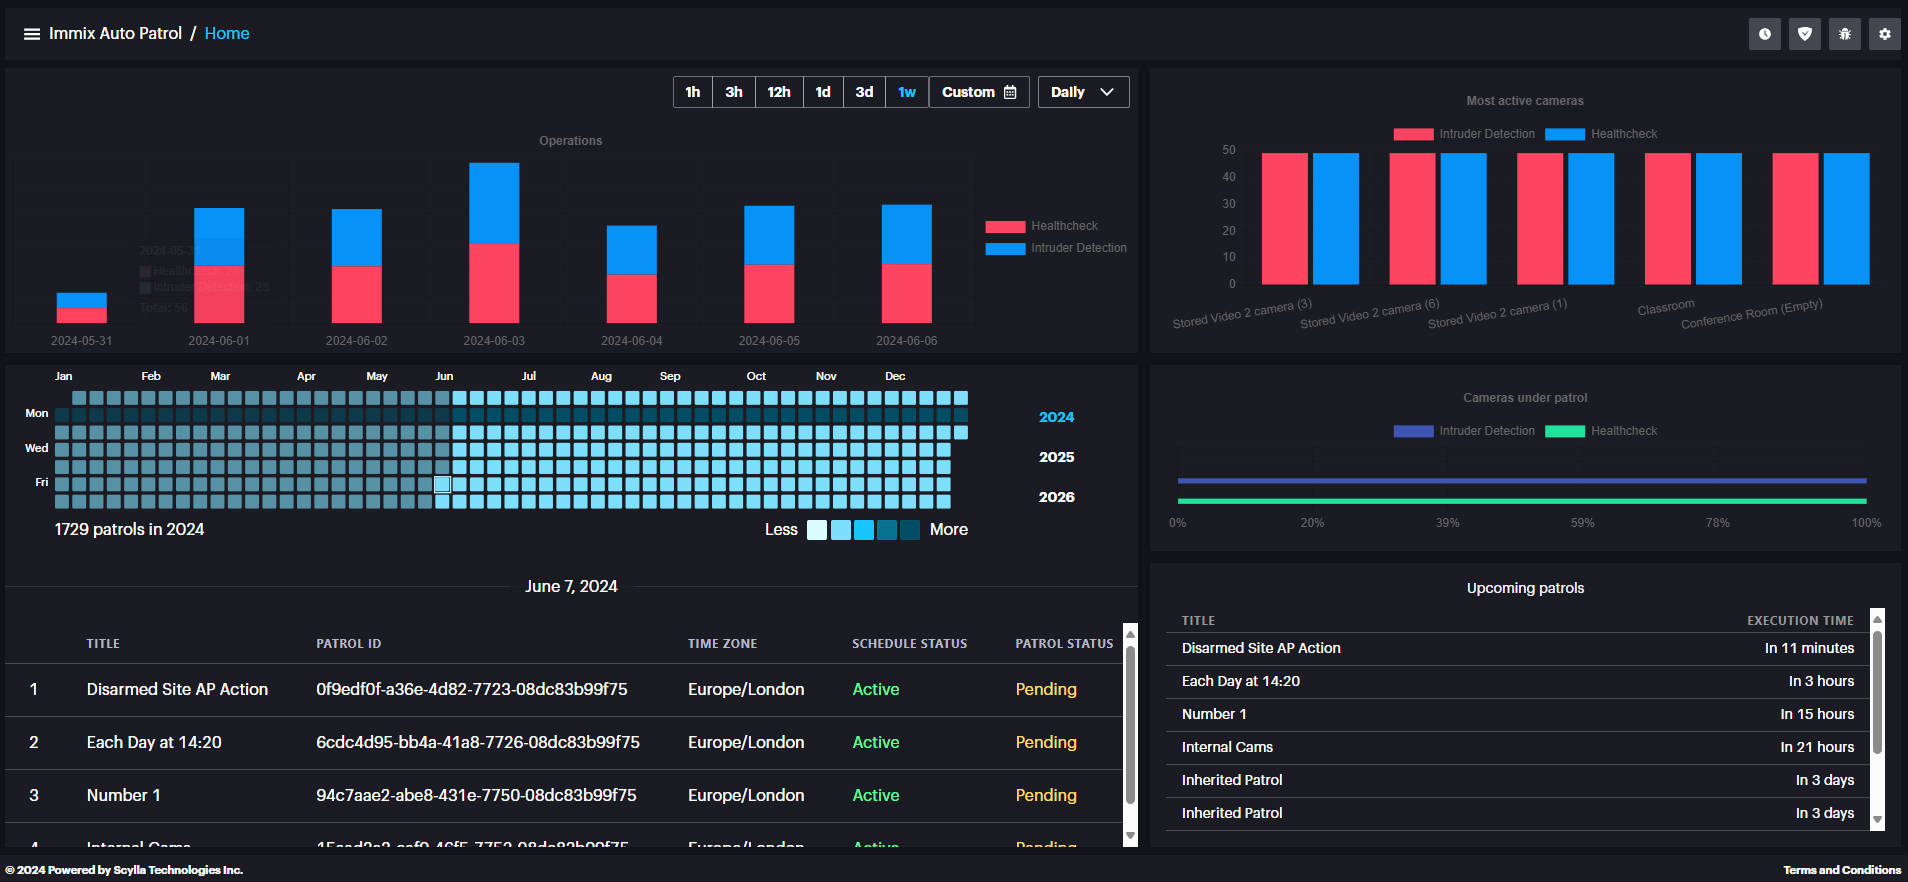
In the upper left window, a calendar is displayed where each box represents a day.
Hovering the mouse on the box will display information about the number of patrols configured for that day.
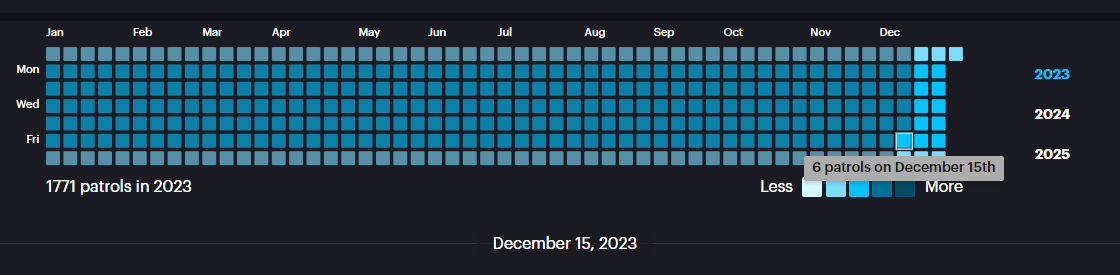
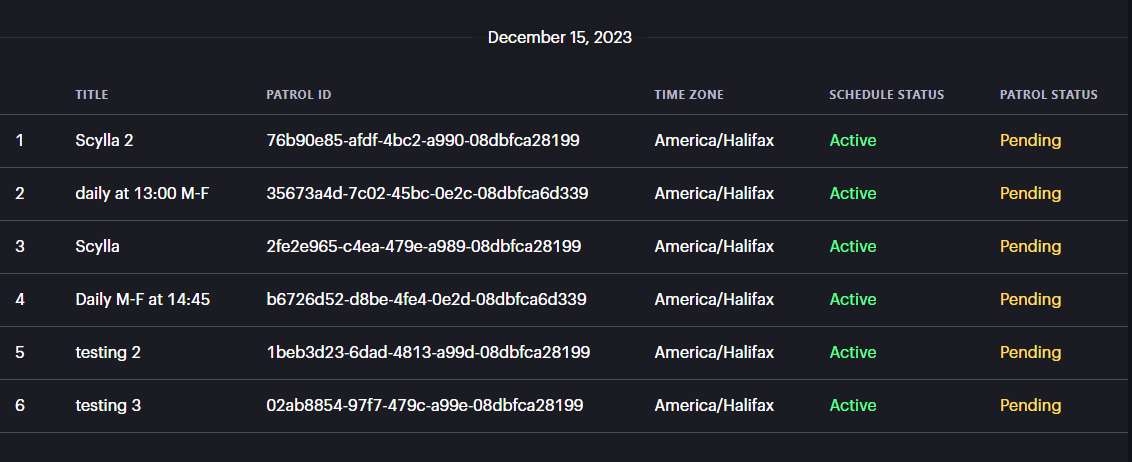
The bottom left window displays the Patrol(s) Title, ID, Time zone, Schedule status and patrol status.
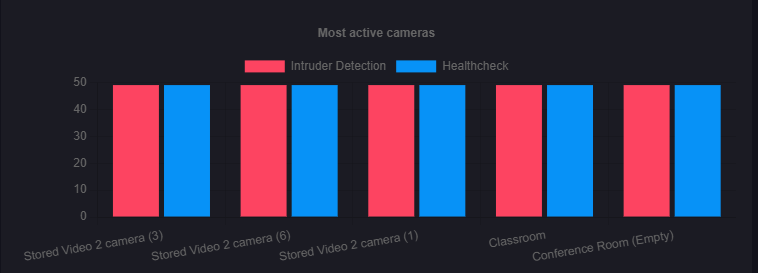
Upper right window displays the Most active cameras which means the cameras with most alarms.
Middle right window displays Cameras under Patrol information, how many cameras have the HealthCheck enabled and how many cameras have Intruder detection enabled.

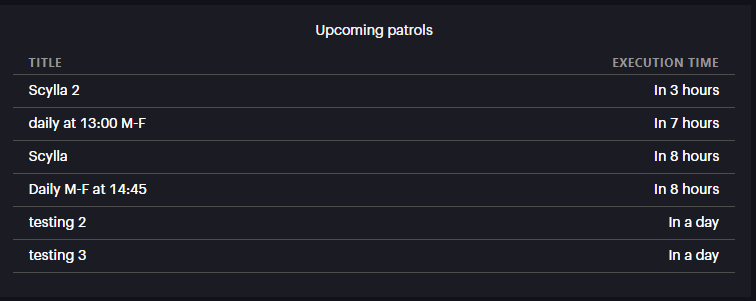
The bottom right window displays the upcoming patrols information.
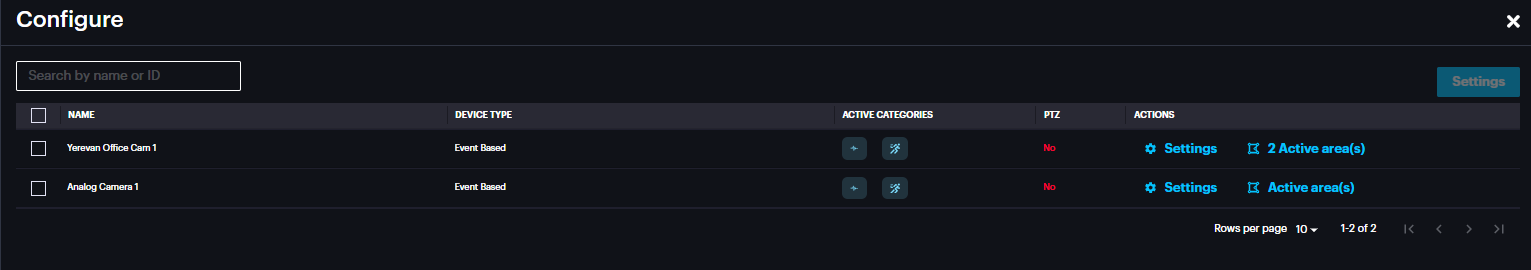
Schedules
From the home page, click the Schedules button to view the schedule lists configured on Immix and synced to Scylla.
List of the schedules appears. Each Schedule which is synced from the Immix has cameras attached to it.
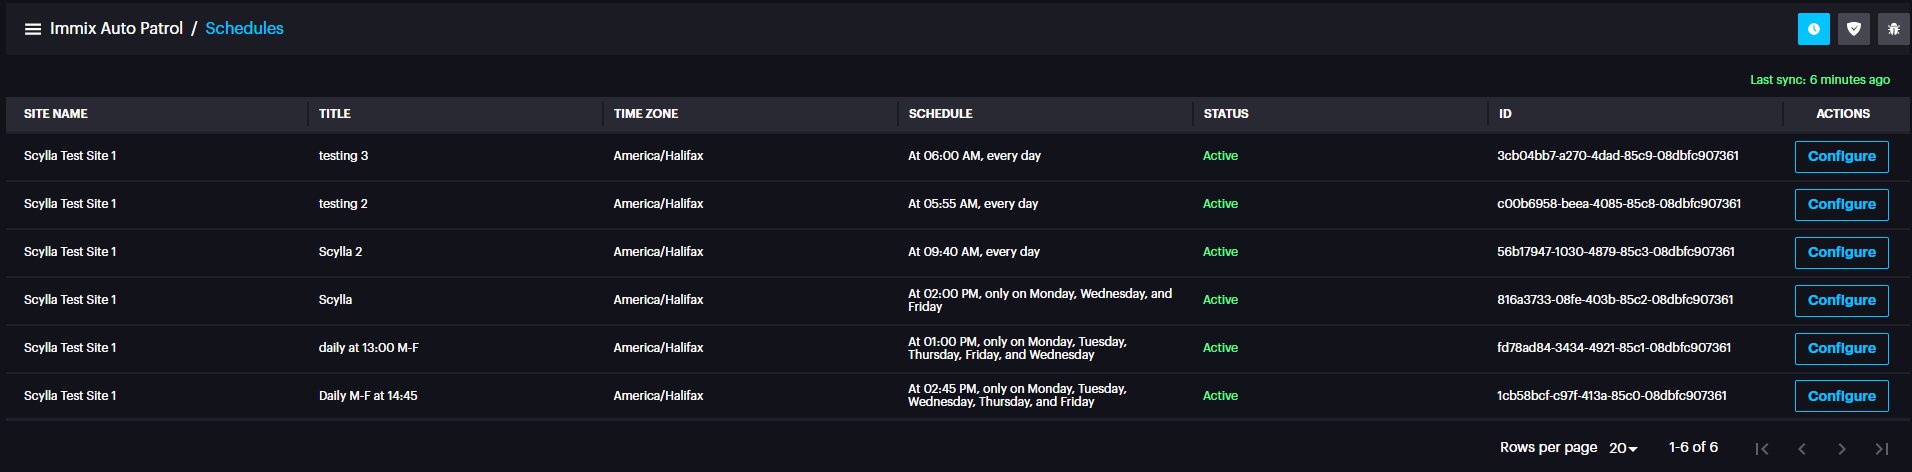
For each schedule you can configure its attached camera (s) actions and active areas.
Actions include HealthCheck and Intruder detection.
Click Configure button and list of cameras attached to that schedule appear.
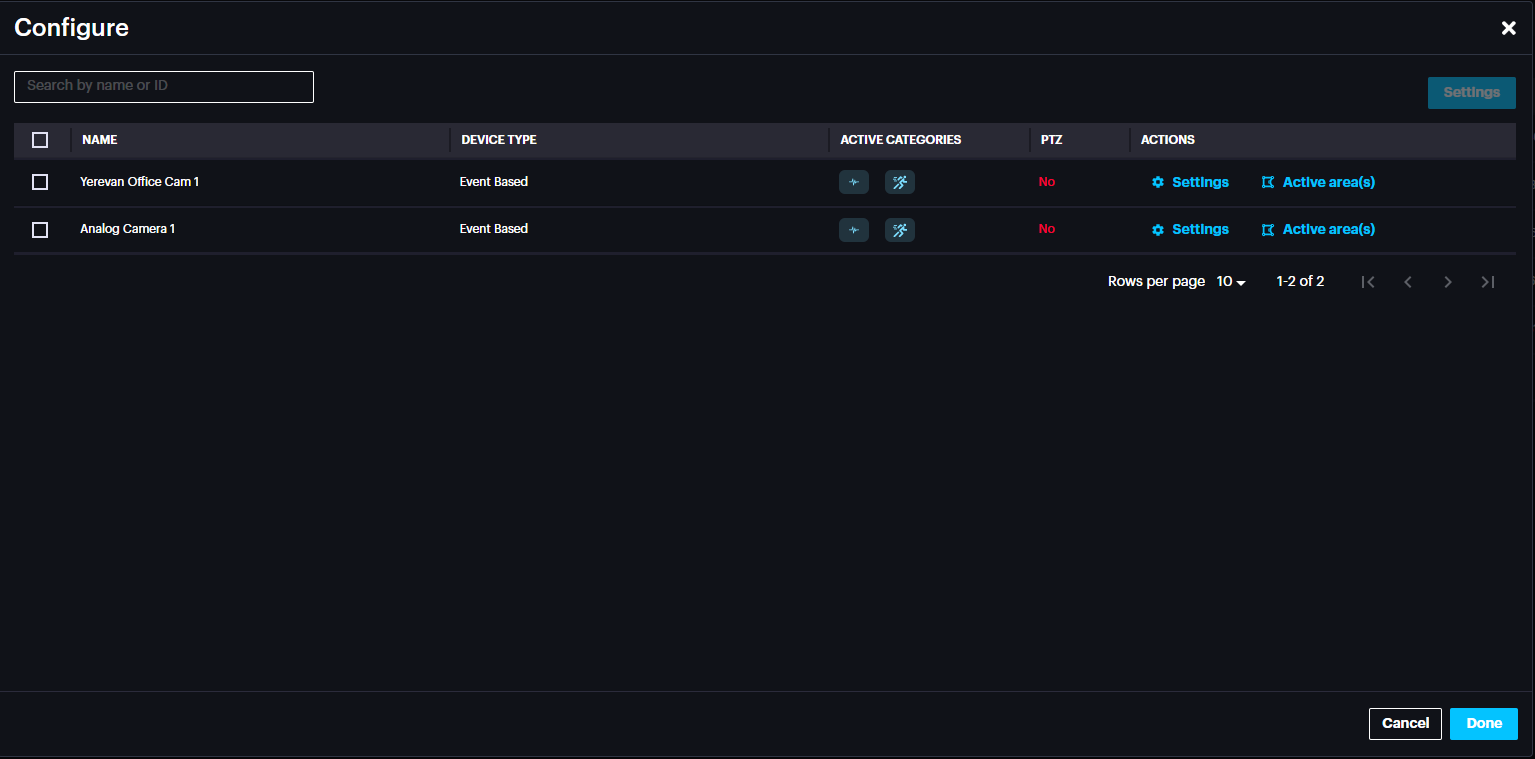
It is possible to select a camera and configure its settings or select all and do a bulk setting.
Settings
Click the settings button to activate/deactivate HealthCheck and intruder detection for that camera (s).
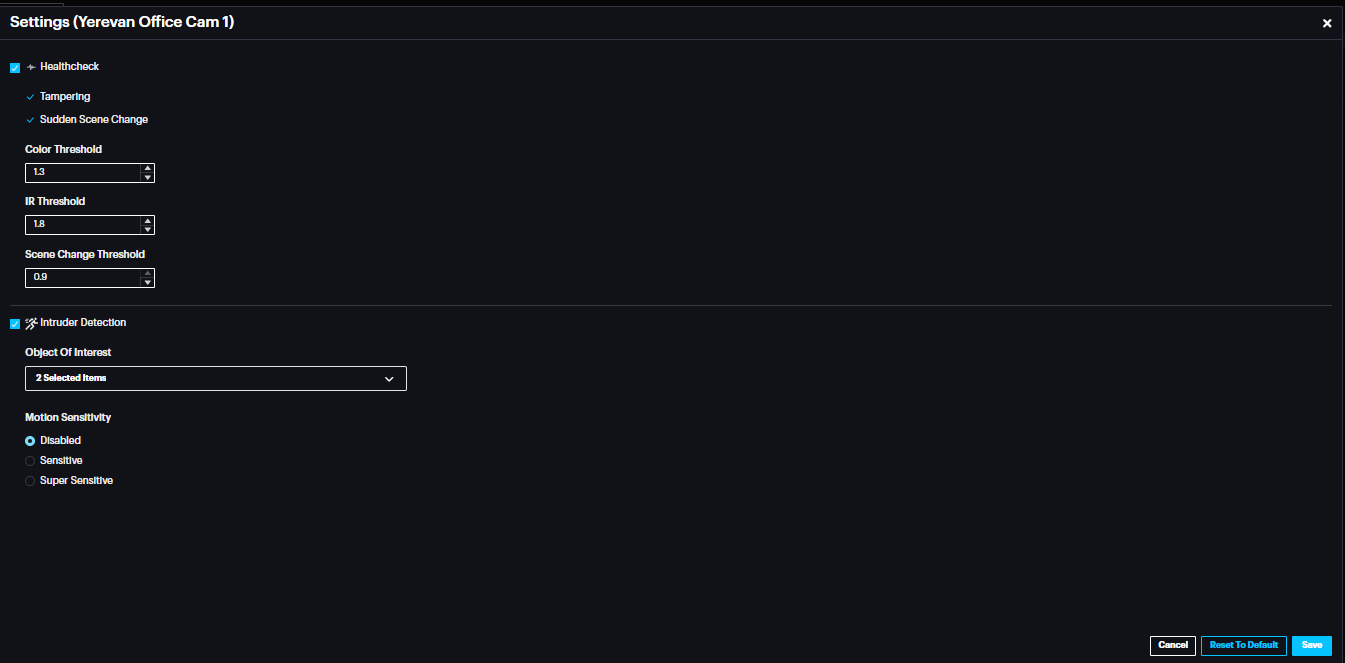
Healthcheck includes Tampering and Sudden Scene change detection.
Healthcheck default thresholds are the recommended settings.
Intruder detection detects Person, Vehicle or both based on the Object of Interest settings.
Motion sensitivity settings have three options; disabled, sensitive and super sensitive.
Disabled - motion is not considered. The whole frame/video is sent to AI and is analyzed with no focus. Should be used wherever the background is not static.
Sensitive: motion detection sensitivity here is normal.
Supersensitive: motion detection algorithm in this setting has higher sensitivity. Should be applied if small/minor motion acts are of interest.
Active area(s)
Click active area(s) in the camera record to fetch camera frame and draw the area(s) for intruder detection.

Click Next.
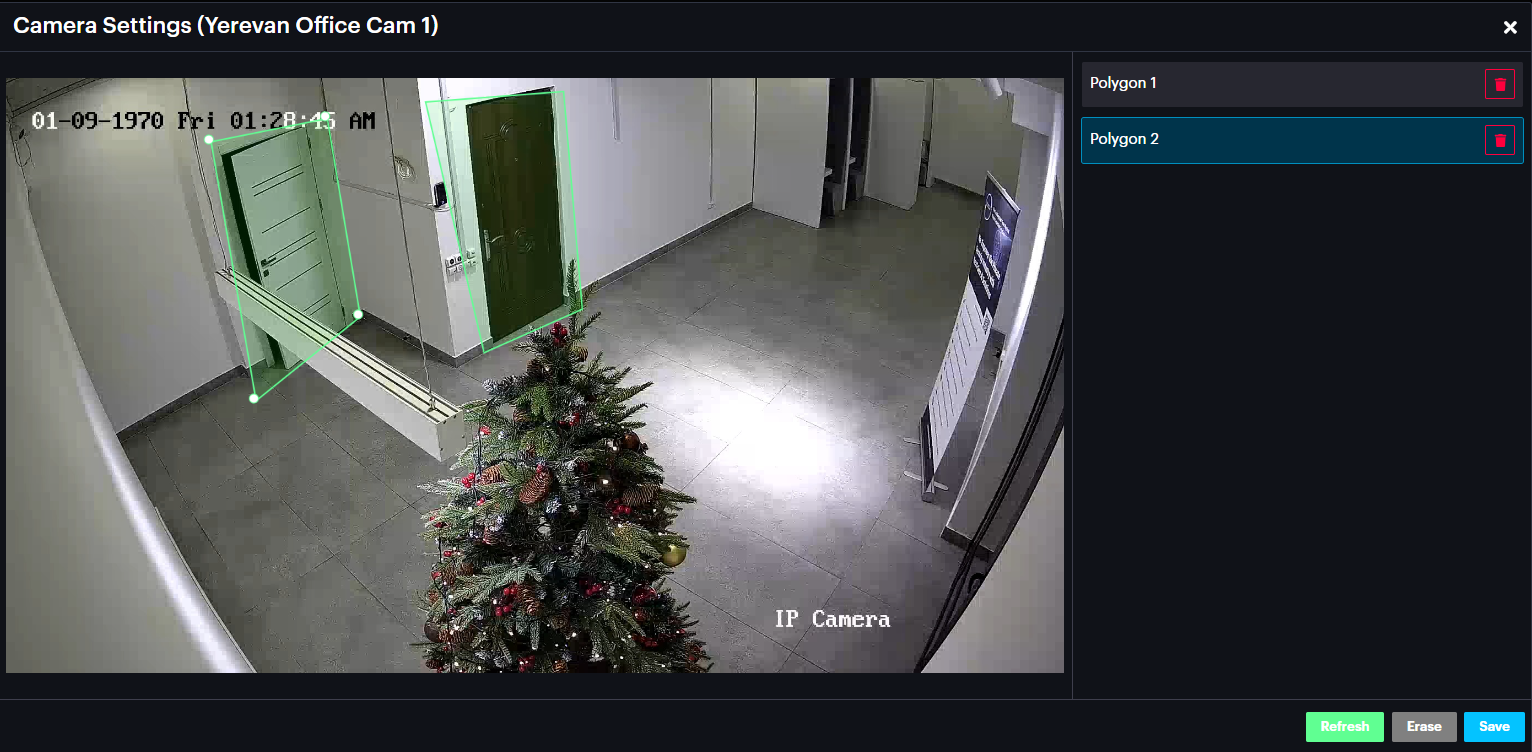
Draw the area(s) , Left-click on the desired starting point for one line, then hover your mouse to the desired ending point and left-click. Now you have drawn one line. Repeat this process to create detection zones in your camera’s frame. Click Erase to delete all zones. Click Refresh to refresh the frame. Click Save to save all drawn zones.
The camera record now displays 2 Active areas.
Click Done.
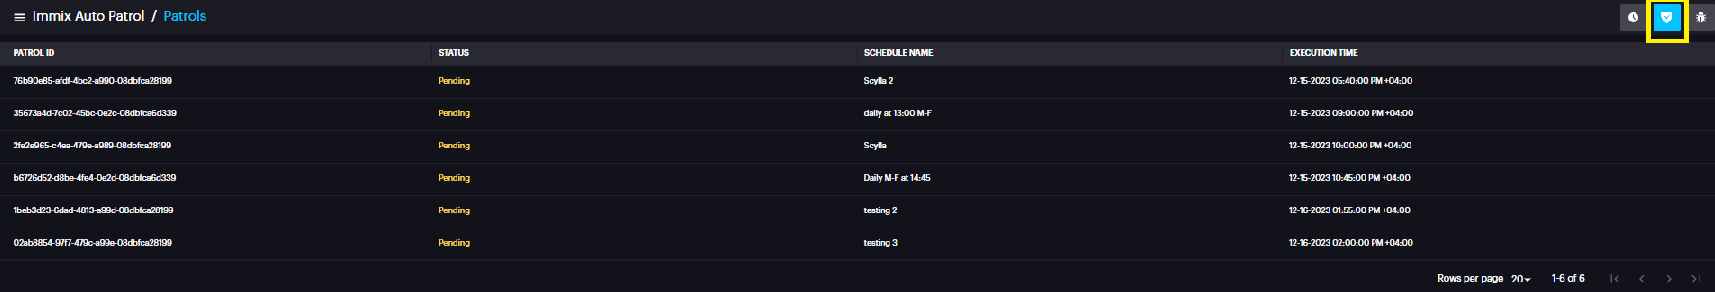
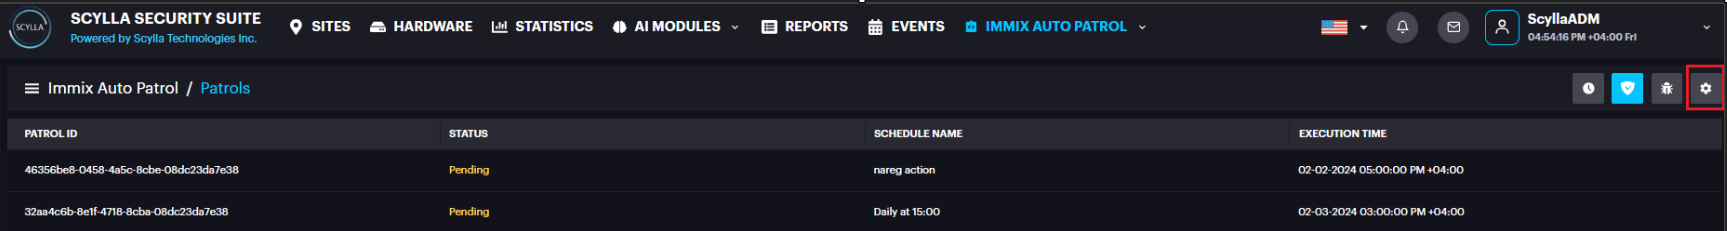
Patrols
CIick the Patrols button to navigate to Patrols page and view the list of patrols with their ID, status, schedule name and Execution time.
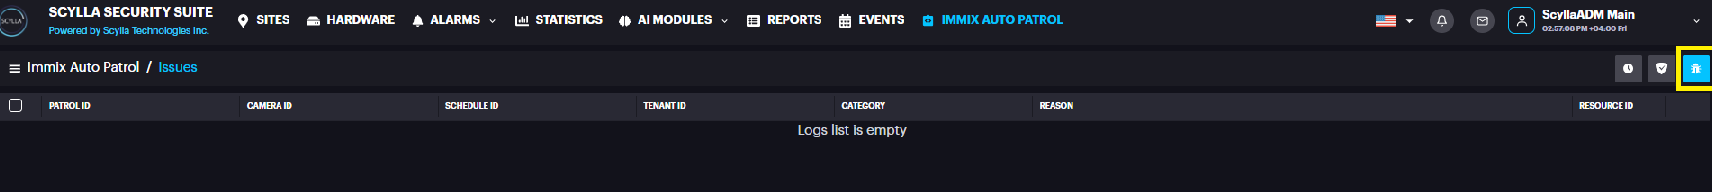
Issues
Click the Issues button to navigate to the Issues page where logs regarding auto patrol issues are displayed.
Settings
Click the settings button to open the autopatrol settings window.
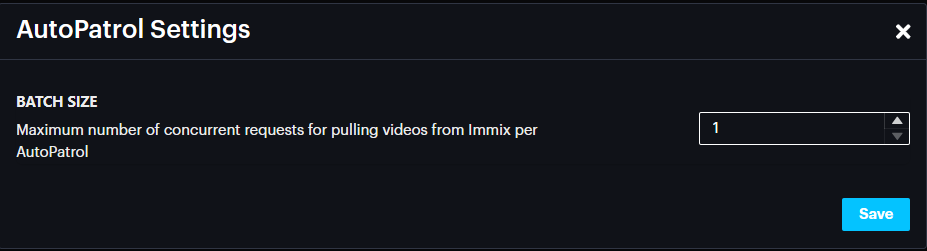
Set the Batch size, which is the maximum number of concurrent requests for pulling videos from Immix per Autopatrol , click Save.
Alarms
During Patrol when tampering, scene change or intruder is detected, alarm is triggered.
In case of no detections, alarms will appear in the rejected alarms.
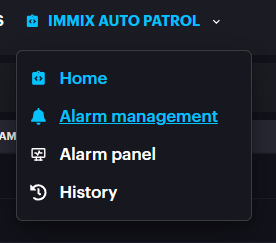
Alarm Management
Alarm Management dashboard allows to:
- see all alarms from all integrated devices with detailed information;
- see the snapshot of the detection occurrence;
- see the recording of the alarm (if available);
- acknowledge, Dismiss, Marks as False and Share the alarm; see all alarms from all integrated devices with detailed information;
see the snapshot of the detection occurrence;
see the recording of the alarm (if available);
acknowledge, Dismiss, Marks as False and Share the alarm;
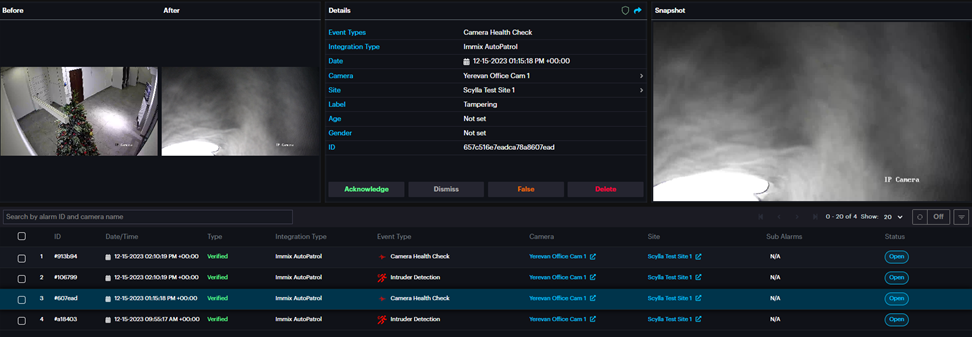
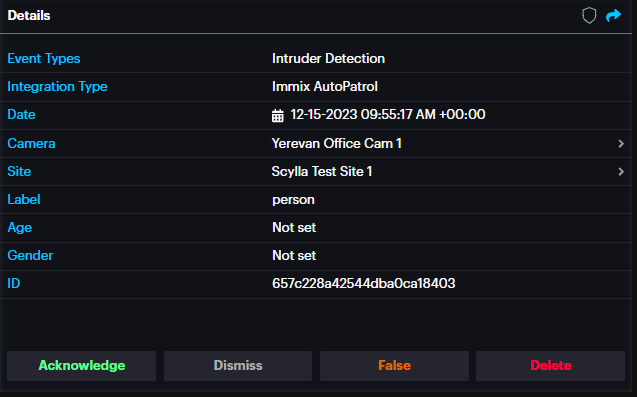
Select the desired alarm. You can see the snapshot of detection occurrence, and a recording (if available).
![]()
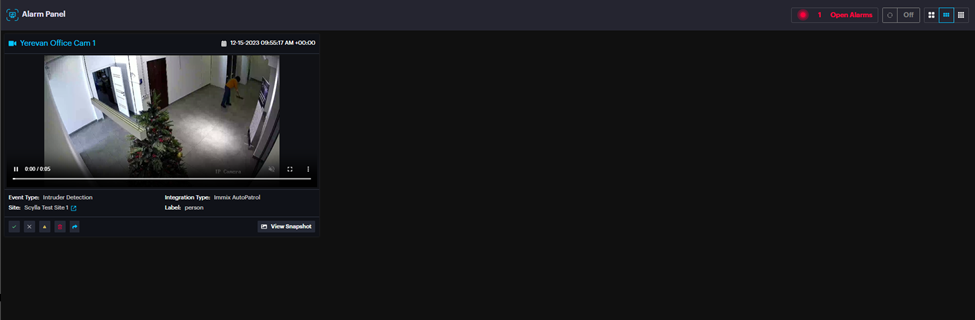
Alarm Panel
![]()
History
Click on the History button to open the Browse Alarms History page but without having a specific site’s alarms history preselected in the Quick Filters menu.
Scylla Security Suite
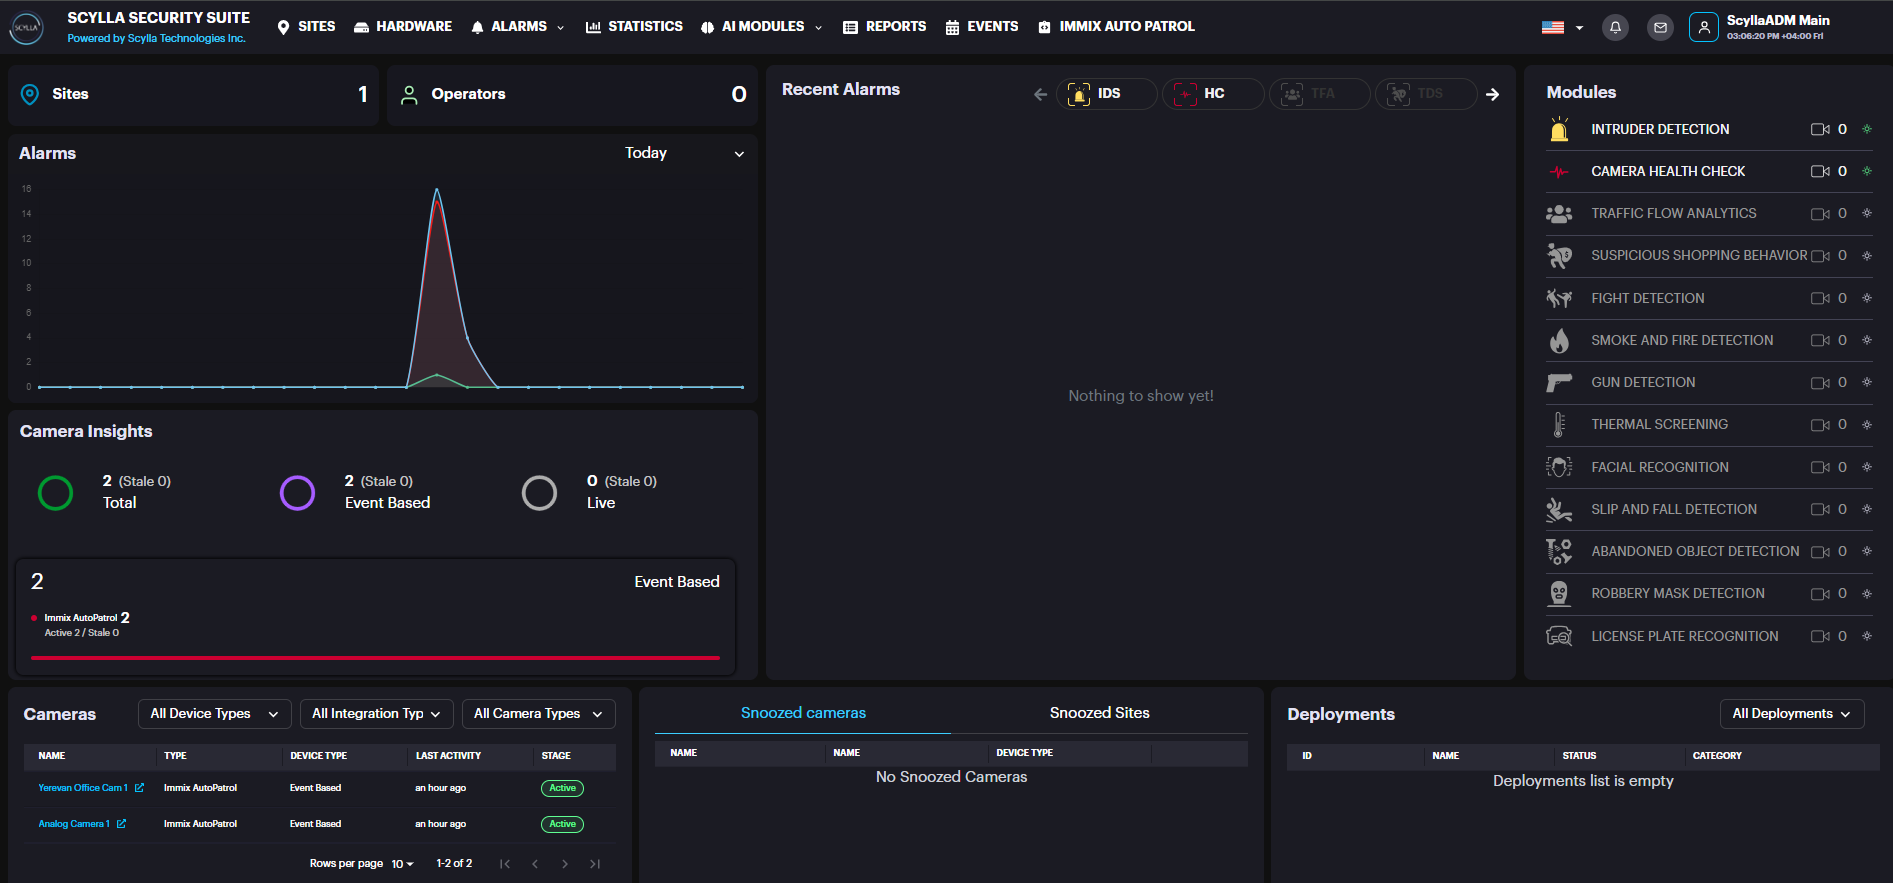
Home Page
On the Home page you can see general information, such as the total number of connected cameras, running engines, and if you are connected to Scylla RTM (Scylla server is up and running).
On the Modules right window, you can see all connected modules.
You can click on the module that is active and has connected cameras to open its Toolbar page.
On the Cameras lover left window you can see the list of all connected cameras listed by Type, Device Type, Last Activity and Stage, above you also can filter them by Device Type, Integration Type and Camera Type.
![]()
You can click on the alarm to open the Browse Alarms History page of the specific camera. On the Top-right side under the username you can see the time with time zone, also you can add time zone per site, so if you have a company with multiple sites and each site in a time zone, you can manage it.
Sites
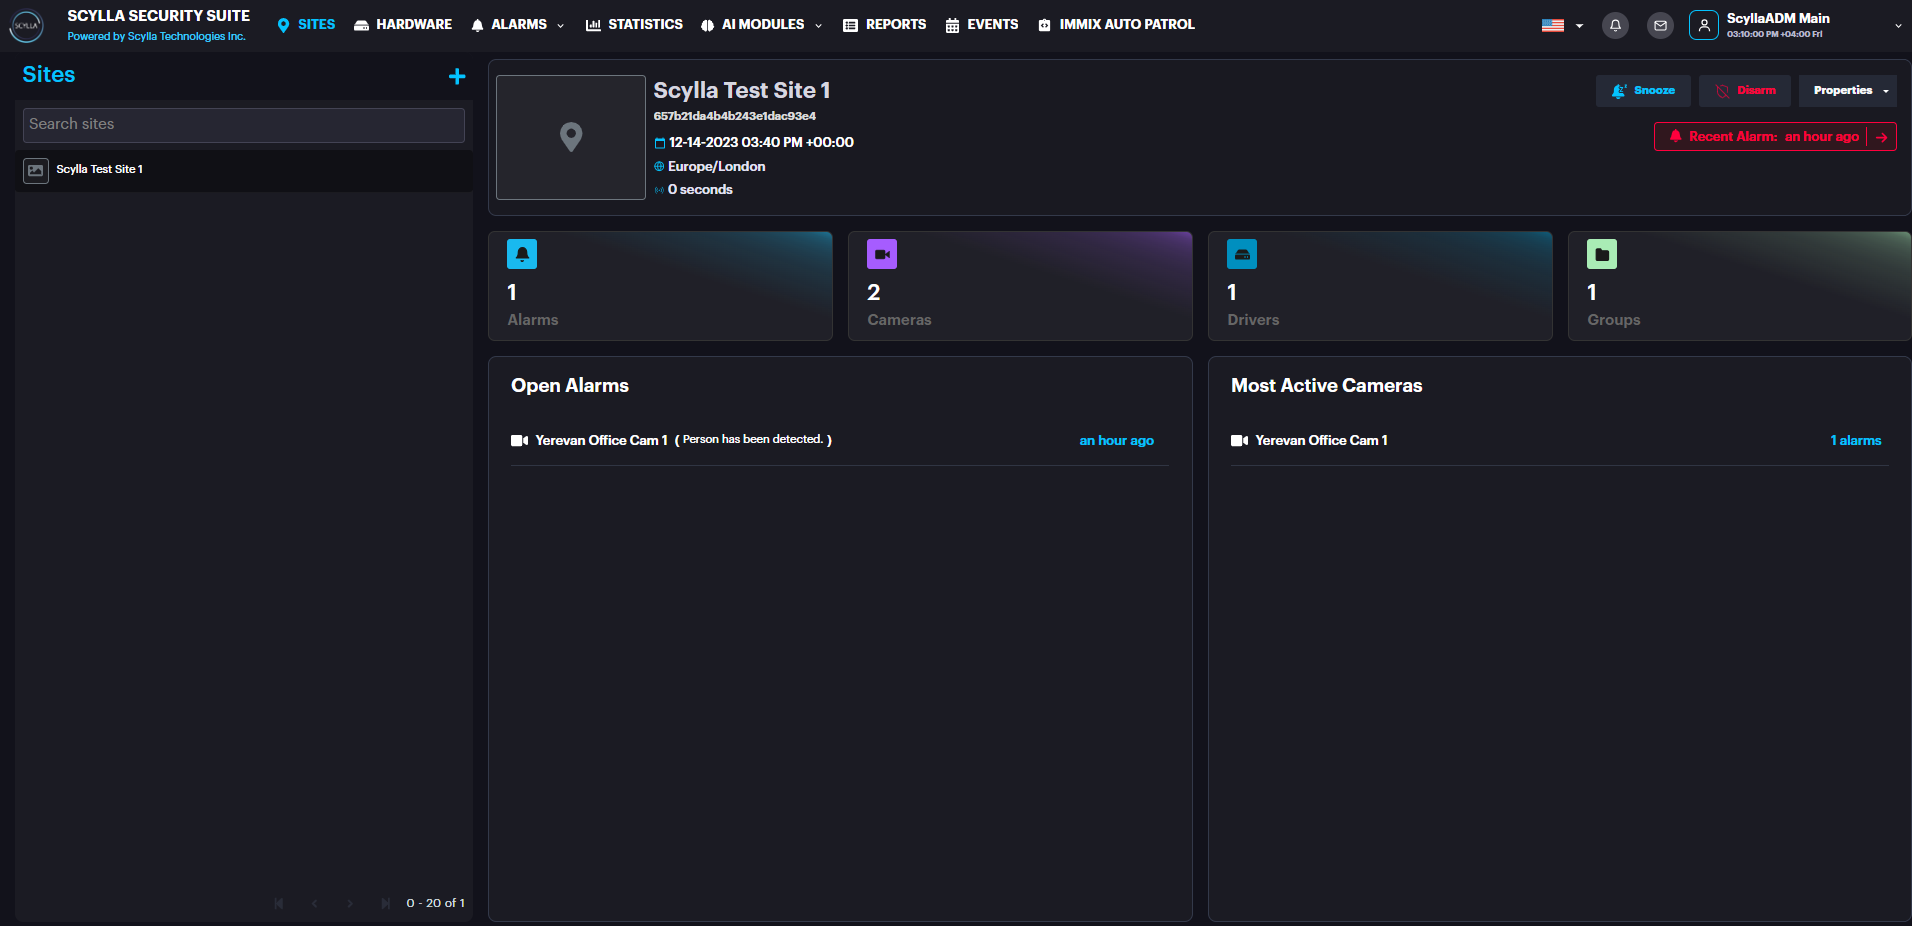
On the Sites page you can see the list of sites on the left side.
Select the desired site to see the following stats and options:
- Site name and creation date
- Recent alarm — info about the most recent alarm (in red message)
- Snooze — select the type of alarm notification’s snooze action and the duration
- View Schedule- Info about the schedule of the selected site
- Disarm — disarm the detections from selected Site by specified duration or disarm/arm manually
- Alarms — number of recent alarms
- Cameras — number of connected cameras
- Drivers- number of drivers
- Groups — number of groups
- Open Alarms — window containing the most recent alarms. Click on the specific alarm to see the detailed information only for this alarm occurrence.
- Properties window:
- Browse Alarms — opens the Browse Alarms History page with all alarms for this specific site
- Statistics — opens the Statistics page for this specific site
- Reports — opens the Reports page for this specific site
- Manage Devices — opens the Manage Devices menu for this specific site
- Most Active Cameras — list of most active cameras and a total number of their alarms. Click on the camera to see its detailed information and settings from the Hardware menu Site name and creation date
Recent alarm — info about the most recent alarm (in red message)
Snooze — select the type of alarm notification’s snooze action and the duration
View Schedule- Info about the schedule of the selected site
Disarm — disarm the detections from selected Site by specified duration or disarm/arm manually
Alarms — number of recent alarms
Cameras — number of connected cameras
Drivers- number of drivers
Groups — number of groups
Open Alarms — window containing the most recent alarms. Click on the specific alarm to see the detailed information only for this alarm occurrence.
Properties window:
- Browse Alarms — opens the Browse Alarms History page with all alarms for this specific site
- Statistics — opens the Statistics page for this specific site
- Reports — opens the Reports page for this specific site
- Manage Devices — opens the Manage Devices menu for this specific site Browse Alarms — opens the Browse Alarms History page with all alarms for this specific site
Statistics — opens the Statistics page for this specific site
Reports — opens the Reports page for this specific site
Manage Devices — opens the Manage Devices menu for this specific site
Most Active Cameras — list of most active cameras and a total number of their alarms. Click on the camera to see its detailed information and settings from the Hardware menu
To create a new site, click the Add new site button.

Then, in the Site Create pop-up menu specify the Name, Address, Time Zone, and Description, Upload photo if needed and Click Submit.
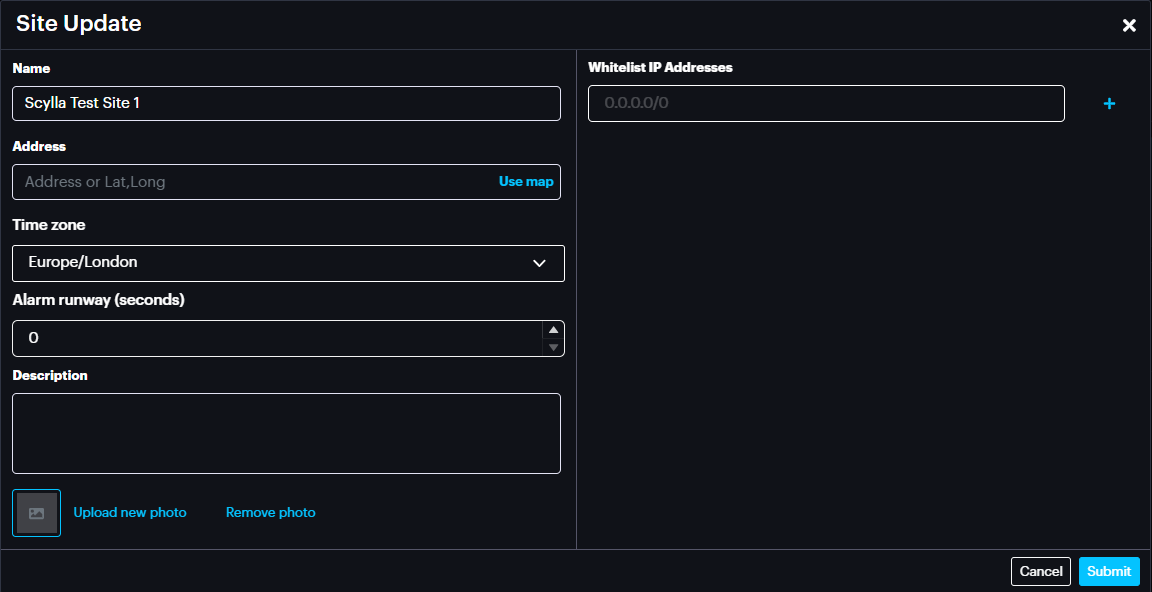
![]()
Enter the information into the corresponding fields and click Submit to save.
Manage Devices
On the Site page select the desired site, then click on Manage Devices on the Properties window.

You can also open the specific camera’s settings by clicking the camera in the Most Active Cameras window.
On the Manage Devices menu you can open the existing camera groups to see all cameras.
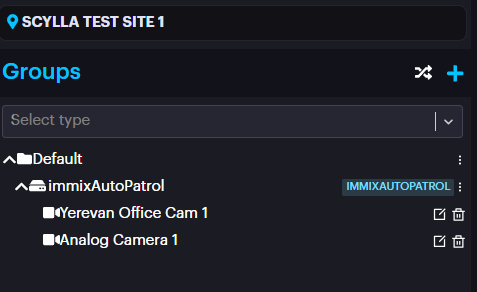
Create Group
![]()
In the opened Group Create pop-up specify the name for a new group and click Submit.

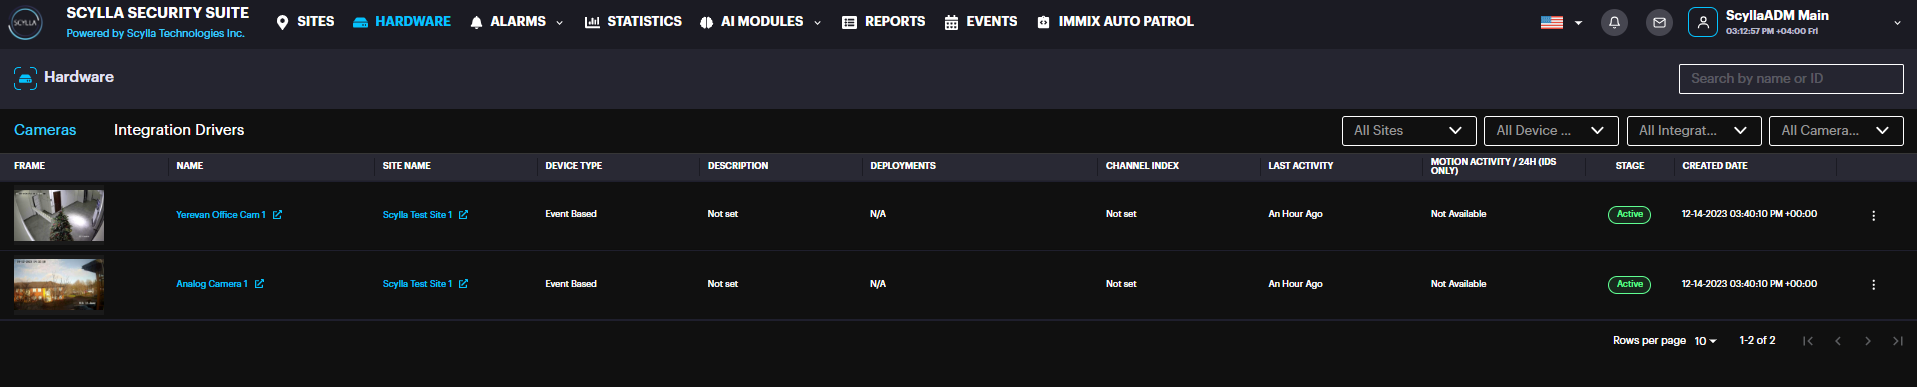
Hardware
On this page you can see the list of all connected Cameras and Integration Drivers, as well as sort Cameras by Sites, Device type, Integration type and Camera State, and sort Integration Drivers by Site and Device Type.
Each camera record has more option button (three dot).
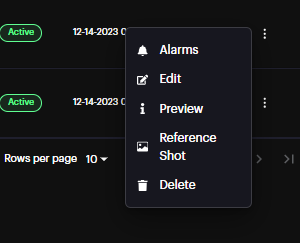
Alarms: Redirects to the Alarm History page displaying the alarms of this camera
Edit: Allows you to rename the camera.
Preview: Displays the camera frame and details
Reference Shot: Refreshes the camera frame in the camera row.
Delete: Deletes the camera
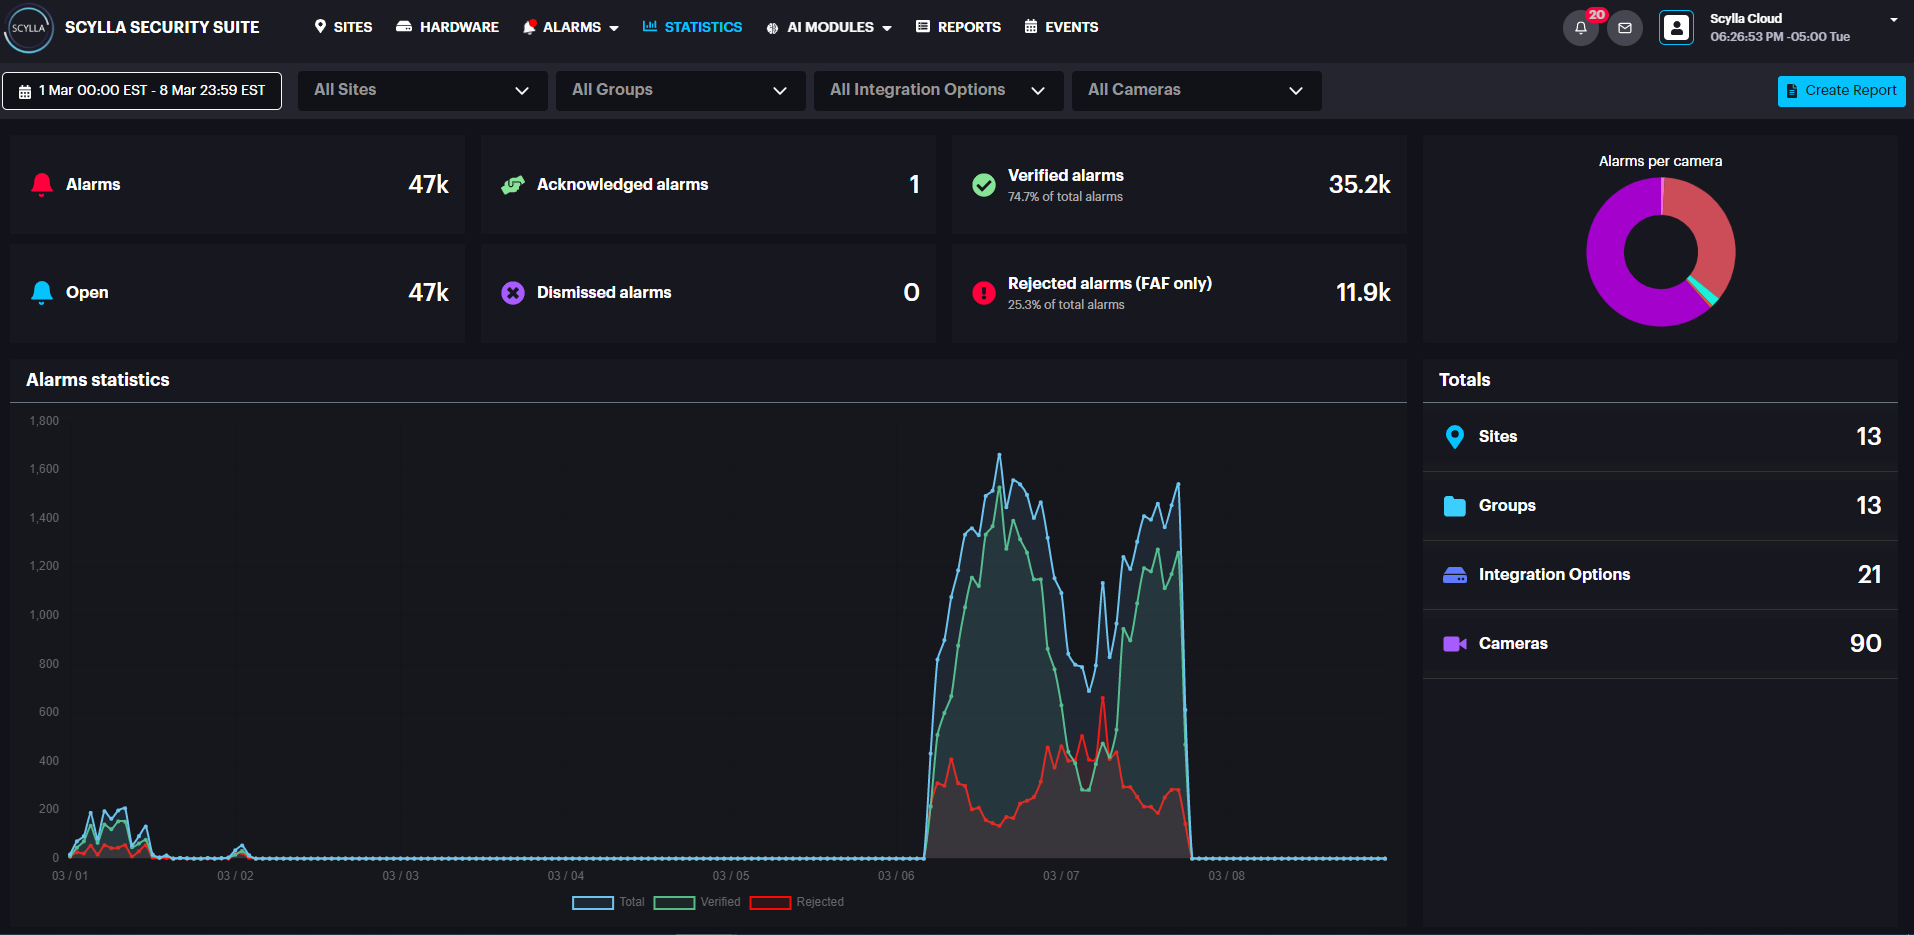
Statistics
On the Statistics page you can see the amount of:
- Confirmed alarms
- Rejected alarms
- Acknowledged alarms
- Dismissed alarms
- Alarms
- Open alarms Confirmed alarms
Rejected alarms
Acknowledged alarms
Dismissed alarms
Alarms
Open alarms
On Totals windows you can see the amount of
- Sites
- Groups
- Integration Options
- Cameras Sites
Groups
Integration Options
Cameras
You can also see the Alarms Per Camera ratio.
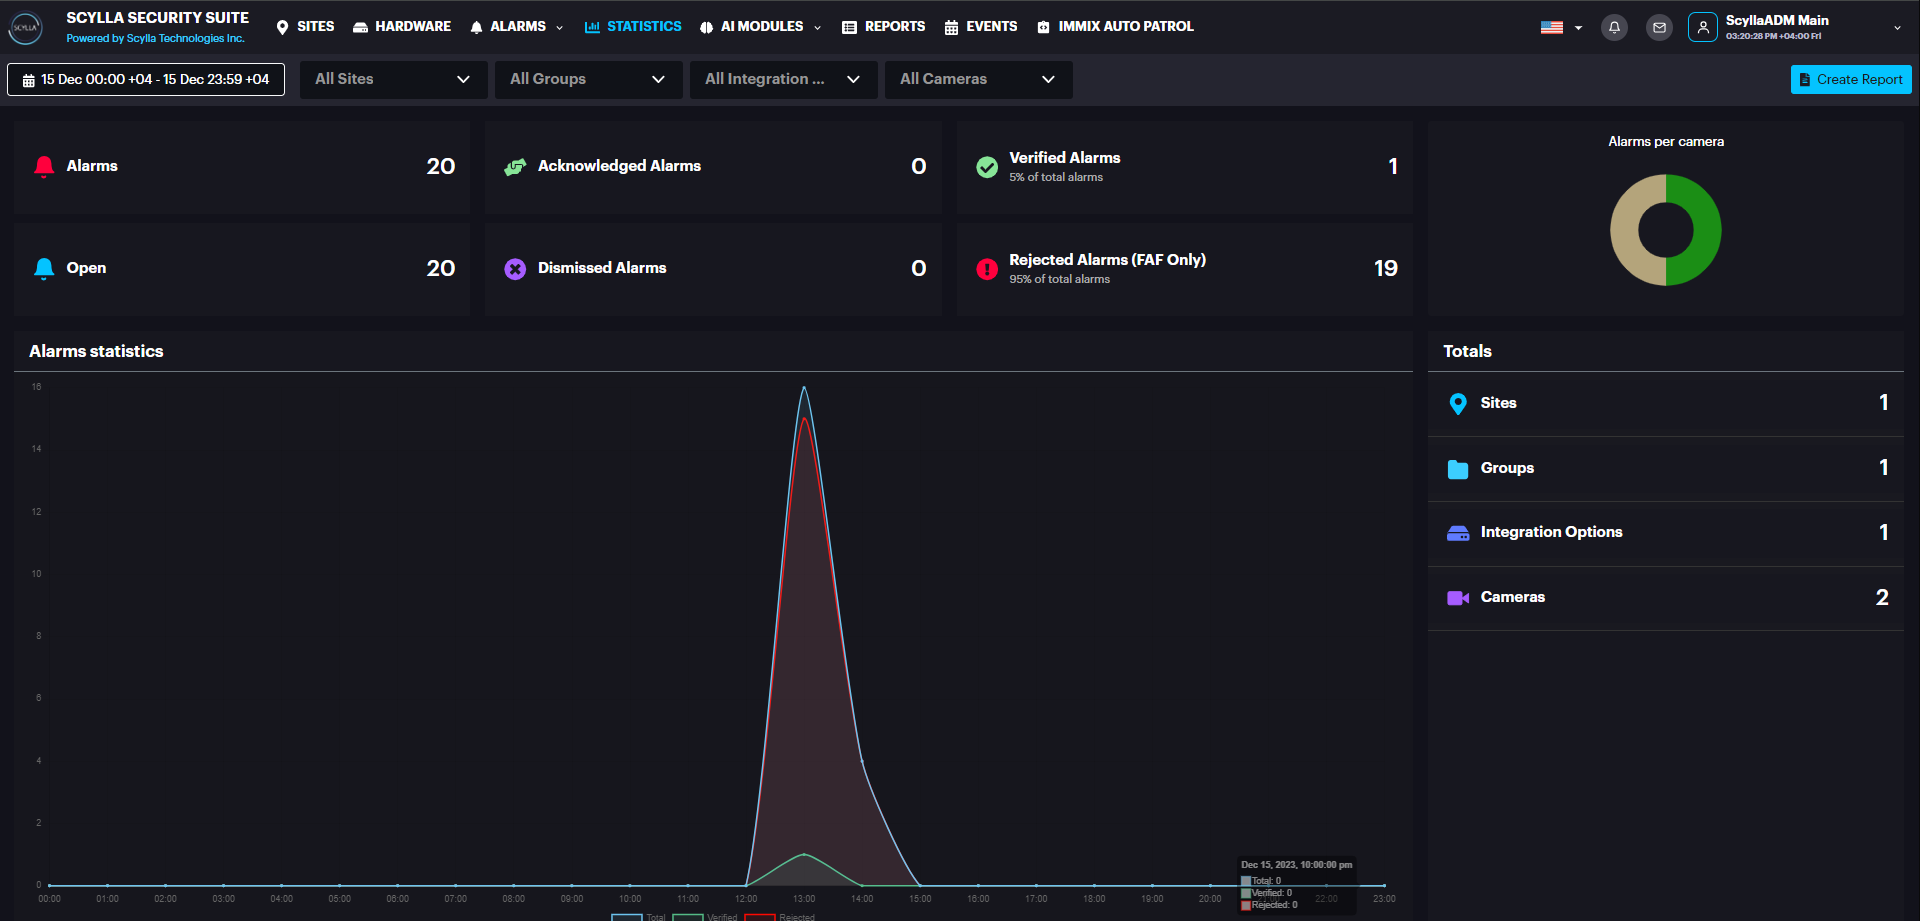
You can filter statistics by selecting a specific site, group, integration option, camera, and a time range (Today, Yesterday, This Week, Last Week, This Month, Last Month) or specify a Custom time range.
Graph displays a total number of alarms (blue), number of confirmed alarms (green), and number of rejected alarms (red).
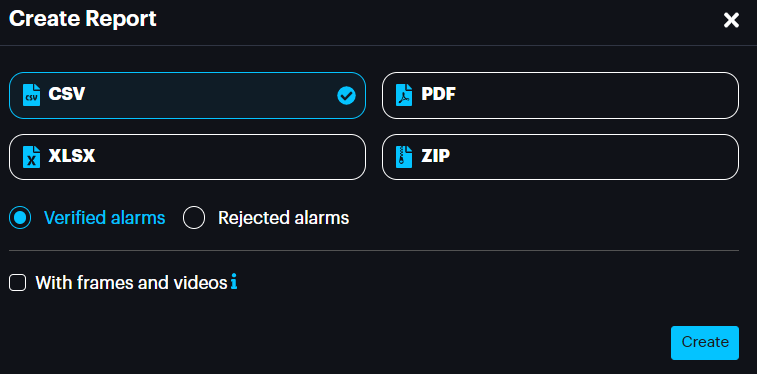
Reports
Then, in the Create Report pop-up menu, select the desired report format (CSV, XLSX, PDF, or ZIP).
Select the with frames and videos checkbox if you want to have alert frames and videos of detection occurrences in addition to the report file.
Select either the Rejected alarms or Verified alarms radio button if you want to have rejected alarms or confirmed alarms in addition to the report file.
Click Create.
After the report was created successfully, click Check Reports.

Or go to the Reports page. Here you can see all your generated reports.
You can filter your reports by Type (format: JSON, XLSX, CSV, PDF), Date/Time, Status (Processing, Done, or Failed), and sort by presence of absence of alert frames of detection occurrences and rejected alerts.
![]()
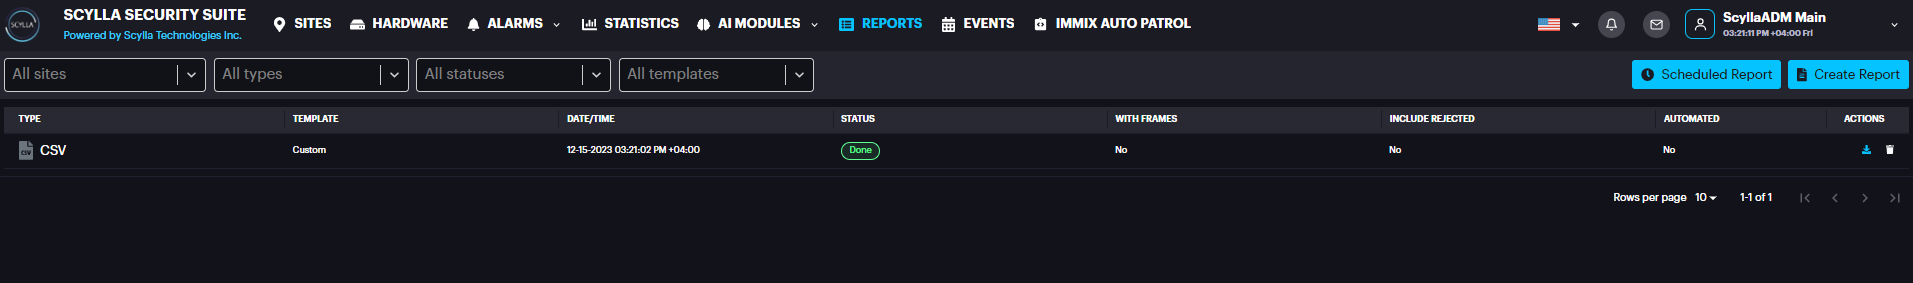
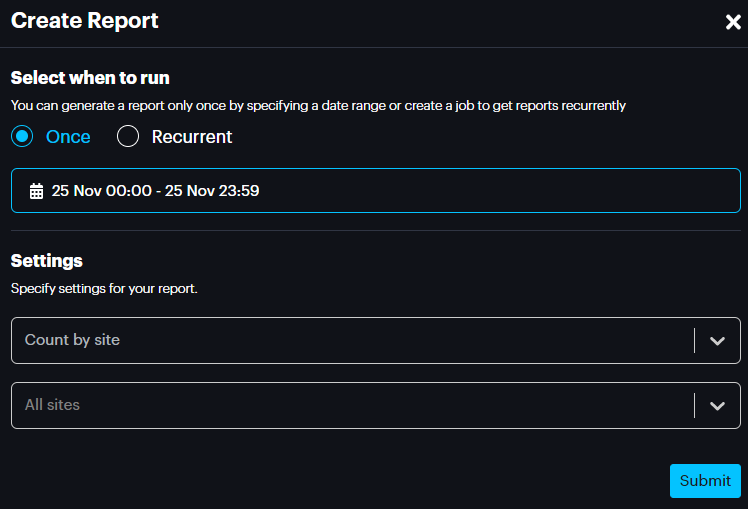
You can also create a report from this page by clicking the Create Report button.
On the Create Report pop-up select the report generation type (once or recurrently), desired date or a period specify settings for your report and click Submit
![]()
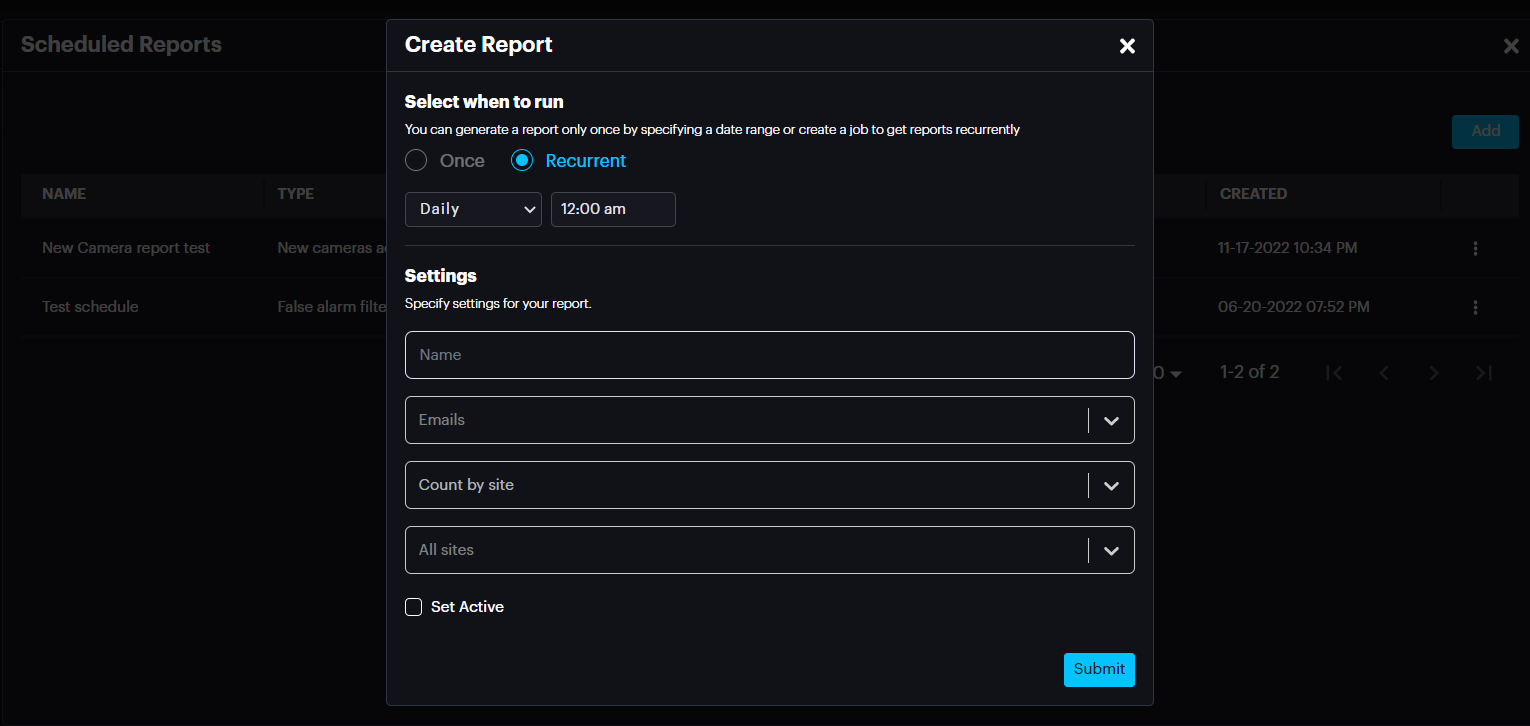
You can also check for the scheduled reports and add a new one by clicking the Scheduled Reports button.
On the Scheduled Reports pop-up click on Add button, then on Create Report page select the report generation type (once or recurrently), settings for your report and click Submit
Profile
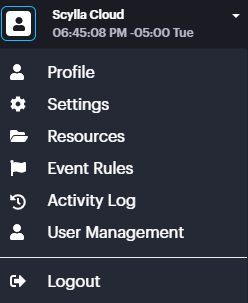
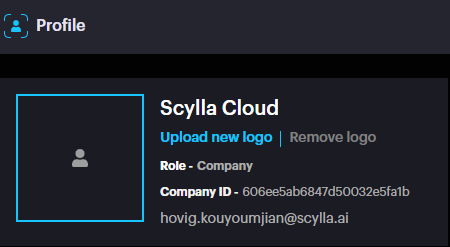
To open the Profile page, click on the username and click Profile.
The Profile page displays the logged in Username, Role and Company ID.
Settings
To open the Settings page, click on the username and click Settings.
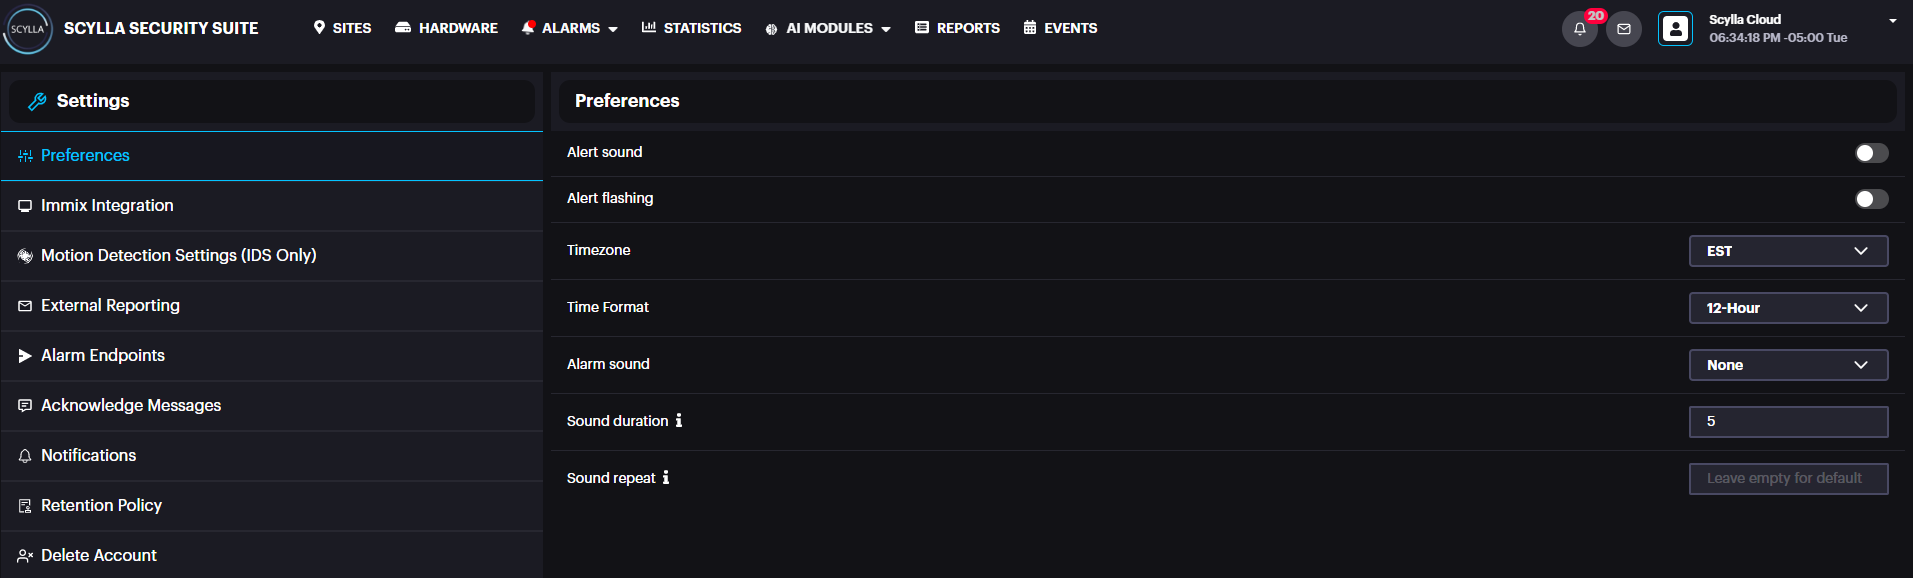
Select Immix Integration section if you need to set up Immix Plugin integration. Select Motion Detection Settings (IDS only) section if you want to enable sensitive motion detection mode for all cameras from all sites.
In case you would like to add an additional email account to receive external reports, you can select the External Reporting section.
Click on Alarm endpoints section if you want to check existing endpoints or add new one or edit/delete existing one.
Select Notification section to see the important notifications about your cloud dashboard, here you can also schedule the time for notifications.
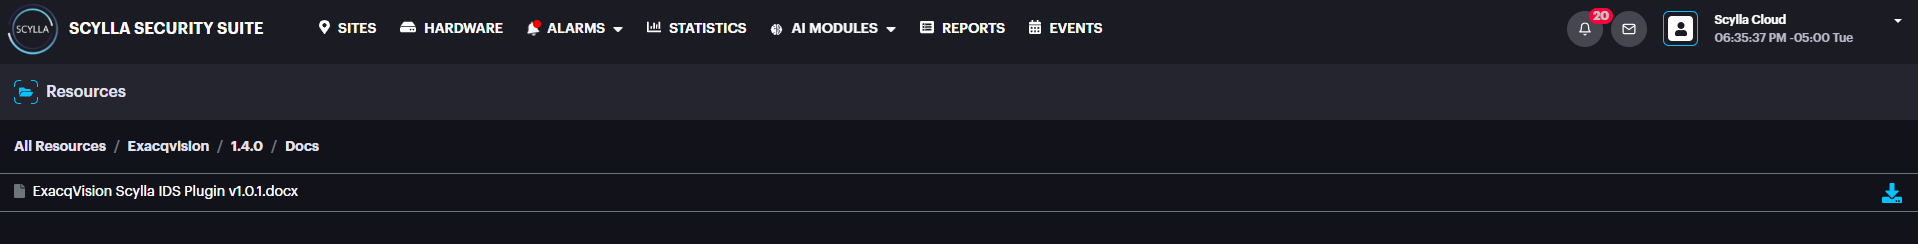
Resources
To open the Resources page, click on the username and click Resources.
On the Resources page you can find manuals and other important resources for better understanding and easier use of the Scylla Security Suite.
![]()
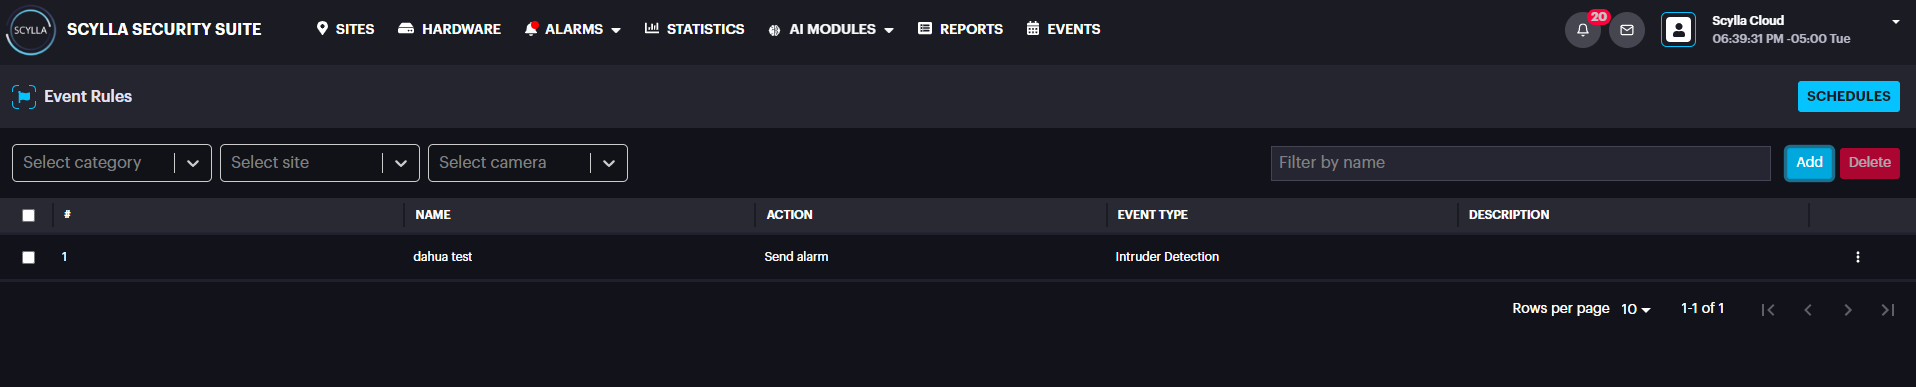
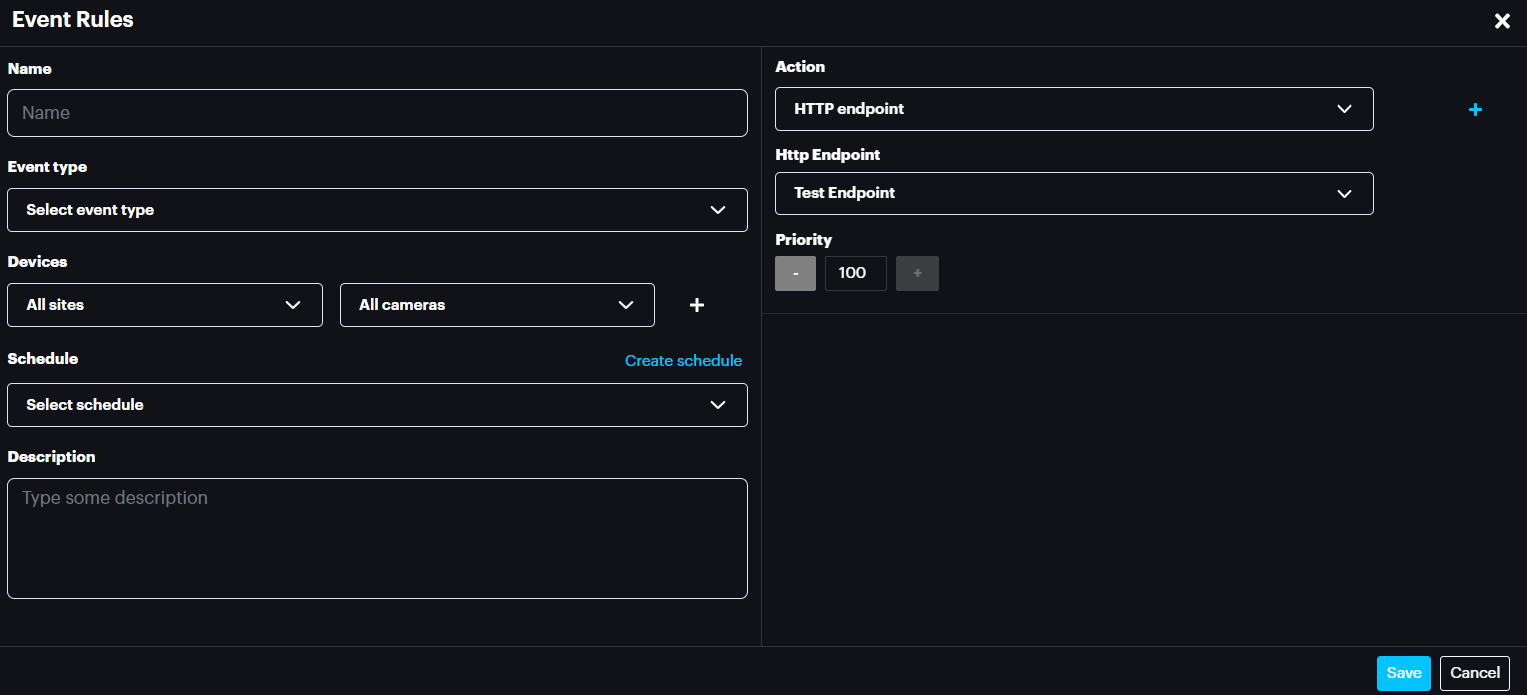
Event Rules
To open the Even Rules page, click on the username and click Event Rules.
On the Event Rules page, you can create a schedule, as well as event rules, where you can Name them, specify them with Integration types, sites, cameras and
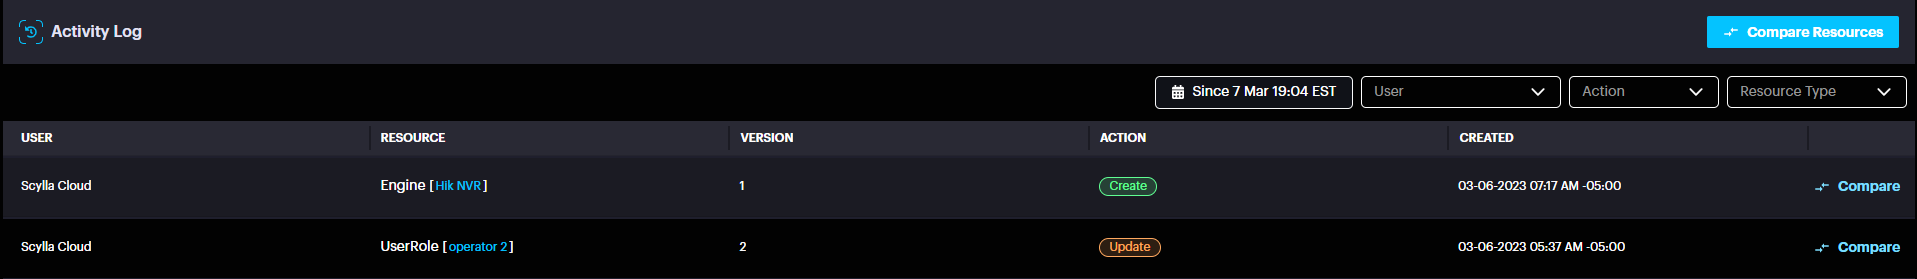
Activity Log
In this page you can follow up for the last activities (create, update, delete) on dashboard made by Users
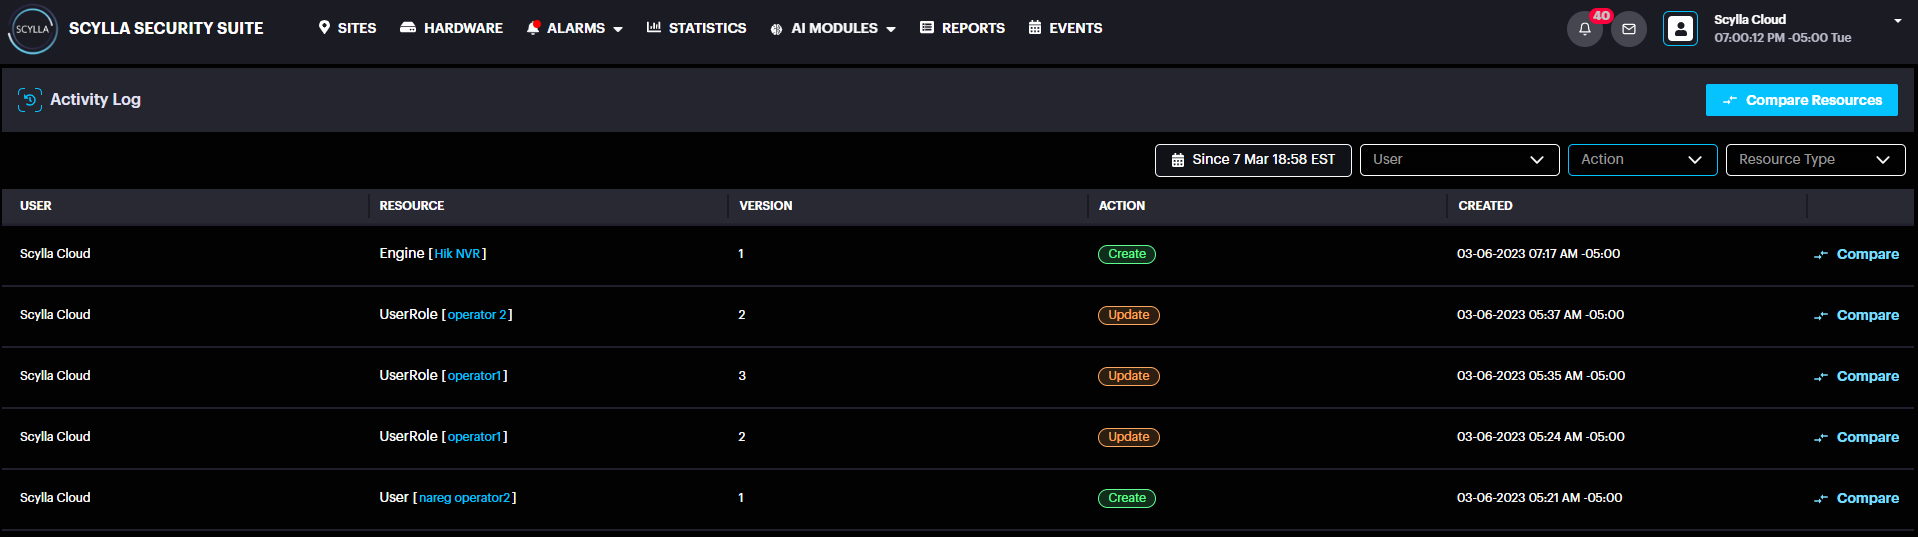
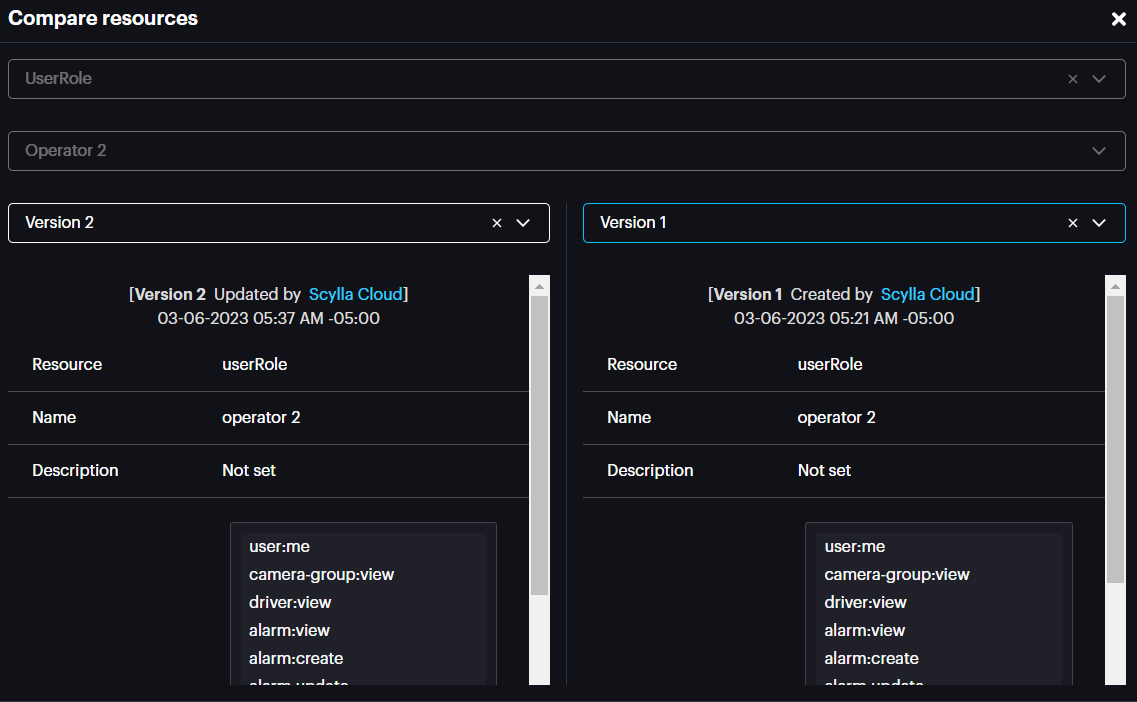
You’re also can compare the versions, after an update just by clicking to compare button and choosing the versions that needs to be compared.
User Management
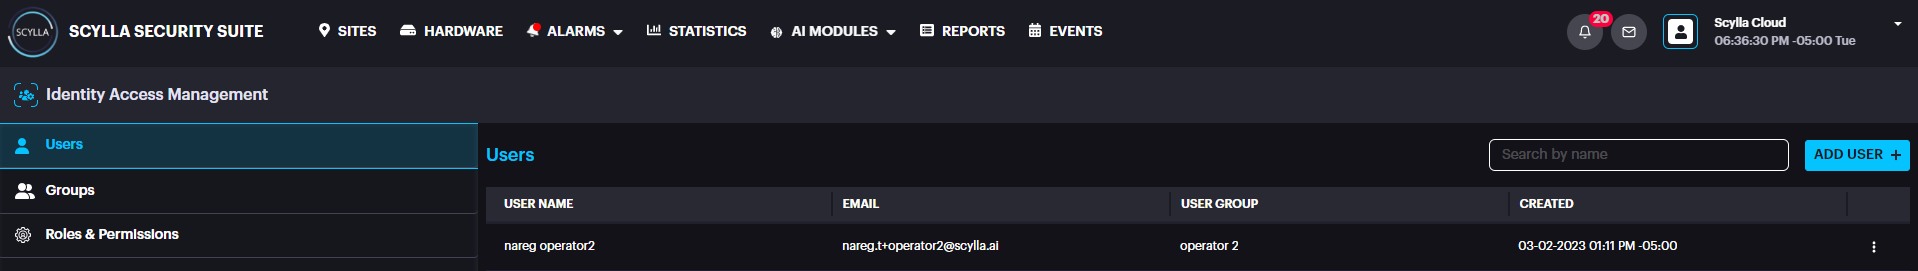
Users
Users subsection allows to add, delete, or edit users.
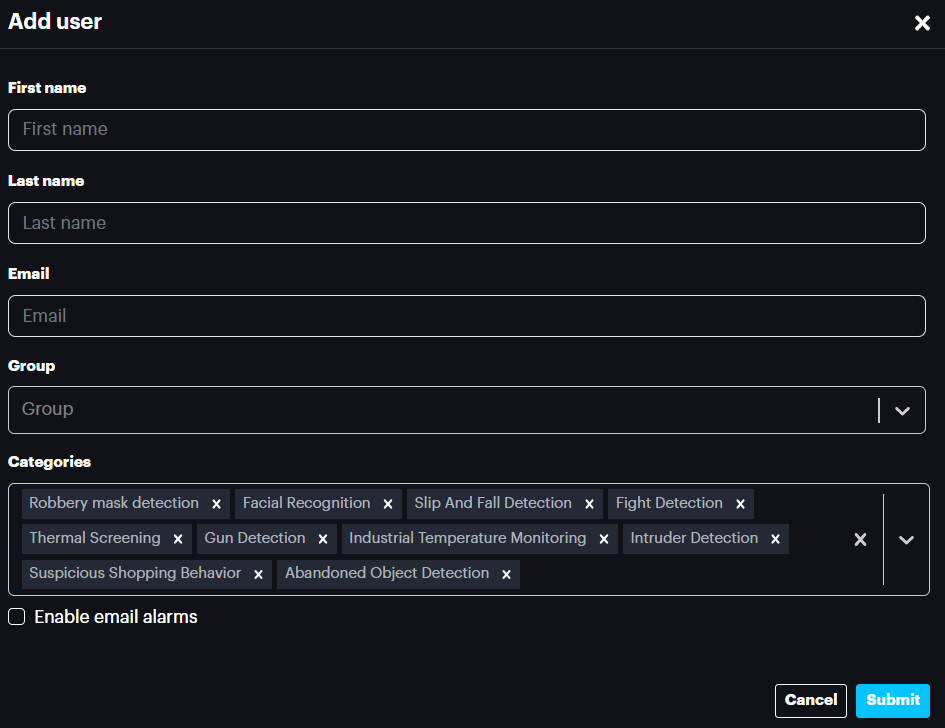
To add a new user, click on the Add User button.
On the Add User popup menu enter the First Name, Last Name, Email, and select the Group, and Categories of Scylla modules for the user. Select the Enable email alarms if you want this user to receive alarms via email too. Click Submit.
To edit an existing user, go to More Options→ Edit.

And edit the information in the popup menu.
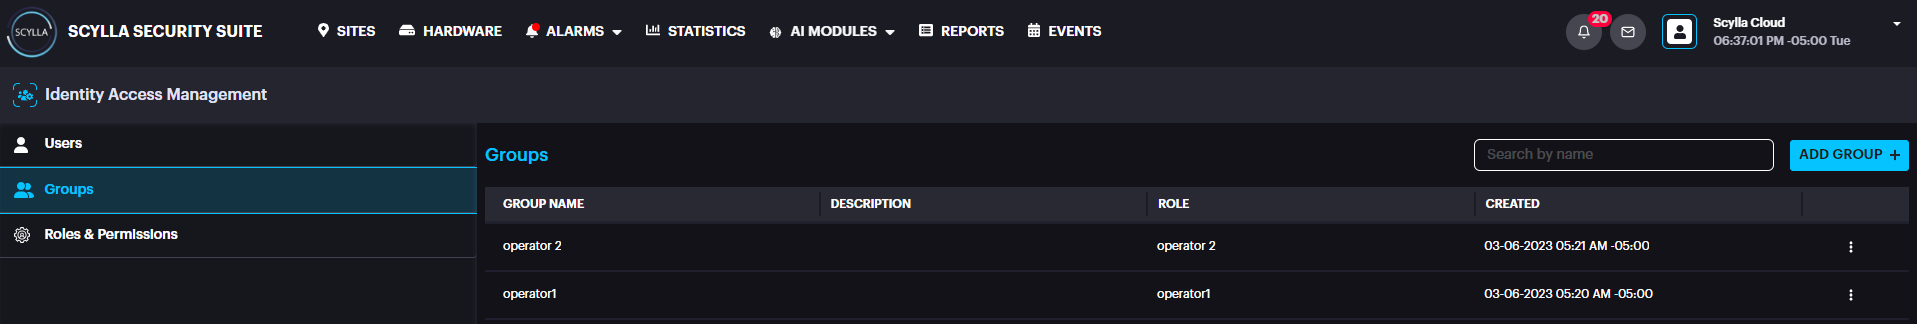
Groups
Groups subsection allows to add, delete, or edit groups.
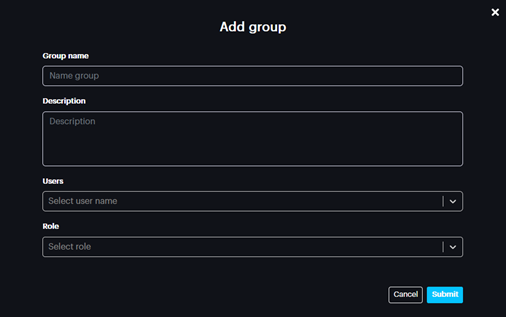
To add a new group, click on the Add Group button.
On the Add group popup menu enter the Group Name, Description, and select the Users who will be included in this group, and Roles. Click Submit.
To edit an existing group, go to More Options→ Edit.

And edit the information in the popup menu.
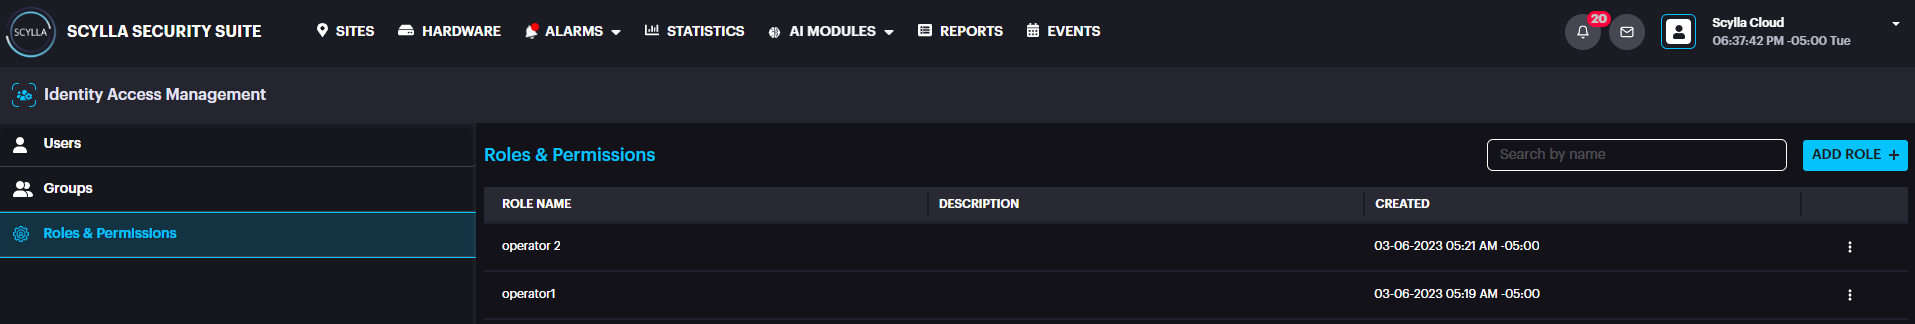
Roles
Roles subsection allows to add, delete, or edit roles.
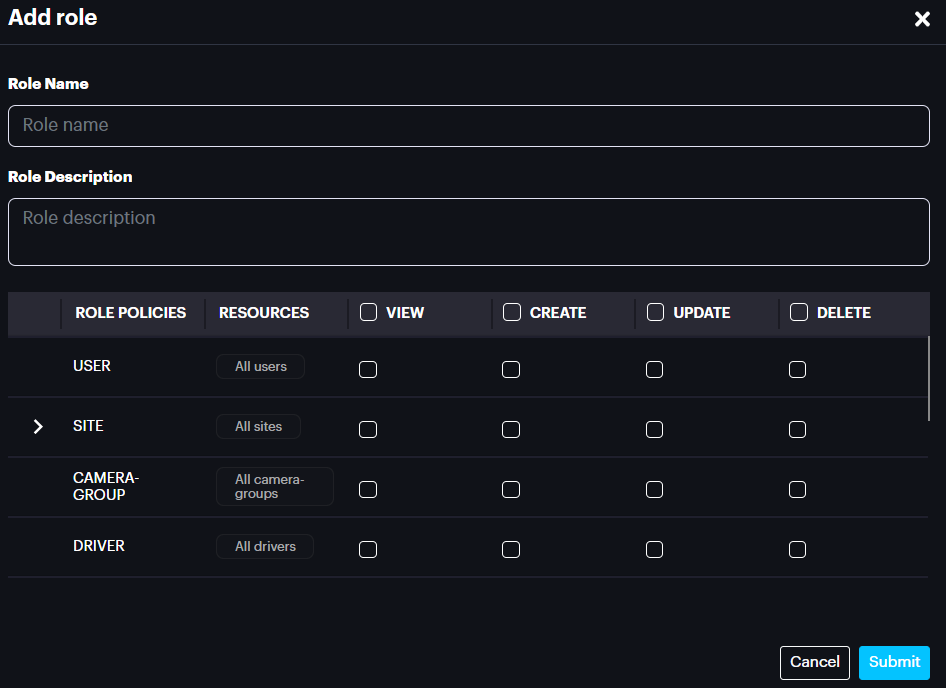
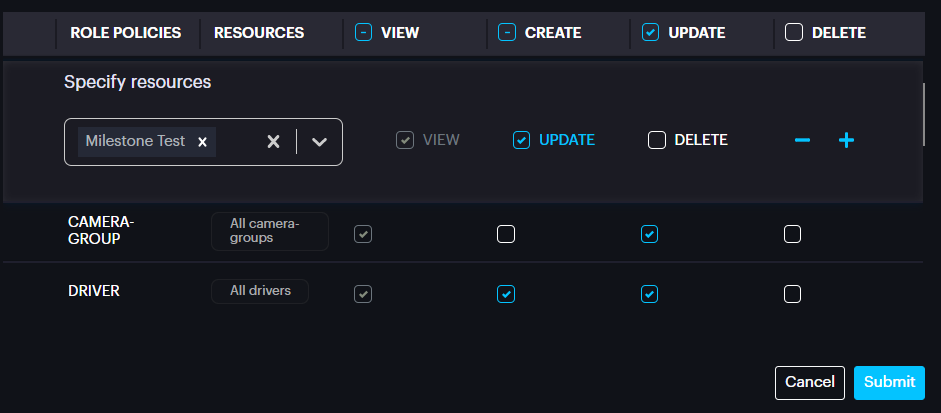
To add a new role, click on the Add Role button.
On the Add role popup menu enter the Role Name and Role Description.
Then assign abilities to View, Create, Update, and Delete to different users for specific policies by selecting the corresponding checkbox.
![]()
Click Submit.
To edit an existing role, go to More Options→ Edit.

And edit the information in the popup menu
Logout
To log out from your user account, click on the username and click Logout.
We value and appreciate your feedback. If you have any questions or suggestions, please contact support@scylla.ai or submit a request to the Scylla Help Center at https://support.scylla.ai/portal/en/home.