User Manual
Introduction
This guide provides a general overview of the cloud dashboard and its possibilities (as implemented during the time of this document’s release).
Login to Scylla Dashboard
To use Scylla Security Suite, you first need to login to the dashboard.
Dashboard is publicly accessible by the following URL: https://dashboard.scylla.ai/login.
If you are already logged in, you will be redirected to the main Dashboard page.
If you are not logged in, you need to enter your Email and Password into the corresponding fields and click the Login button.
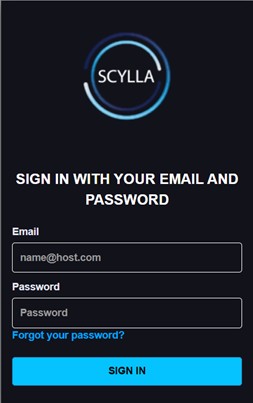
| **NOTE.**Please be attentive while entering your username and password into the fields. Make sure you have not copied any additional characters. |
|---|
After entering your credentials and clicking the Login button you will be redirected to the Dashboard page.
If you see the “Incorrect username or password” message, that means you have entered wrong credentials.
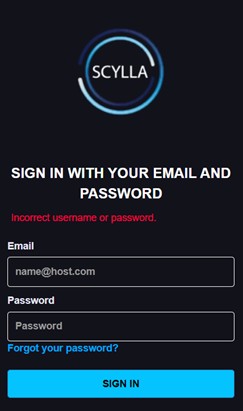
Double-check and reenter your credentials. If this message appears again, contact your administrator, or reset your password. See the Reset Password section for more instructions.
If you are not able to log in and there is no message, try to clean your browser’s cache and try again. See this article for detailed instructions on how to clean your browser’s cache.
If cleaning the cache does not solve the problem, you are always welcome to submit a request on the Help Center.
Reset Password
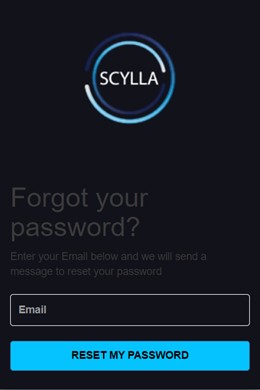
To reset your password, click the Forgot your password? button on the Login page.
Then enter your email and click on Reset my password button to receive your reset code.
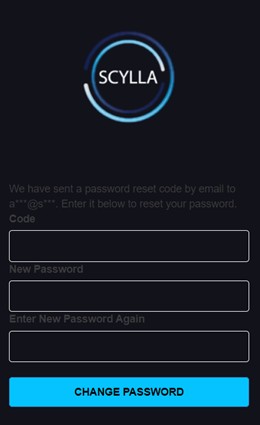
Then fill all fields with the required information and click the CHANGE PASSWORD button.
Scylla Security Suite
Home Page
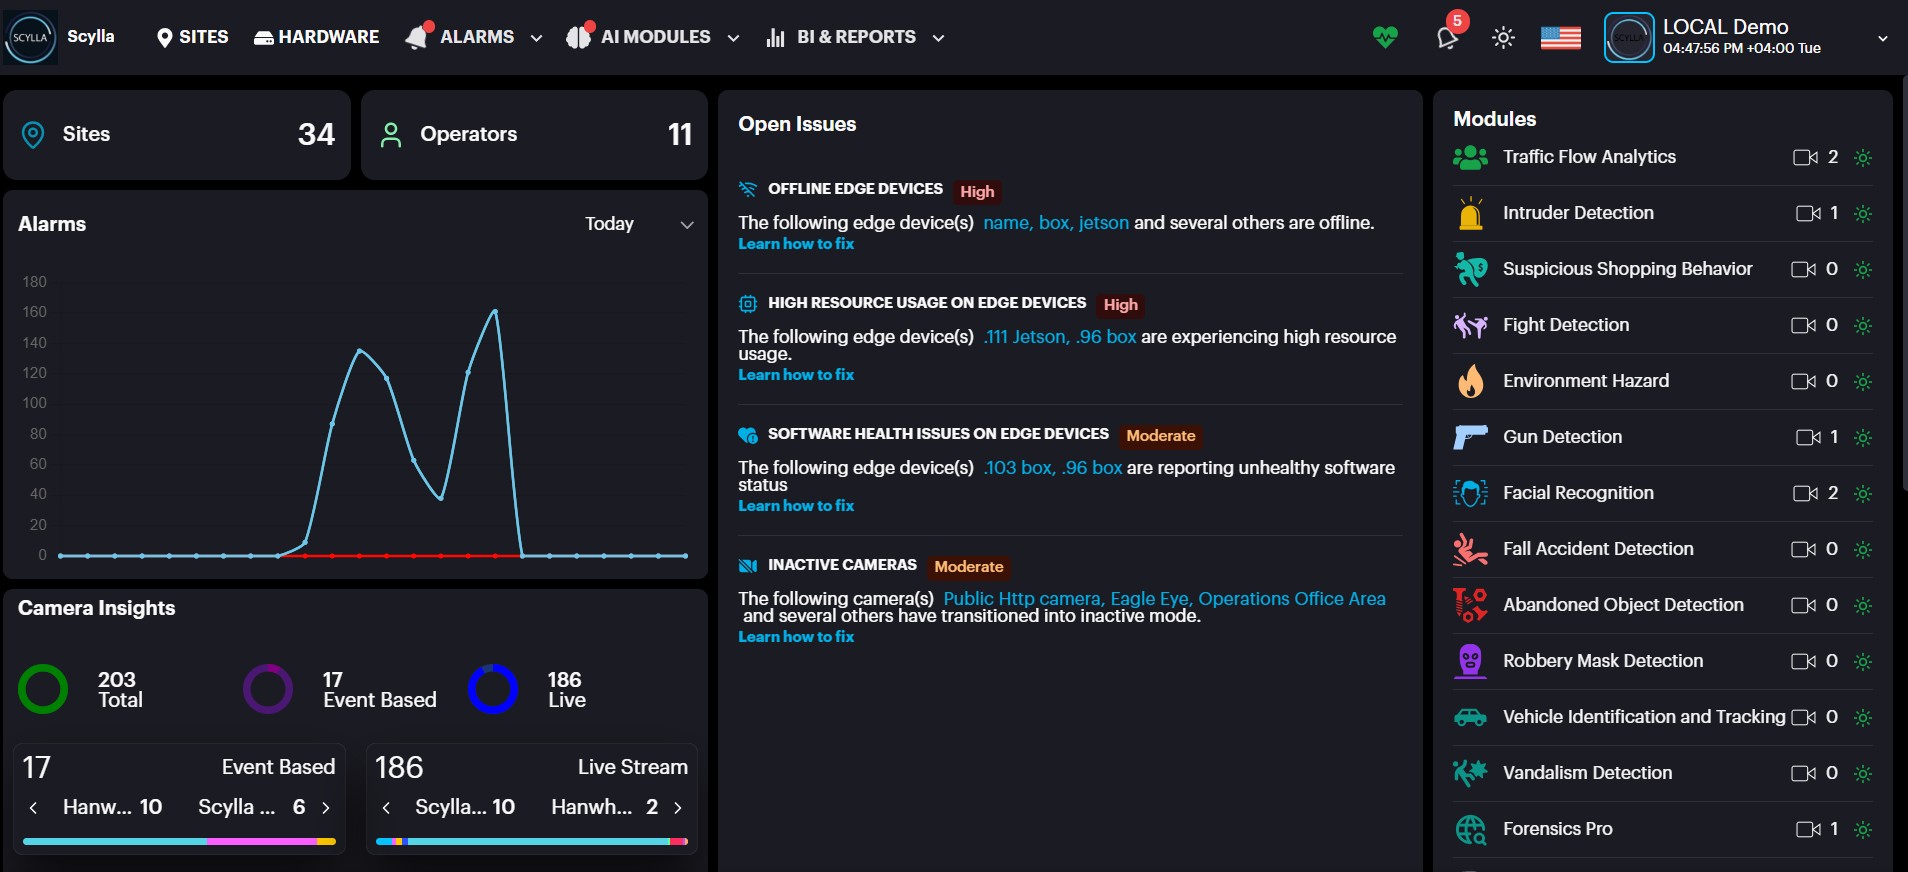
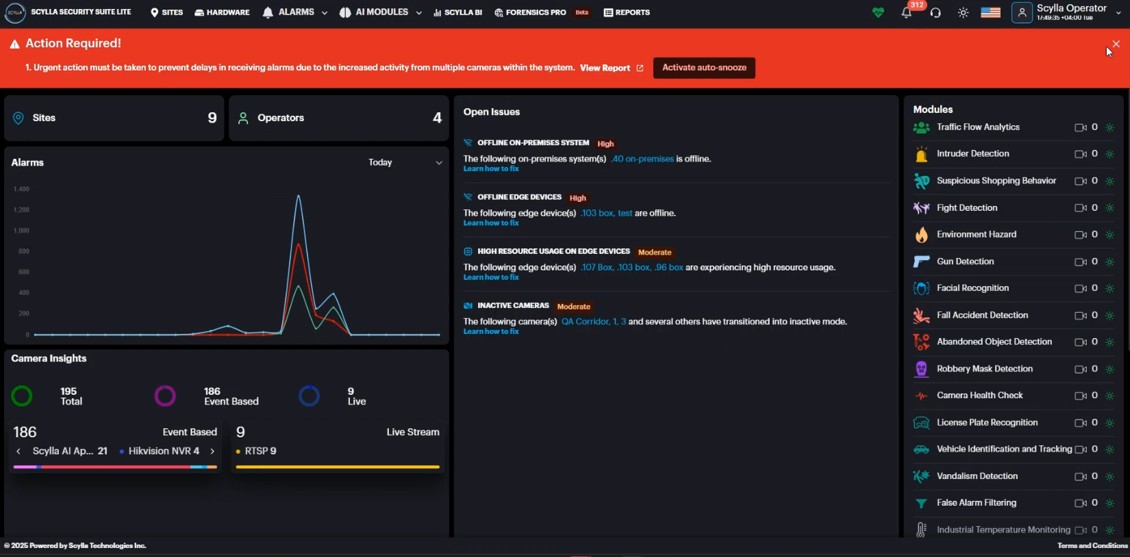
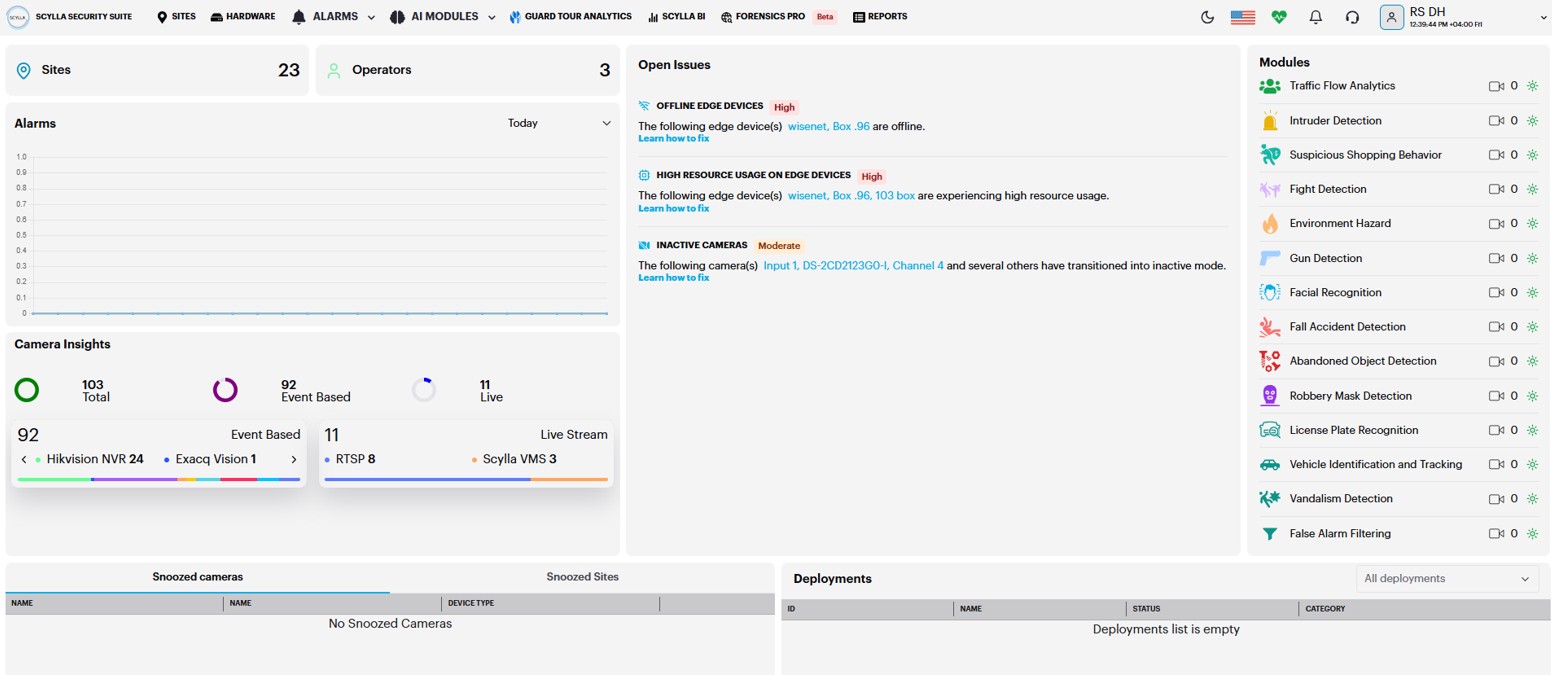
On the Home page you can see general information, such as the total number of connected cameras, running engines, recent alarms, active modules, and deployments.
In the Modules right window, you can see all connected modules.
You can click on the module that is active and has connected cameras to open its Toolbar page.
In the Open Issues middle window, you can see issues related to deployment , camera , edge device and software health that may impact the normal operation of the system.
Clicking on the issue will take you to the corresponding page for further investigation.
In the Snoozed bottom window, you can check the Snoozed cameras and Snoozed sites if any.
In the Deployments bottom right window you can view the active deployments with their info (ID, status, AI module).
On the Top-right side under the username you can see the time with timezone, also you can add timezone per site, so if you have a company with multiple sites and each site in a timezone , you can manage it.
Incident Widget
Open Issues provides users with notifications about all open issues that may impact the normal operation of the system. This ensures users are promptly alerted to potential problems.
Each issue displayed includes:
- Severity Level
- Description
- Steps to Resolve
Types of Issues Covered:
- Failed Deployments
- Stale Cameras
- Deployment Health Issues
- Offline On-Prem Systems
- High Resource Usage on Edge Devices
- Software Health Issues on Edge Devices
- Software Issues on Remote On-Premise Instances
Note: Users can configure the Inactive Camera issue threshold (number of days) via the settings -> Preferences page. Once the defined threshold is exceeded, the issue will appear in the Incident Widget.
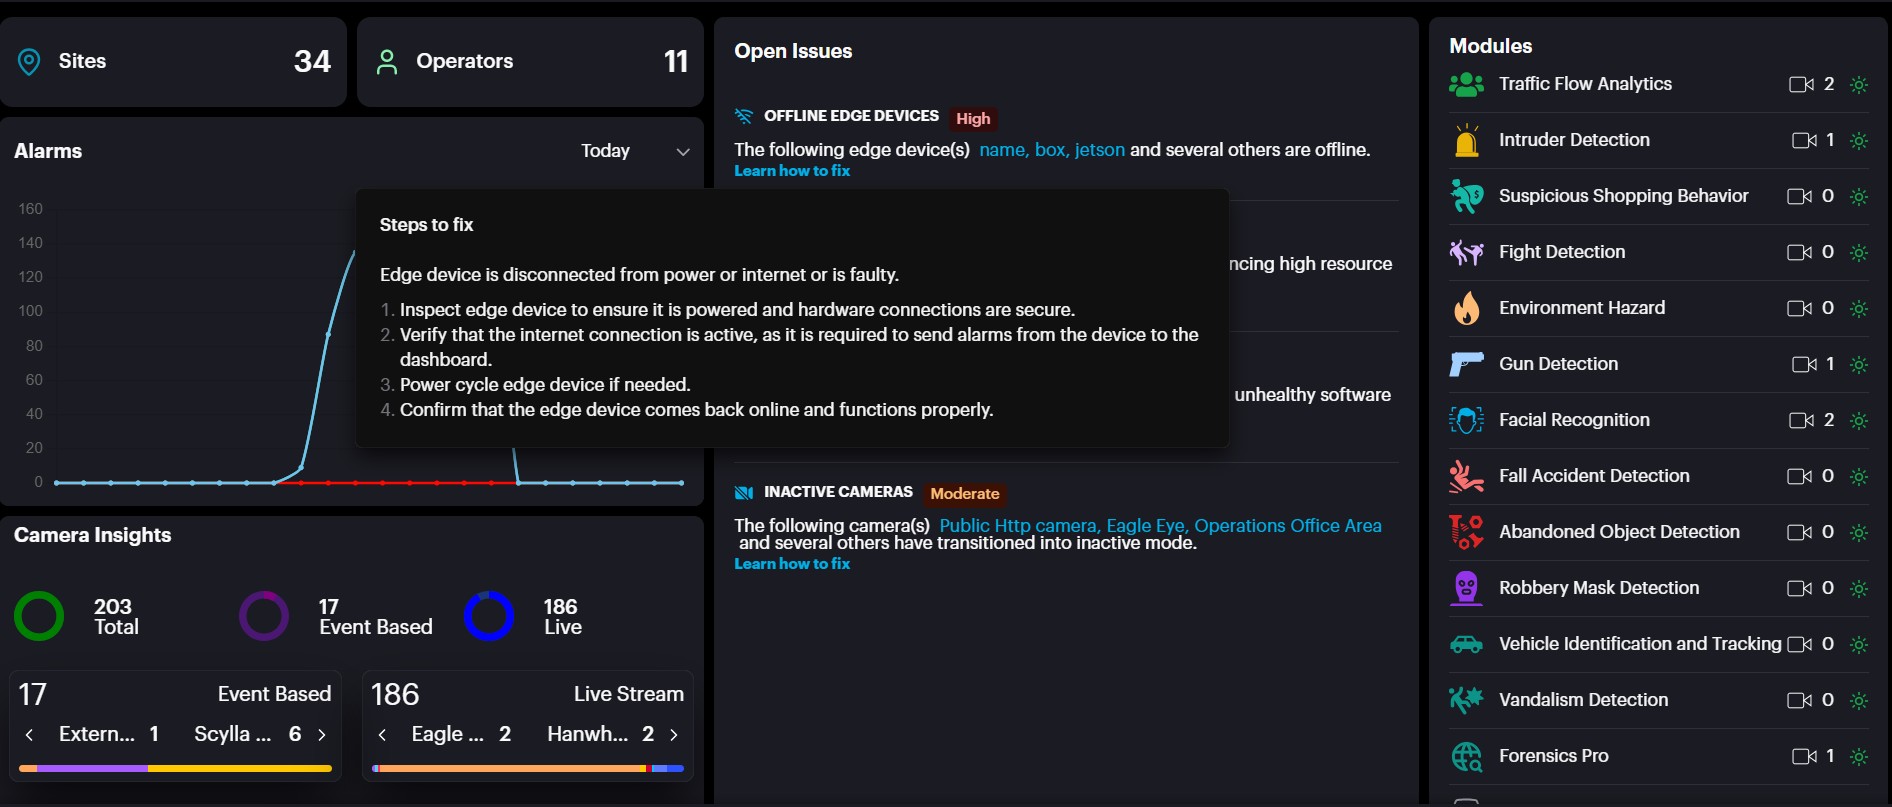
In the above example, let’s consider the first issue, Offline Edge Devices.
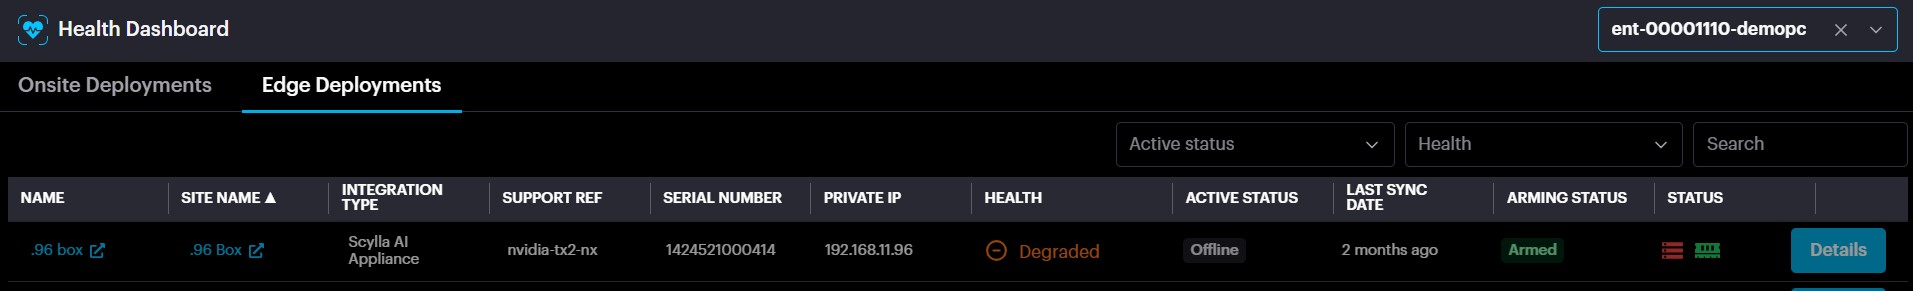
Clicking on Learn how to fix provides detailed steps to resolve the issue. Additionally, clicking on the box name redirects you to the Health Dashboard → Edge Deployments, where you can view the last sync time of the Asteria box with the cloud.
All notifications are stateful, meaning the system keeps a history of past events. You can review your recent notifications at any time from the notification menu.
- To view recent events, simply click on the notification icon.
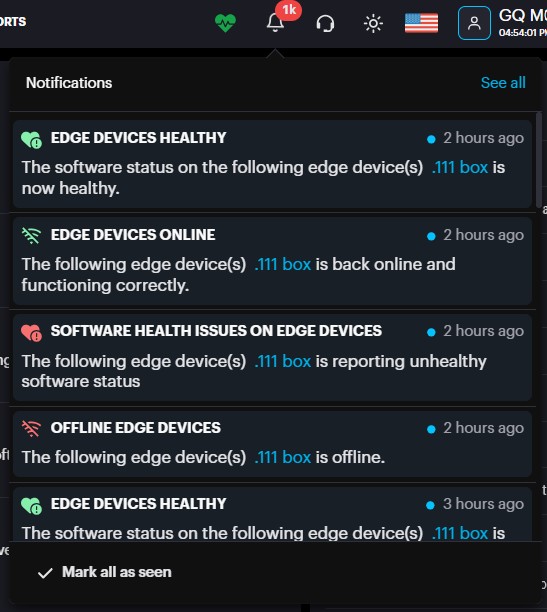
- To see your full notification history, click on See All. This will take you to the Notifications page.
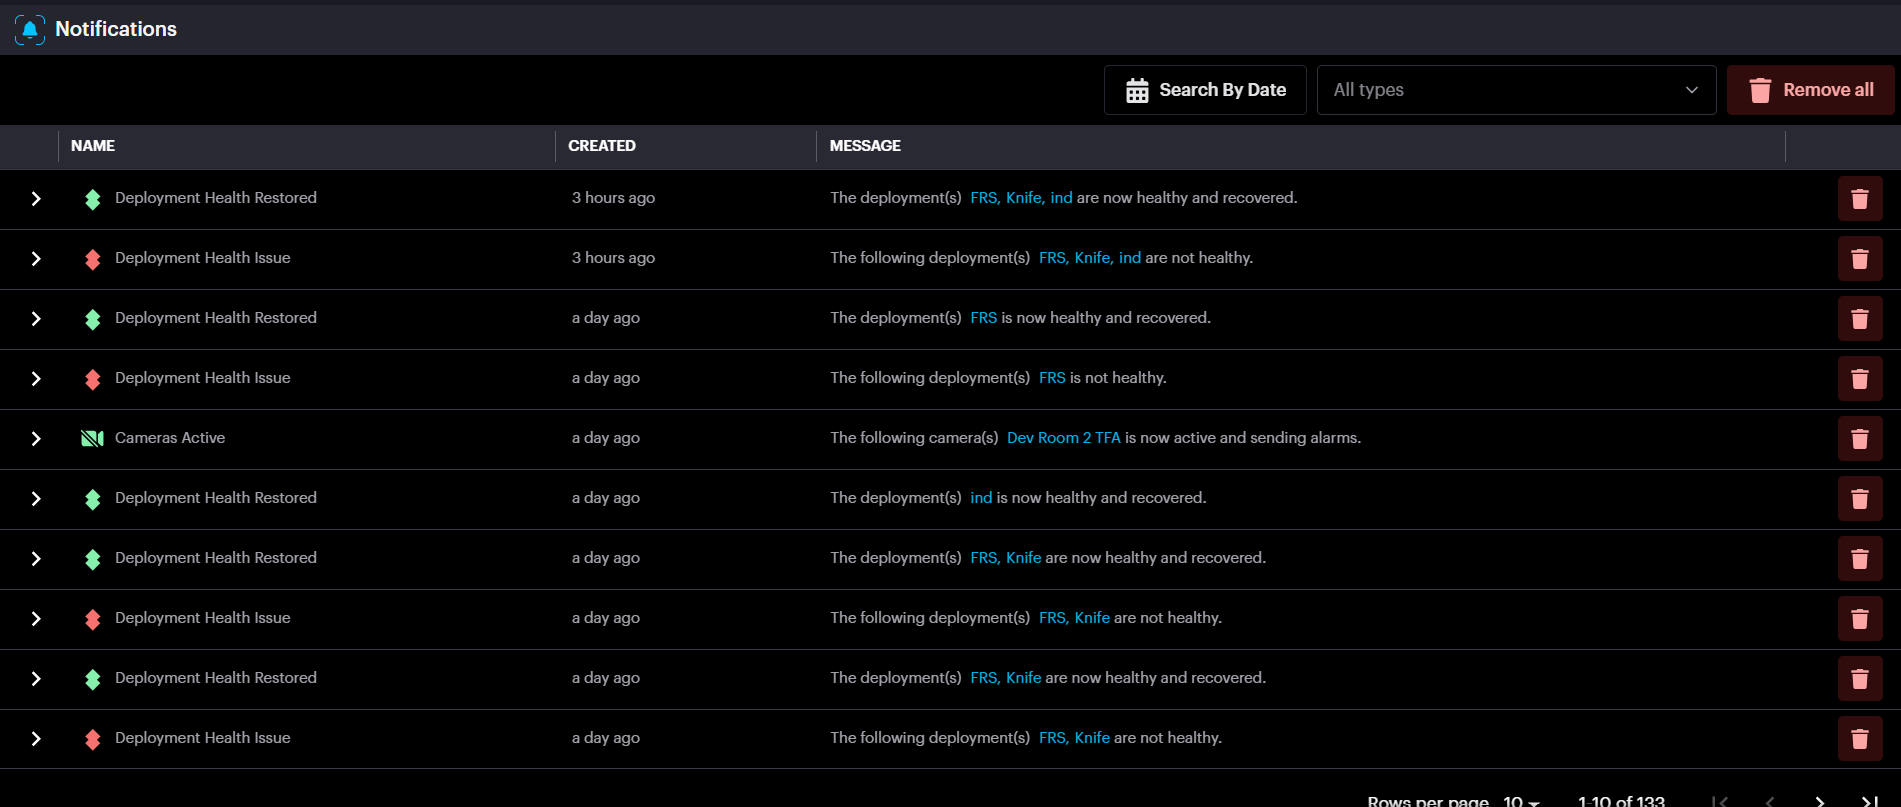
Events are grouped by their type. To see more information about an event, such as its source or the time it occurred, simply expand the group by clicking on it.
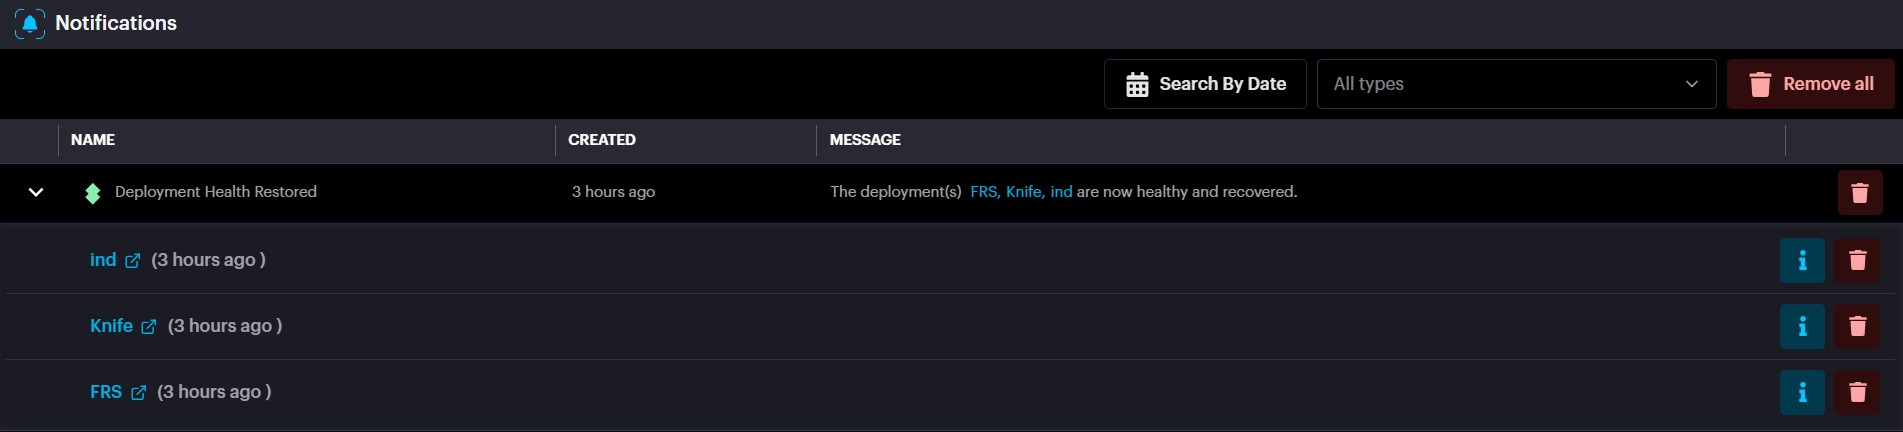
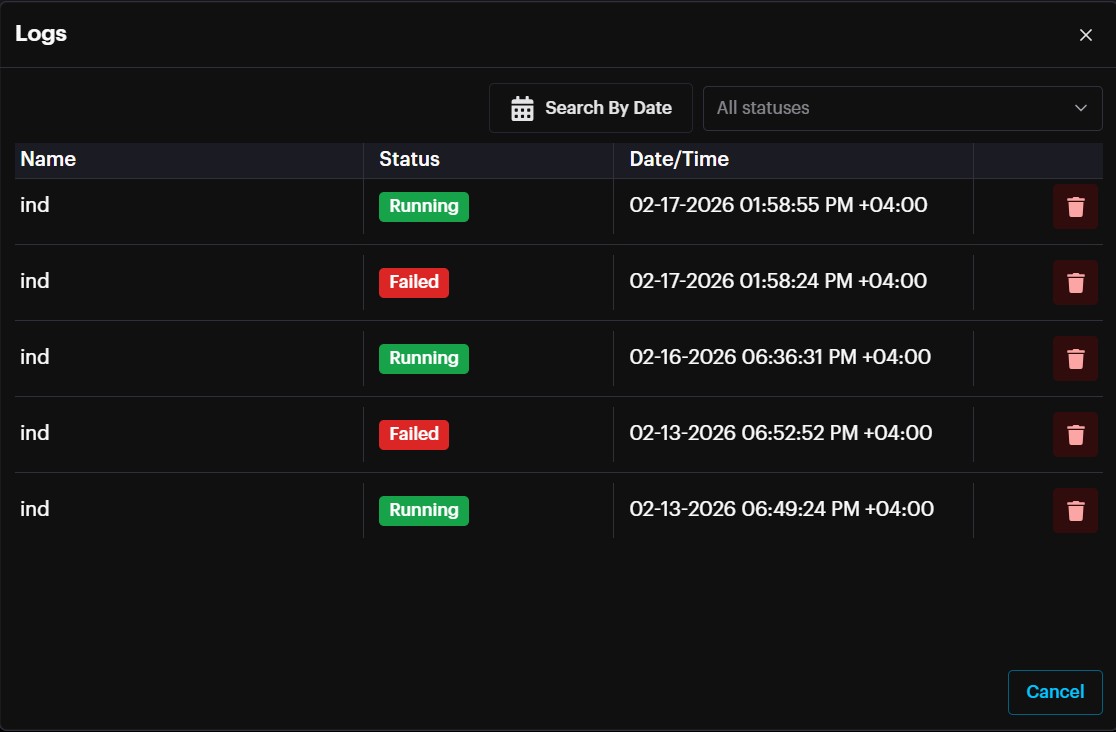
To see more details about a specific event or to access filtering options, simply click the Info button.
Moreover , it is possible to trigger email notifications from Account Menu à Settings à Notifications.
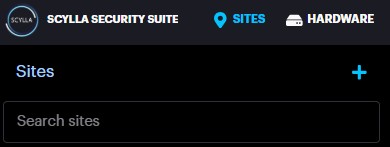
Sites
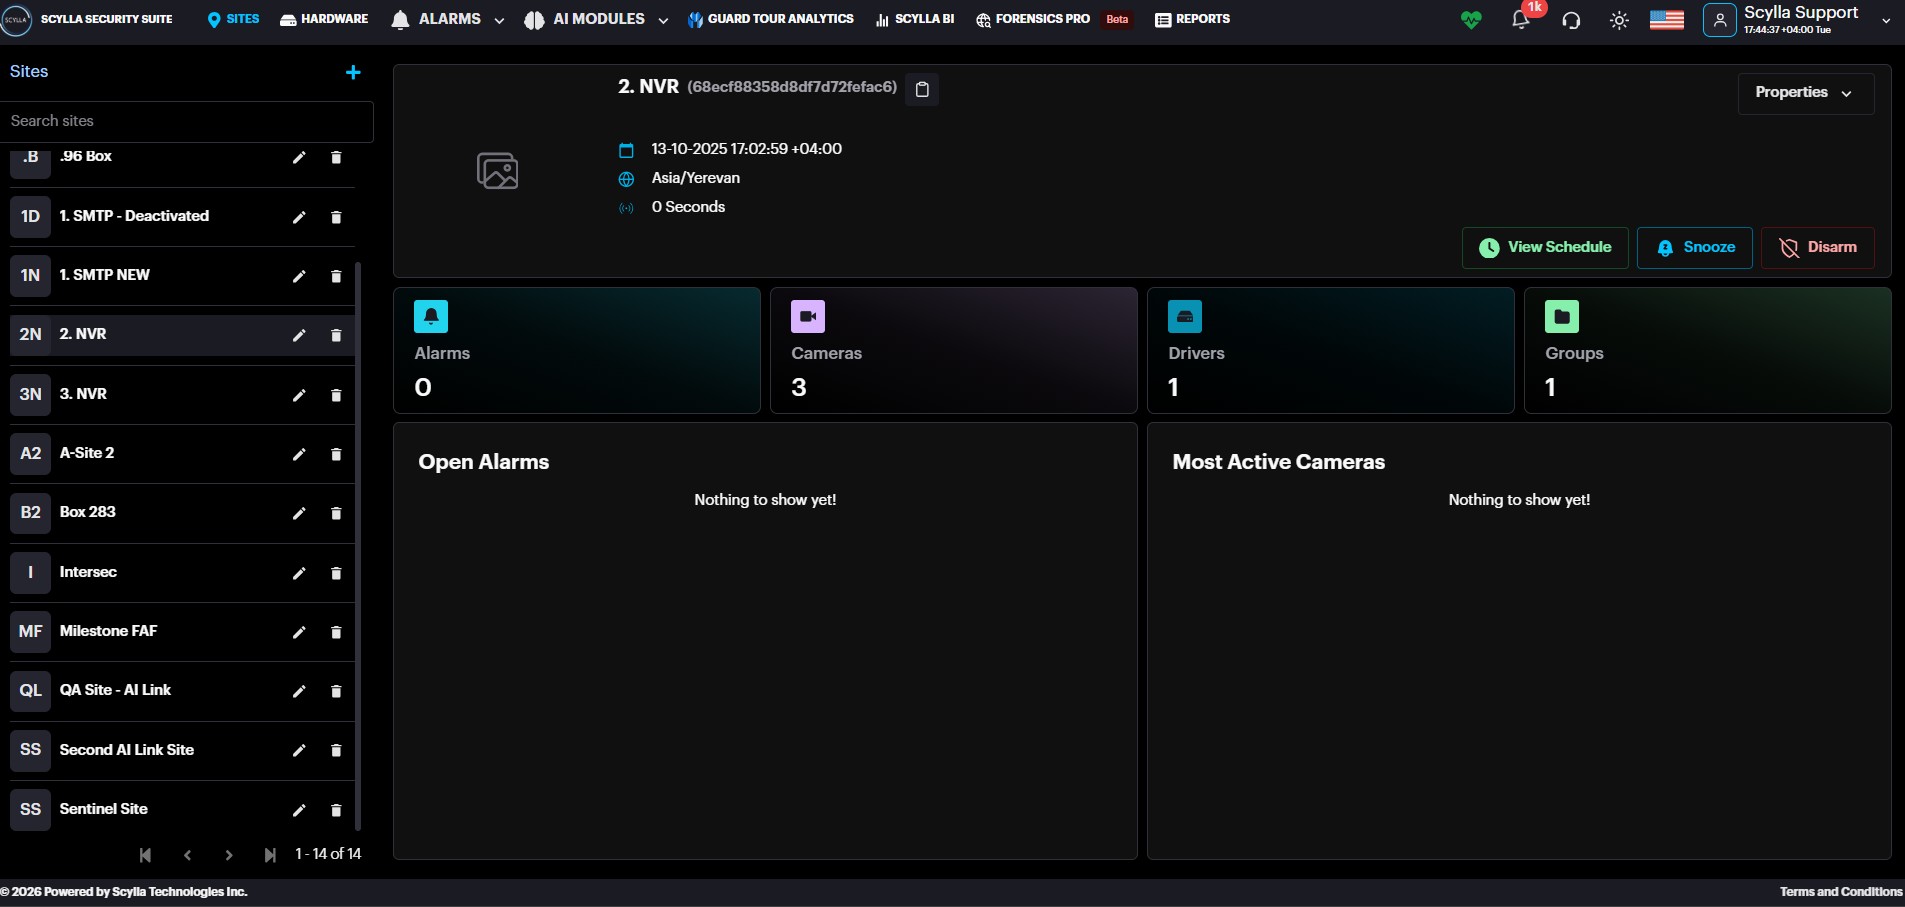
On the Sites page you can see the list of sites on the left side.
Select the desired site to see the following stats and options:
● Site name and creation date
● Recent alarm — info about the most recent alarm (in red message)
● Snooze — select the type of alarm notification’s snooze action and the duration
● View Schedule- Info about the schedule of the selected site
● Disarm — disarm the detections from selected Site by specified duration or disarm/arm manually
● Alarms — number of recent alarms
● Cameras — number of connected cameras
● Drivers- number of drivers
● Groups — number of groups
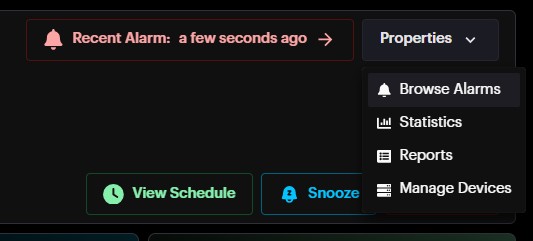
● Open Alarms — window containing the most recent alarms. Click on the specific alarm to see the detailed information only for this alarm occurrence.
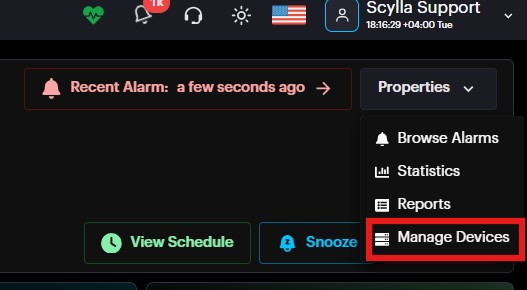
● Properties window:
○ Browse Alarms — opens the Browse Alarms History page with all alarms for this specific site
○ Statistics — opens the Statistics page for this specific site
○ Reports — opens the Reports page for this specific site
○ Manage Devices — opens the Manage Devices menu for this specific site
● Most Active Cameras — list of most active cameras and a total number of their alarms. Click on the camera to see its detailed information and settings from the Hardware menu
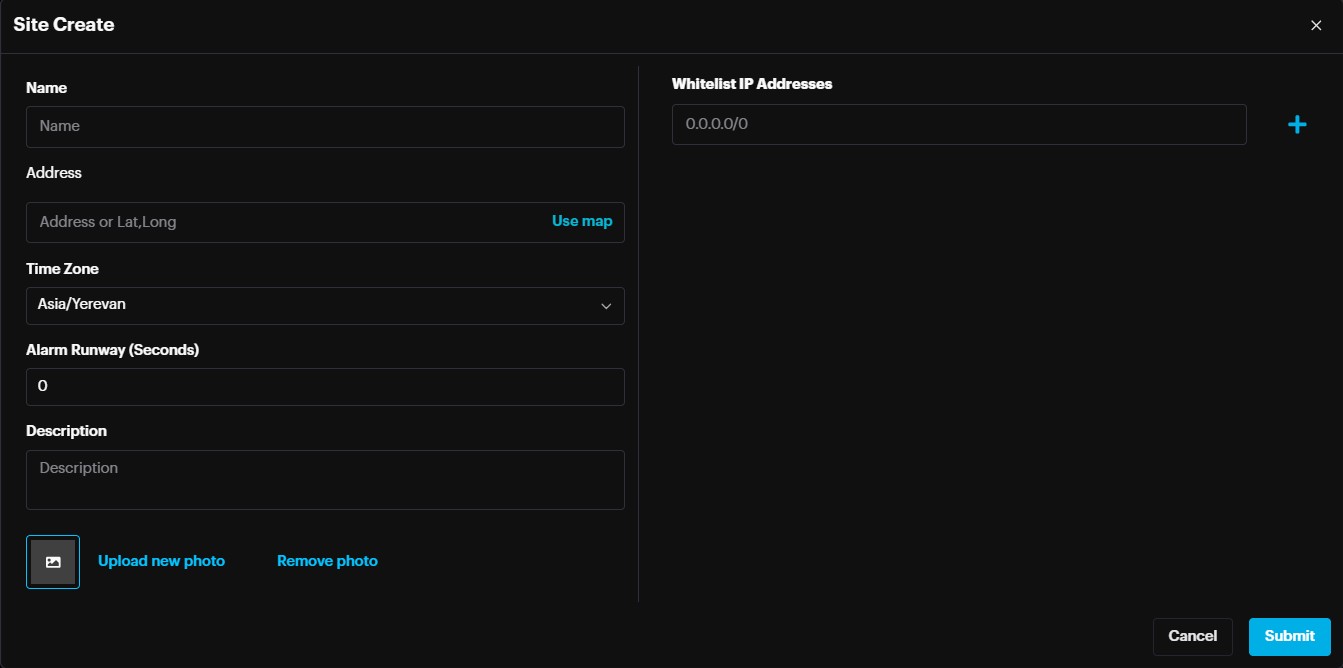
To create a new site, click the Add new site button +.
Then, in the Site Create pop-up menu specify the Name, Address, TimeZone, Alarm runway, and Description, Upload photo, Whitelist IP address (in case of SMTP integration) and Click Submit.
You can also update the site’s name, address, description, and add/remove photo by hovering your mouse cursor over the site’s name from the list and clicking the
Edit button.
Enter the information into the corresponding fields and click Submit to save.
Alarm Runway/Cooldown
Alarm runway is a site-level setting that will group repeated alarms from the same camera withing the specified amount of seconds .
This will notify once but buffer all subsequent alarms under that one alarm.
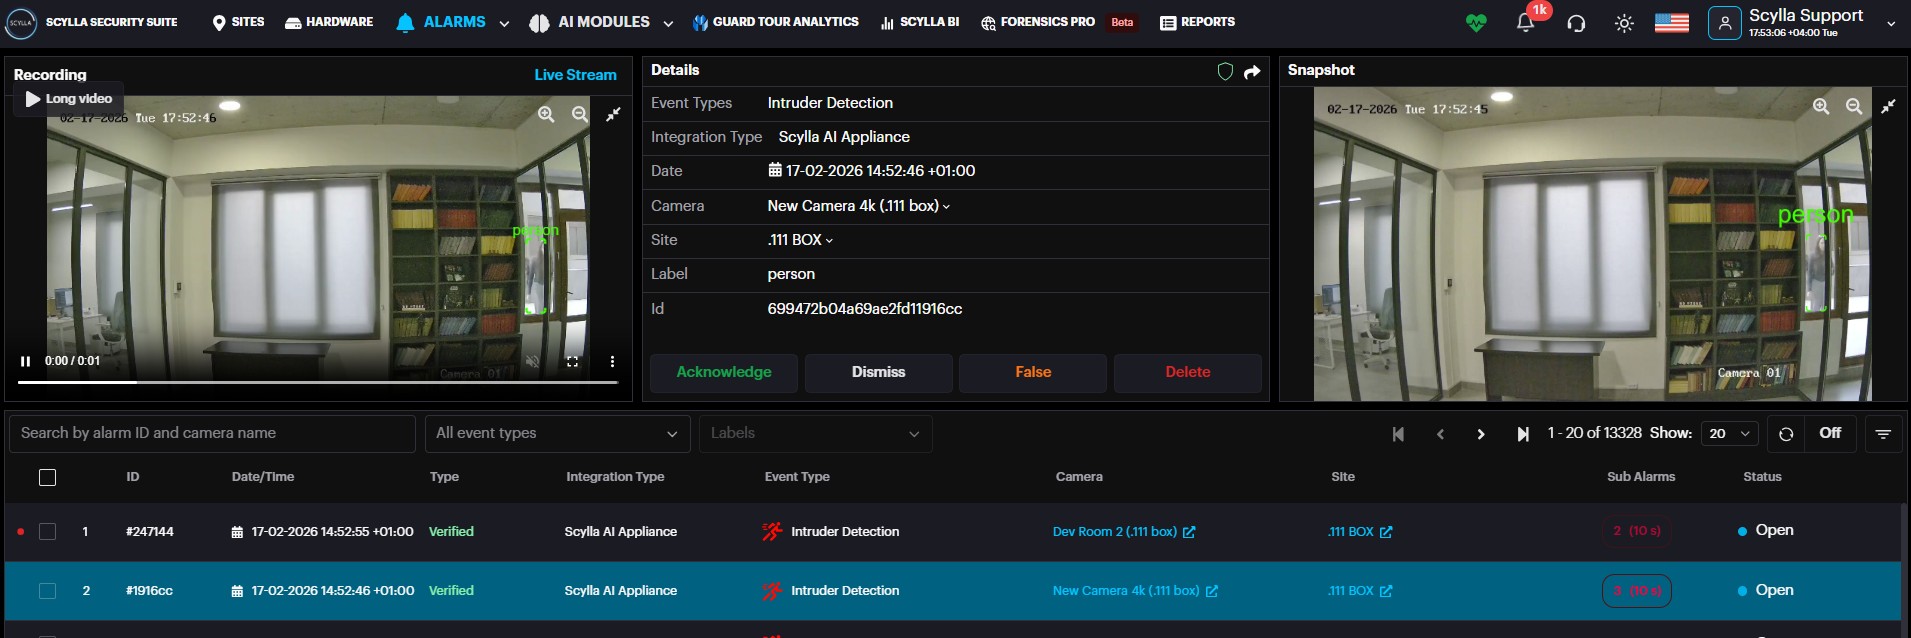
In the alarm record there is the Sub Alarms field where you can see the number of alarms detected within the specified alarm runway time.
By clicking the 3(10)s which means 3 detections occurred within the specified time , a Sub Alarms window will pop up showing the detections.
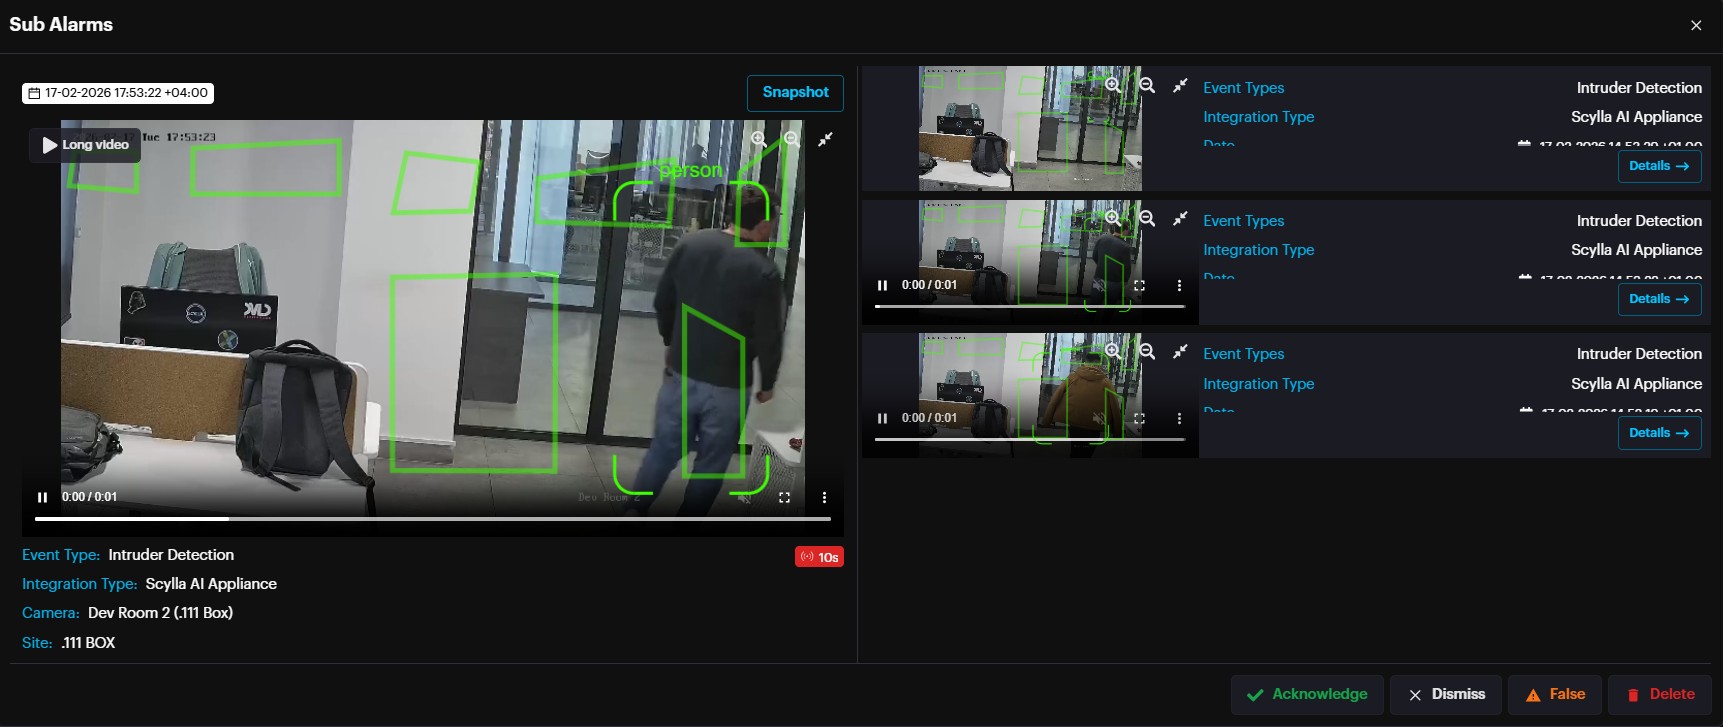
On the left side the main alarm is displayed.
On the right side the sub alarms are displayed and by clicking the Details button it is possible to view the details of a specific sub alarm.
It is possible to Acknowledge, Dismiss, False or Delete the alarm from this window.
Browse Alarms History
On the Site page select the desired site, then click on Browse Alarms on the Properties window.
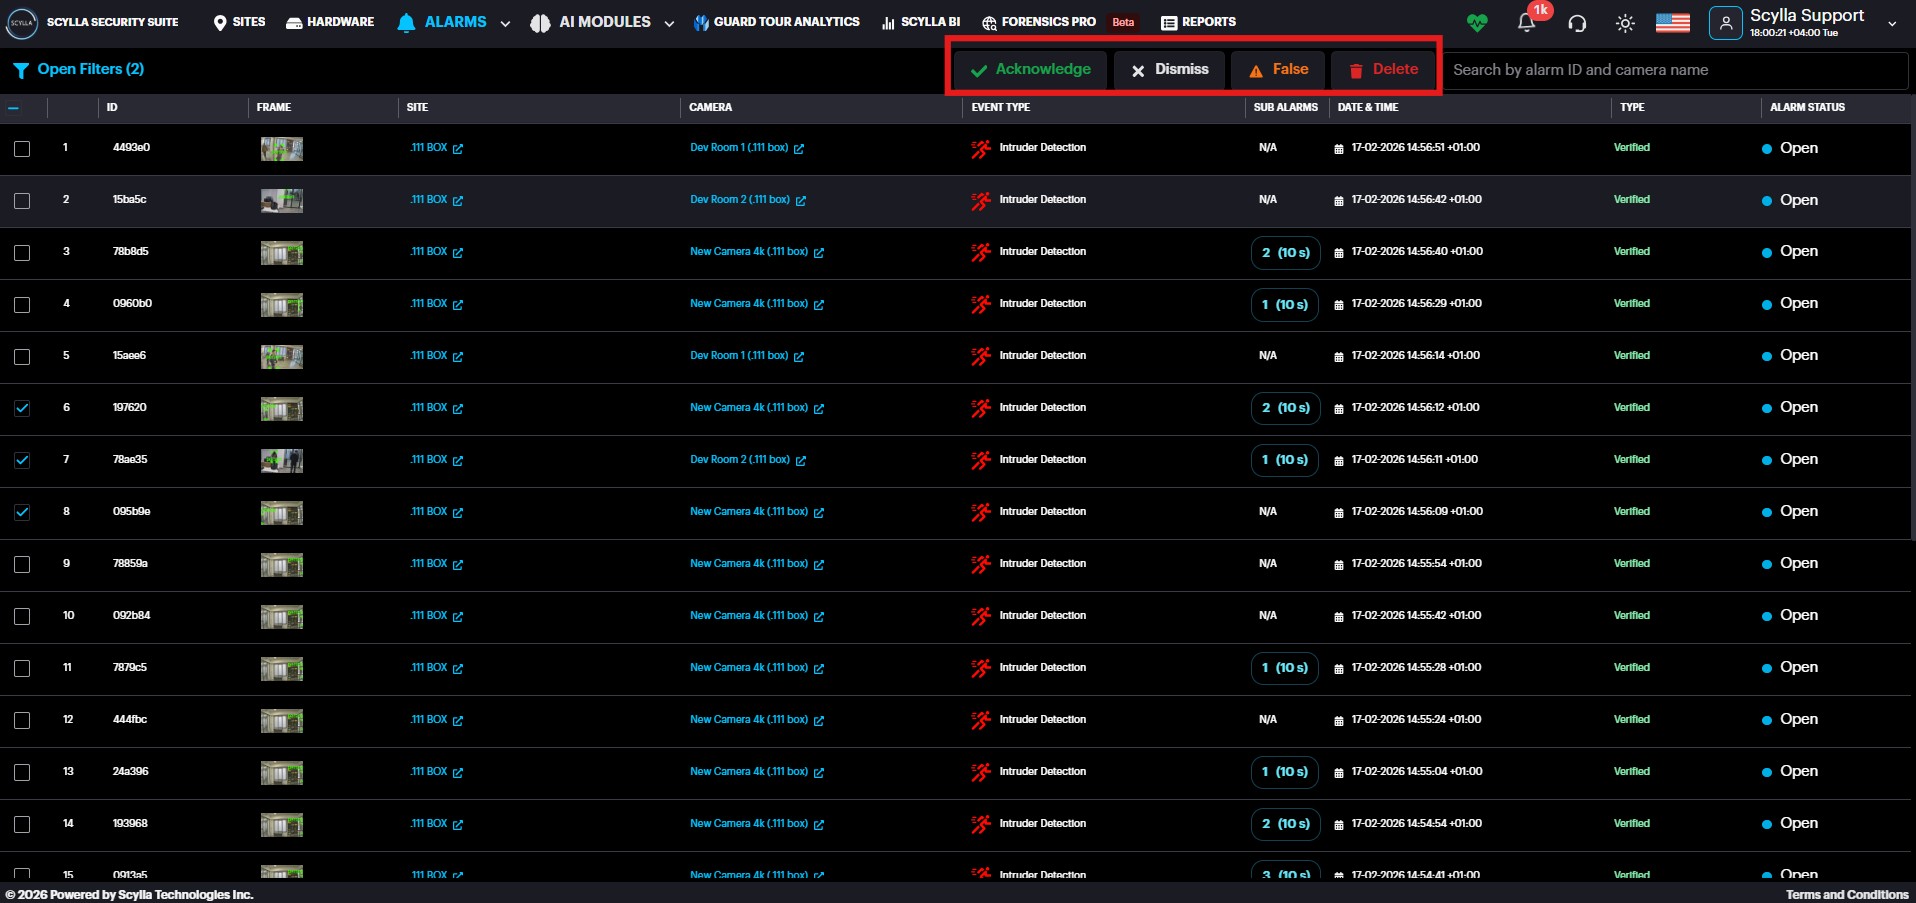
Here you can see the detailed information for all alarm occurrences (such as ID, Frame, Camera, Event Type, Date & Time, Type, and Alarm Status).
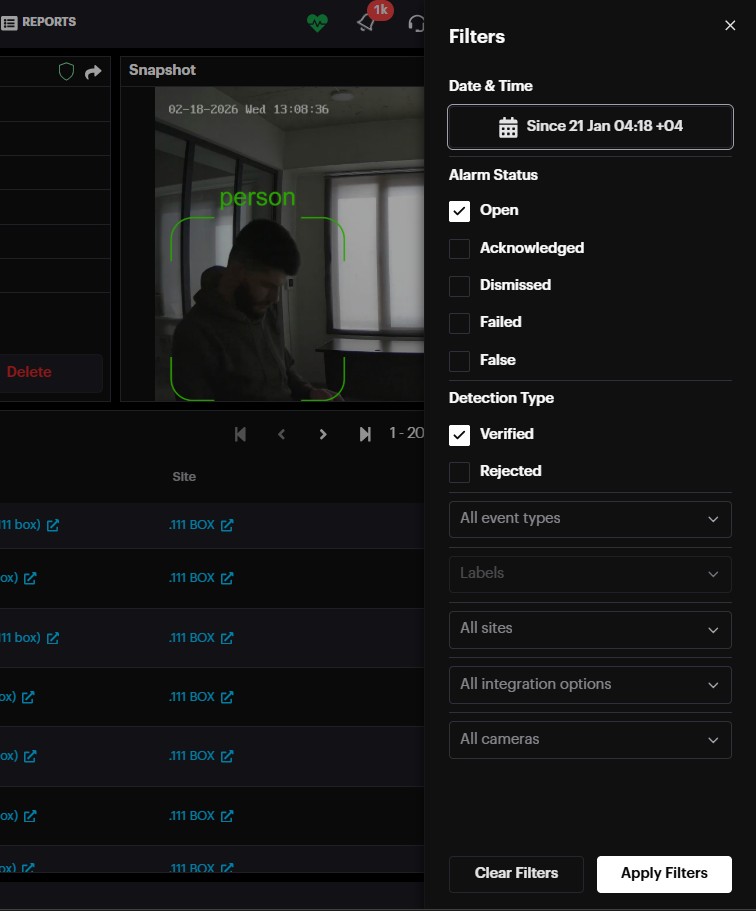
By default, the last alarm occurrence is selected, and its Detection Details window is open on the right side, and the Filters menu is open on the left side.
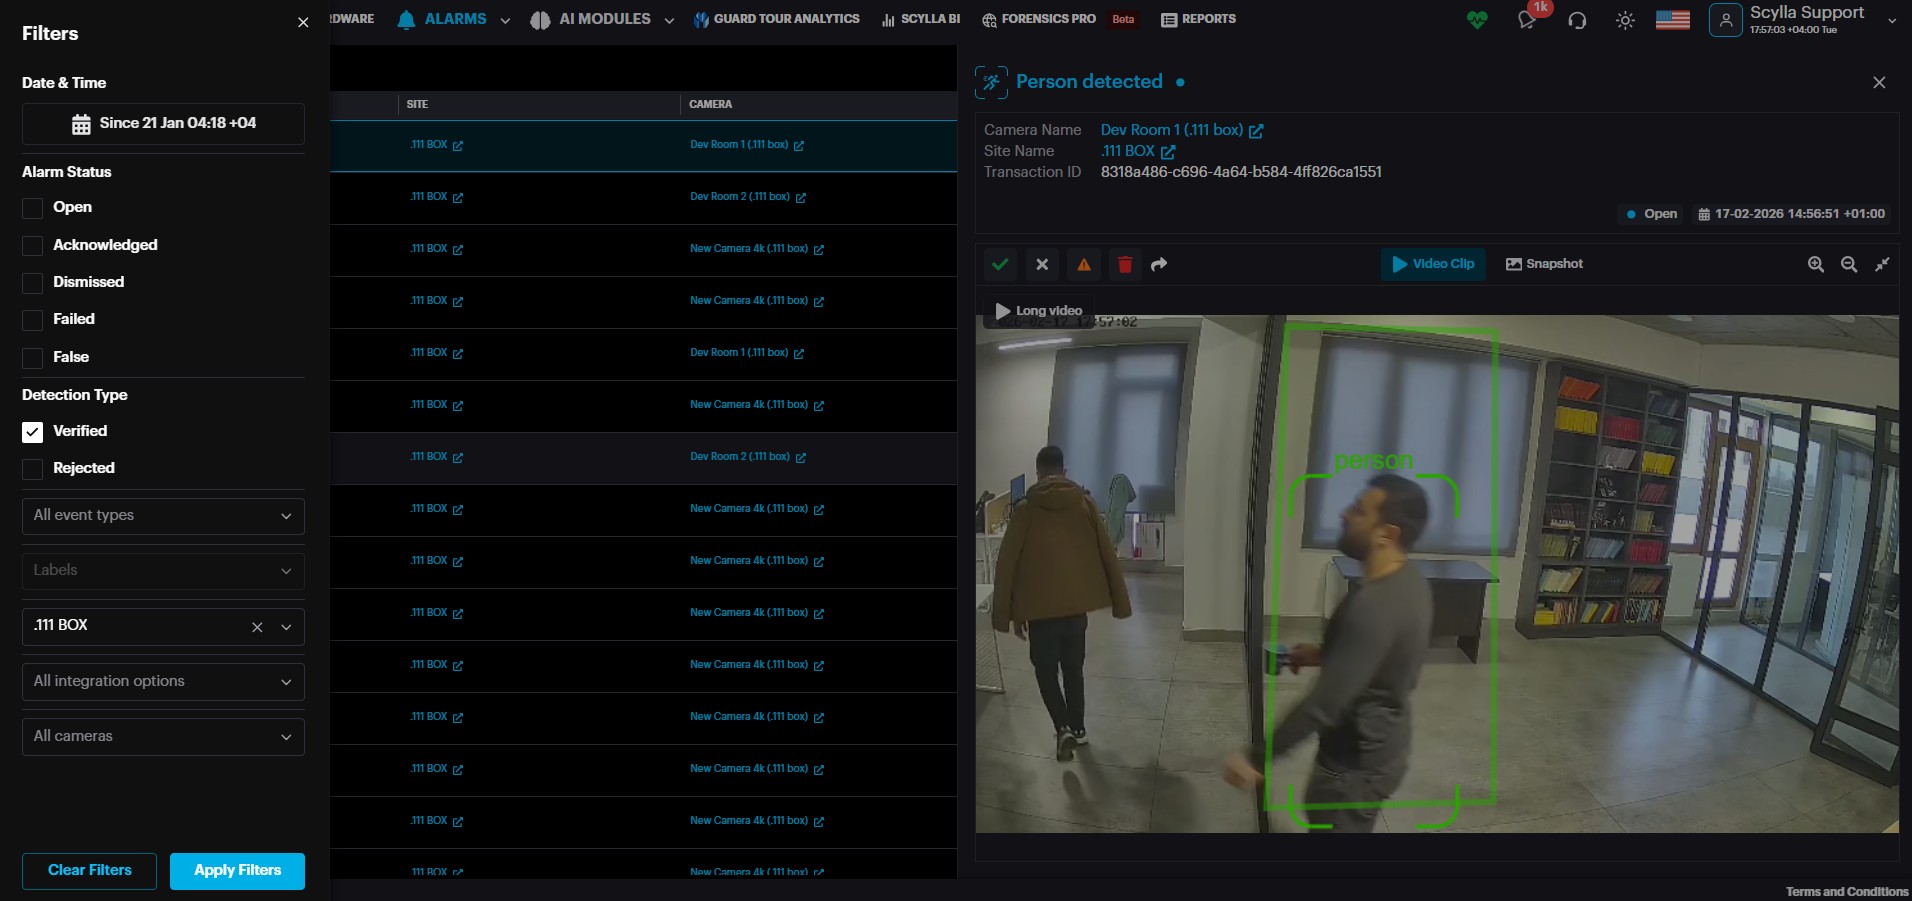
Click the Close Filters button to close the filters menu and click Open Filters button to open it again.
Filters allow you to filter alarms by:
● statuses (open, acknowledged, dismissed, ignored, failed);
● type (verified or rejected);
● event type;
● labels;
● sites;
● integration options;
● cameras;
● date & time (opens the calendar where you can click on the date field and select the desired date or a period).
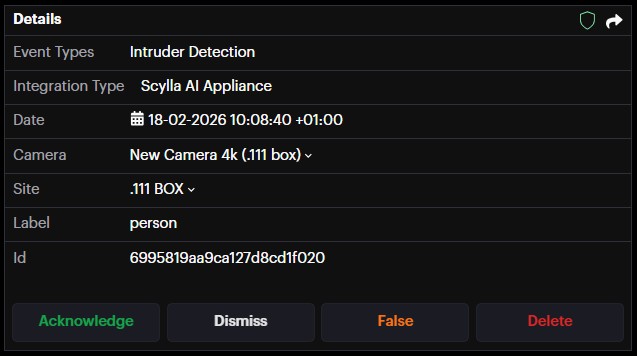
On the Detection Details window, you can see the name of the camera and site, date and time of detection. You can also switch between the Video Clip and Snapshot of the detection occurrence by clicking the corresponding buttons, zoom in/out using the zooming controls, and Acknowledge , Dismiss , Mark as False , Delete or Share the detection by clicking on the corresponding buttons.
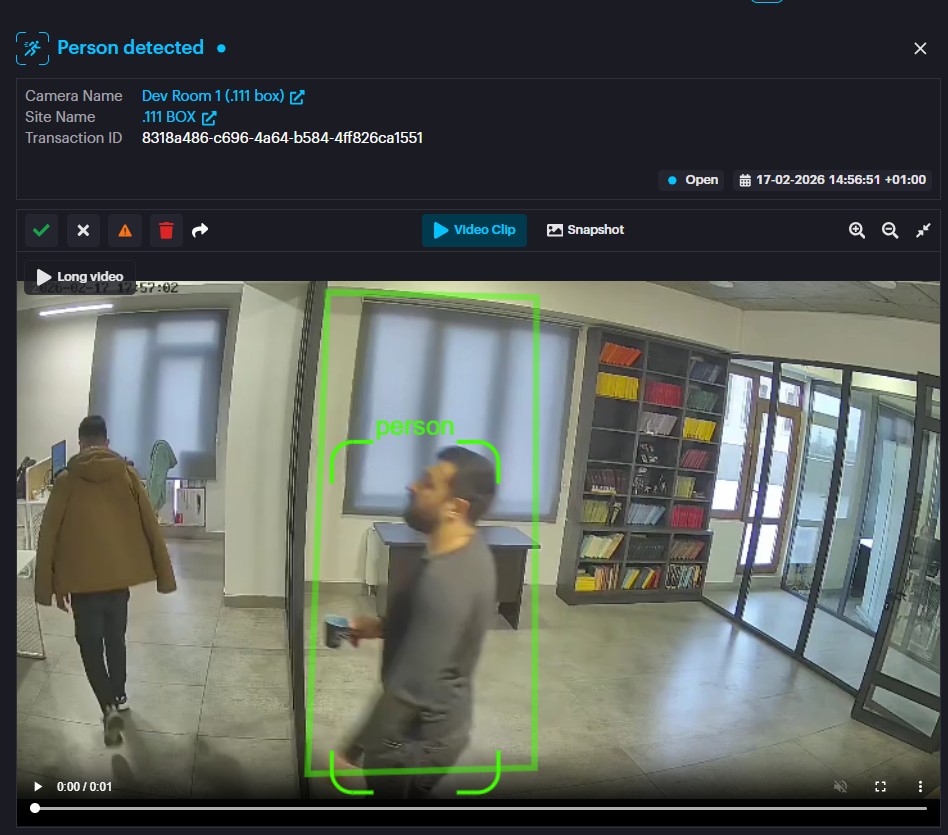
Click the Close Detection Details button to close the window.
You can also Acknowledge , Dismiss , False or Delete multiple alarms by selecting the checkboxes on the left and clicking the relevant button.
Manage Devices
On the Site page select the desired site, then click on Manage Devices on the Properties window.
You can also open the specific camera’s settings by clicking the camera in the Most Active Cameras window.
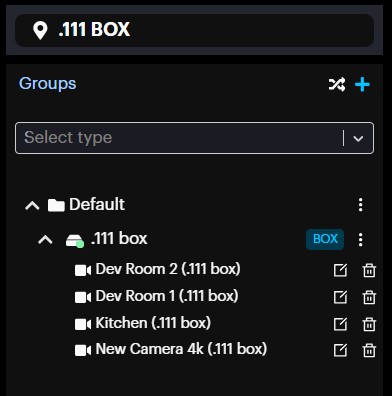
On the Manage Devices menu you can open the existing camera groups to see all cameras and be able to change their settings.
Create Group
If you need to create a new group, click the button.
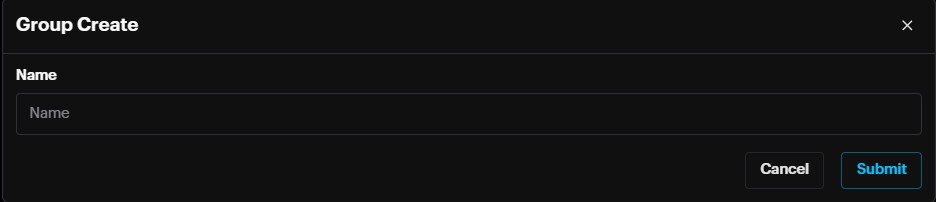
In the Group Create pop-up specify the name for a new group and click Submit.
Add New Device
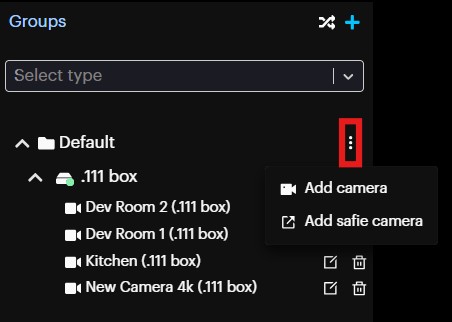
To add new device, click on the More Options button on the desired group and click Add camera.
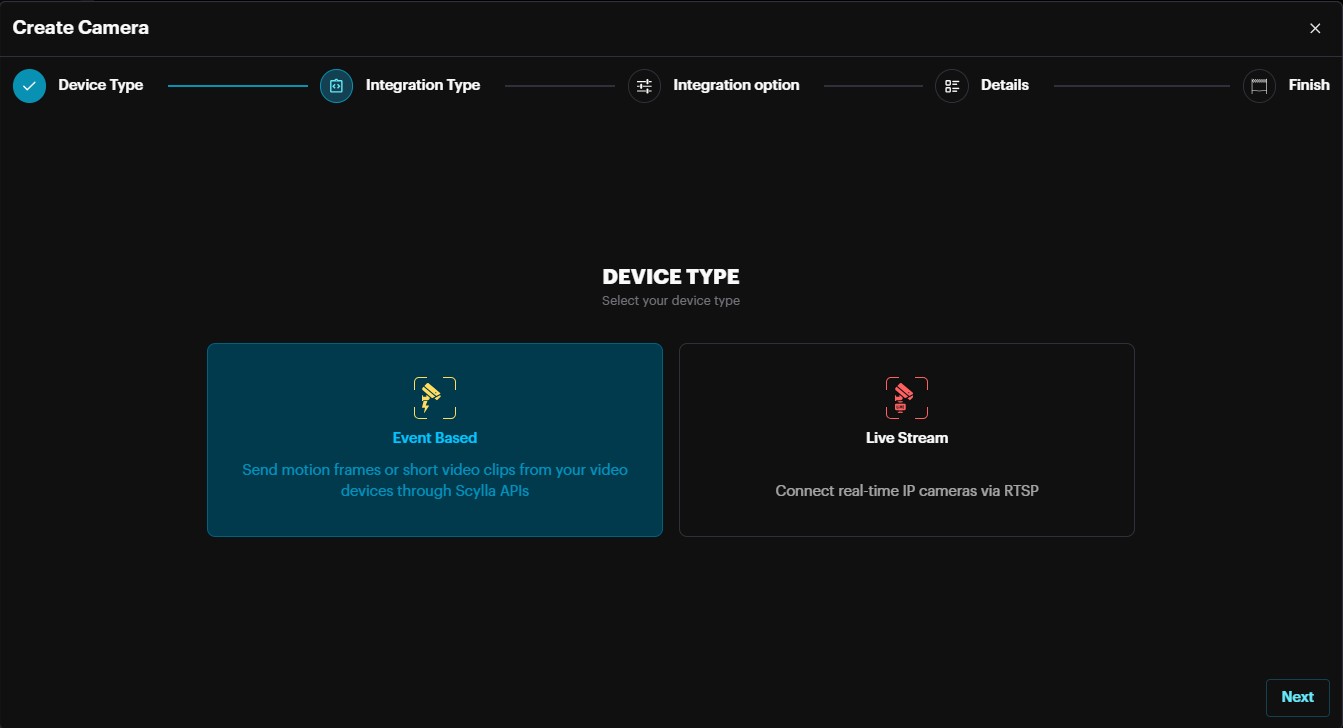
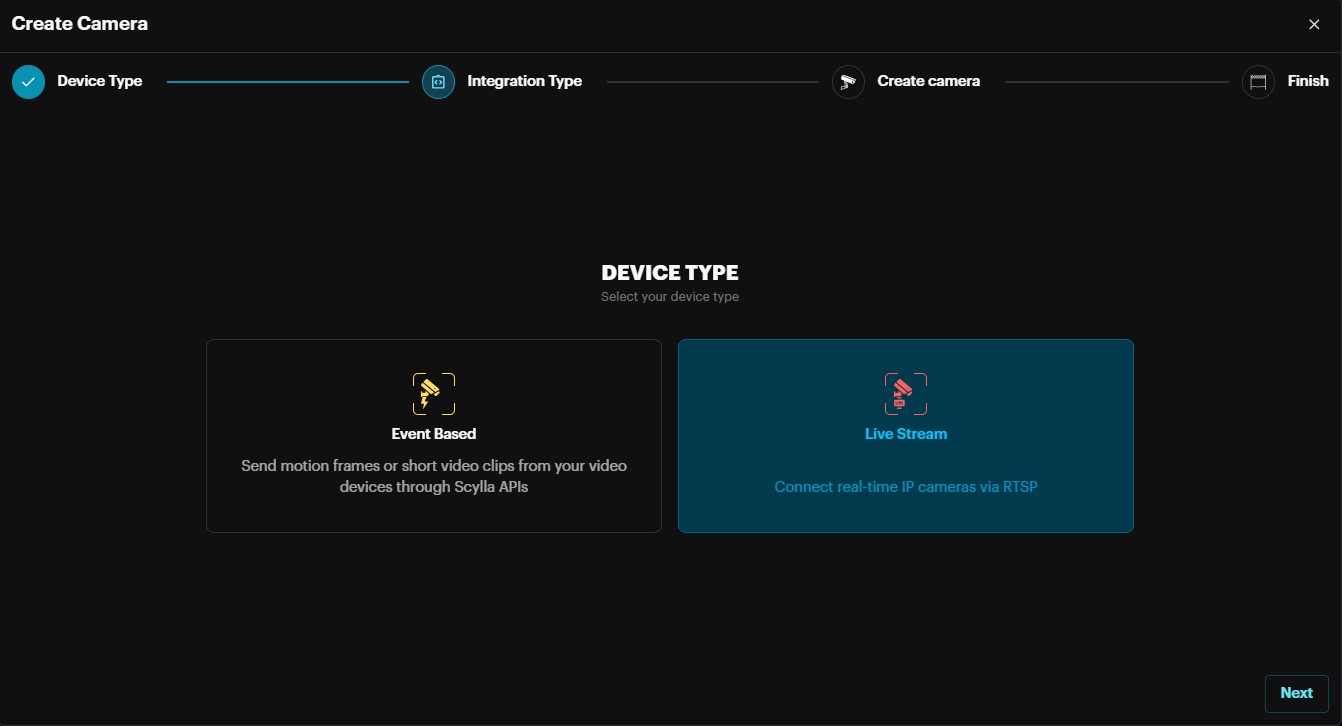
Then on the pop-up menu in the Device Type section select the desired type based on your requirements, goals, and tools (Event Based or Live Stream). Click Next.
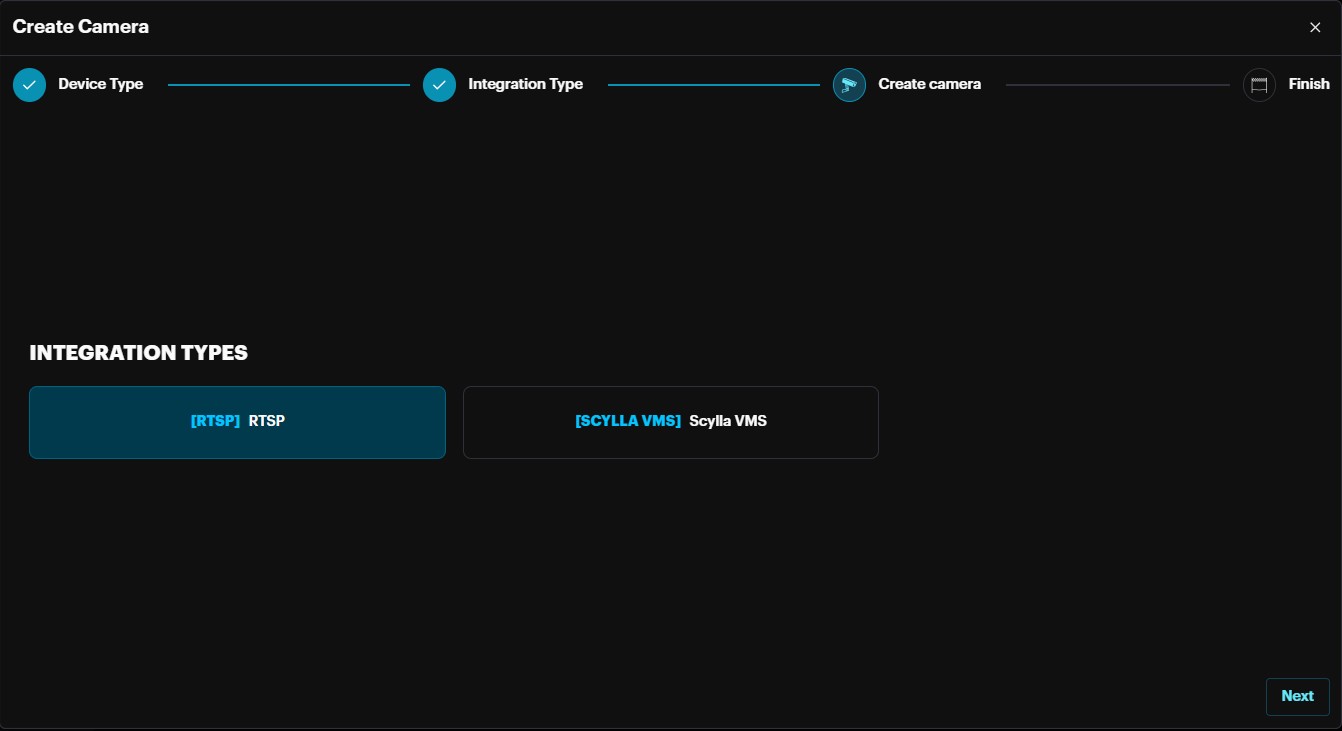
In the Integration Type section select the desired integration type and click Next.
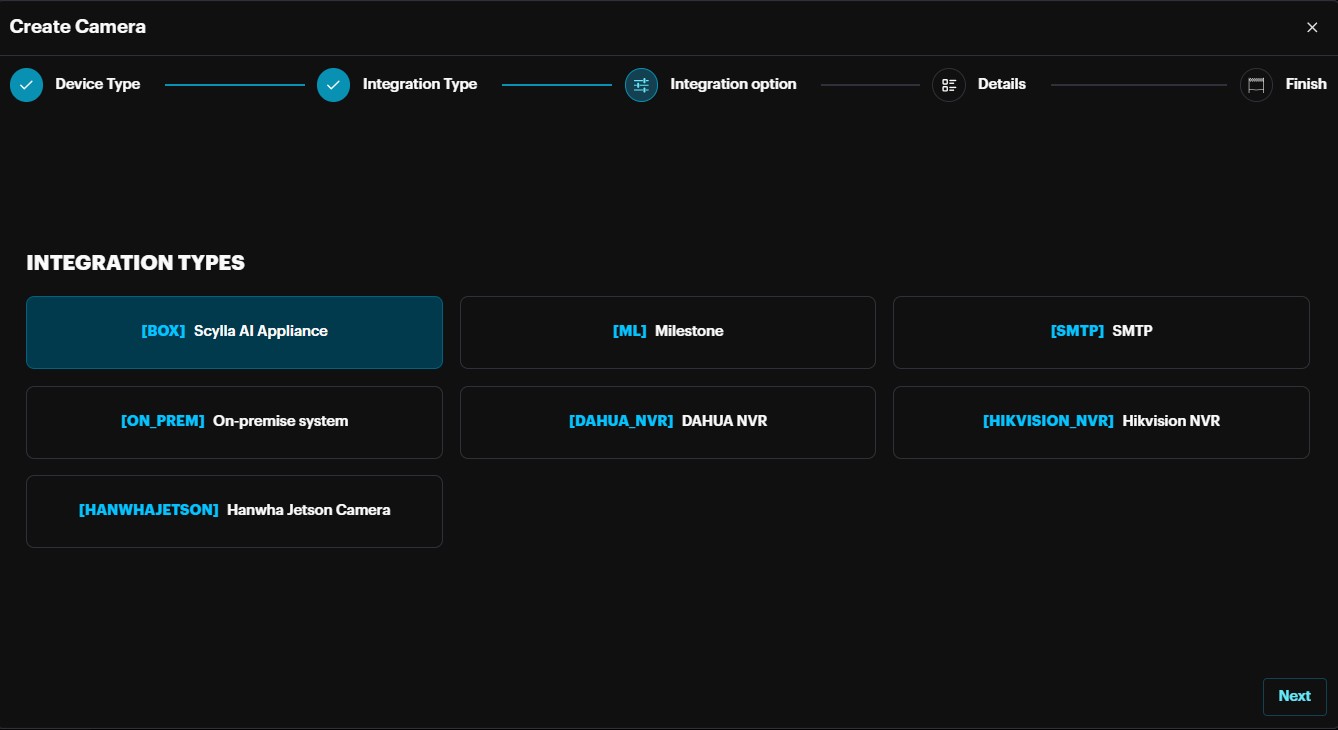
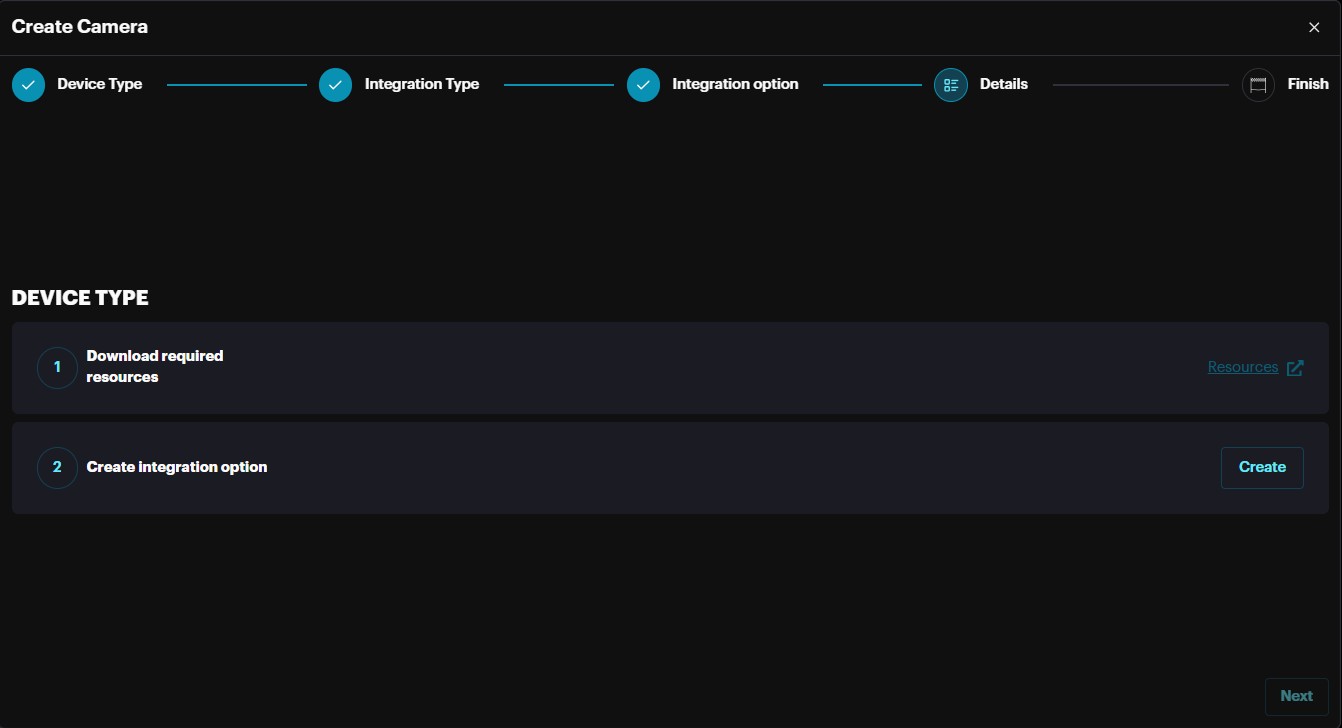
In the Integration Types section, click the Resources button to download the manual for this integration. Then click Create.
On the Create Integration option pop-up enter the name and click Create & Continue.
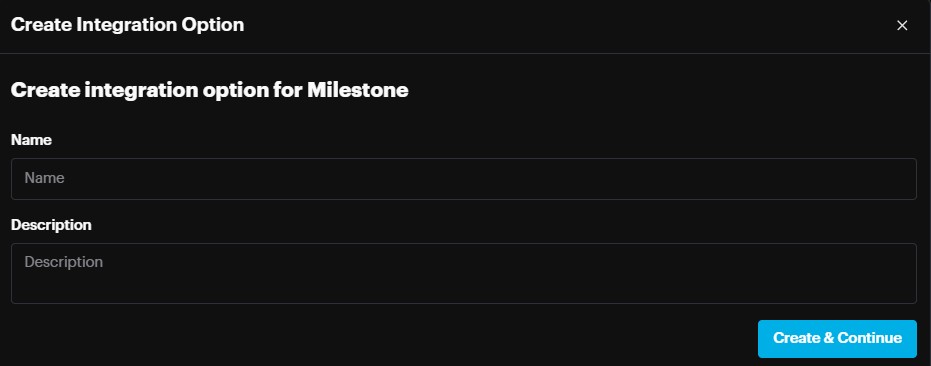
Then click Next.
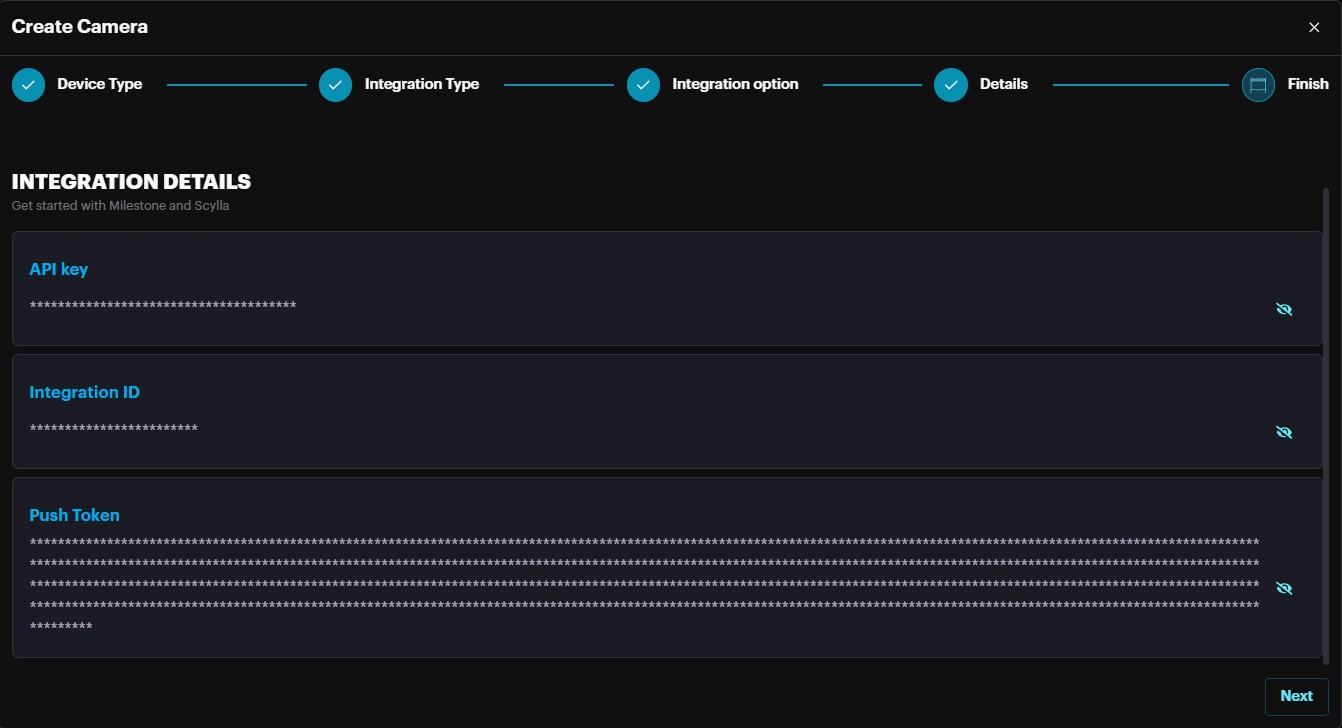
In the Details section you can see the information about the created integration which can be used to add cameras, click Next.
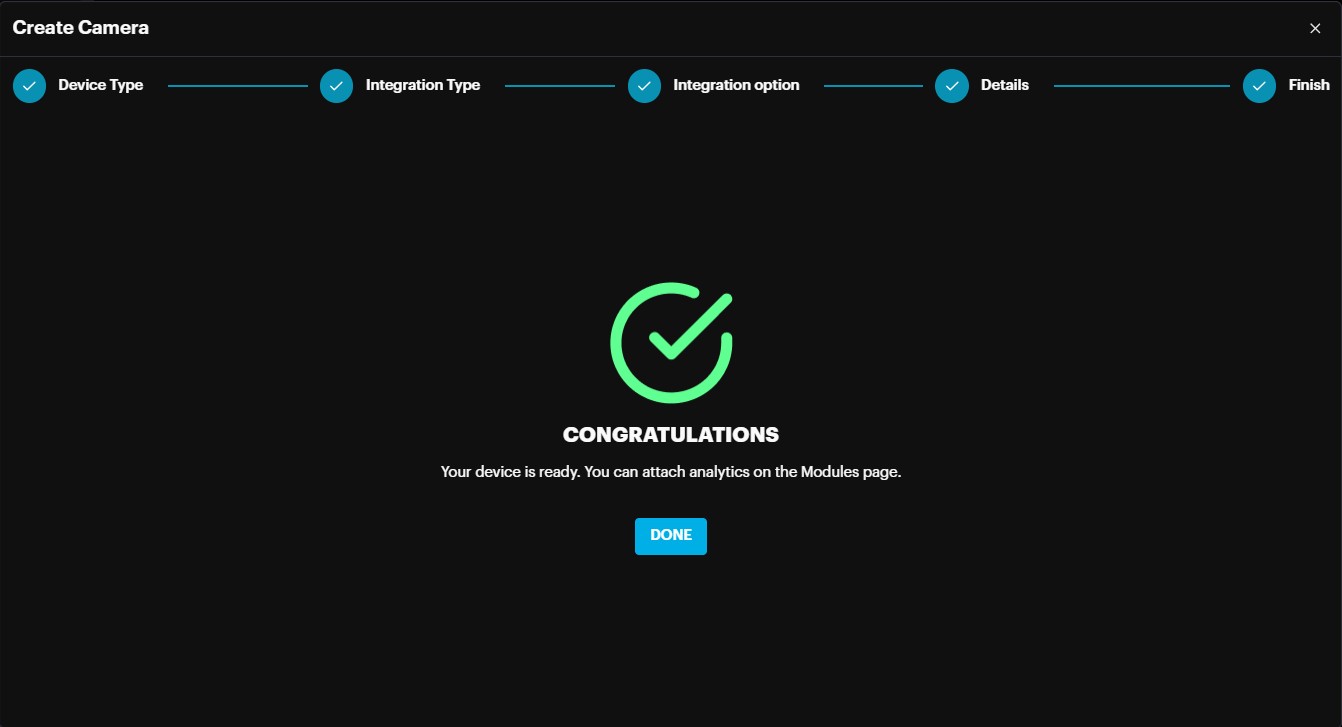
Click Done to finish the creation process.
You also can add a Live Stream camera, to do so, click on the More Options button on the desired group and click Add camera.
Then on the pop-up menu in the Device Type section Live Stream. Click Next.
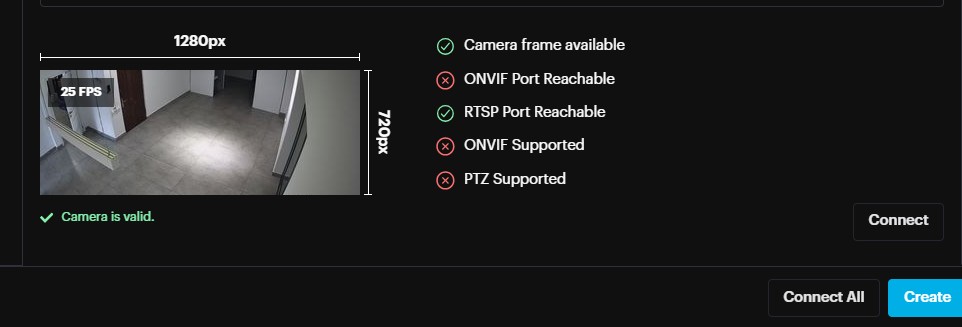
On the pop-up page specify the name of the camera and add the URL (rtsp, rtmp, http) and click Connect.
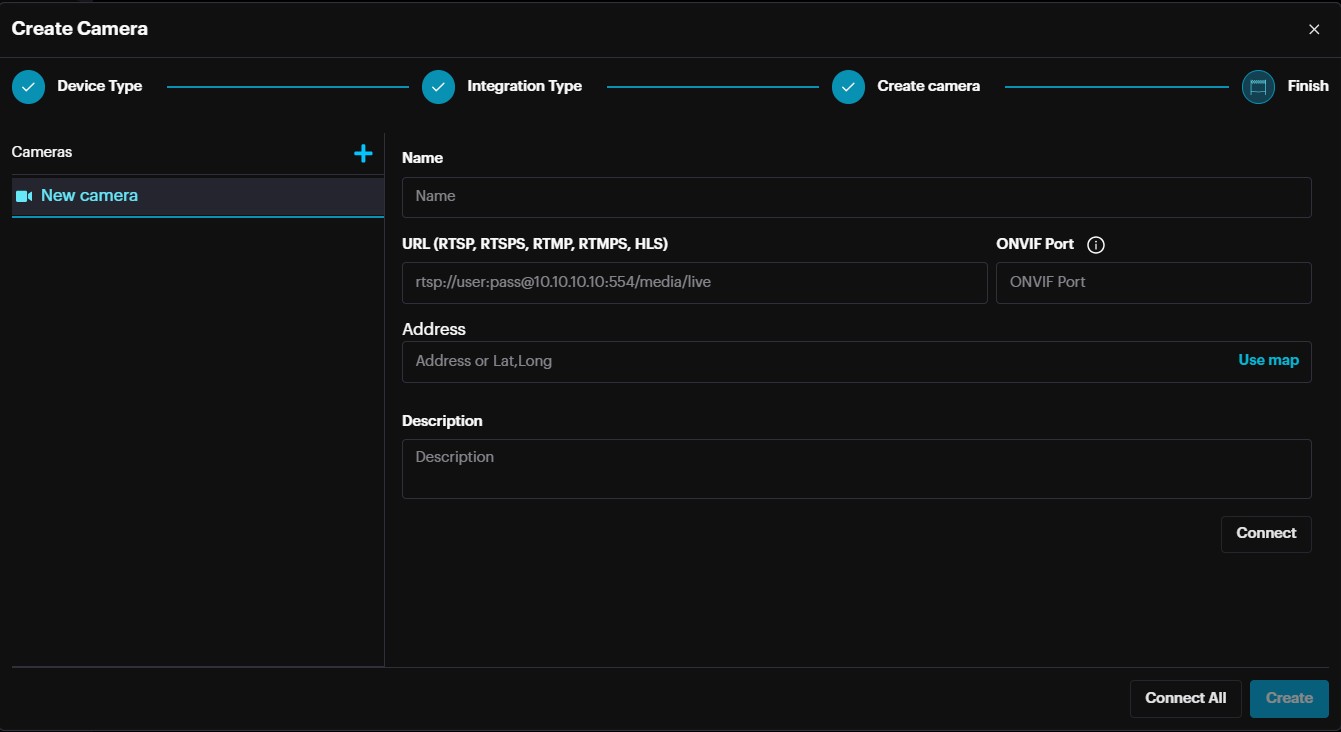
If the provided URL is valid, you will receive information about the camera stream, click Create.
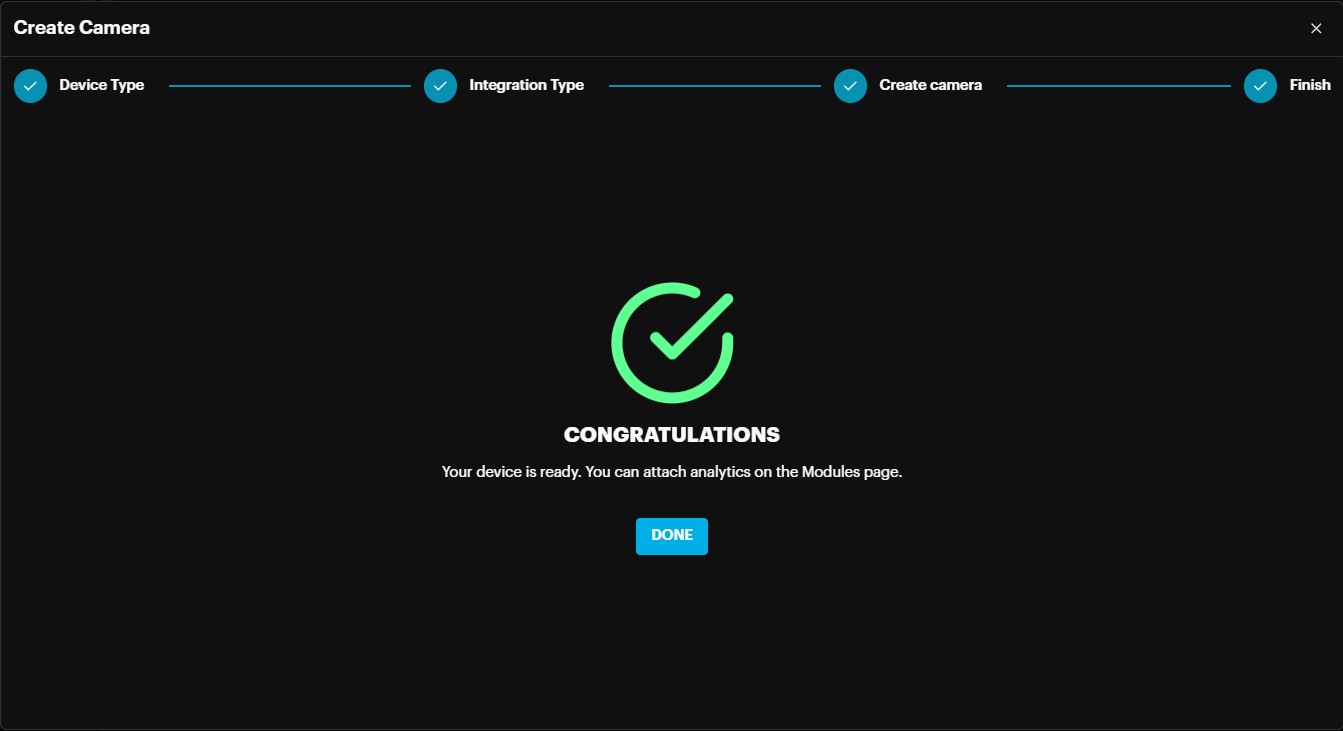
Click Done to finish the Live Stream camera creation process.
To see the credentials of the device, go to More Options -> Credentials.
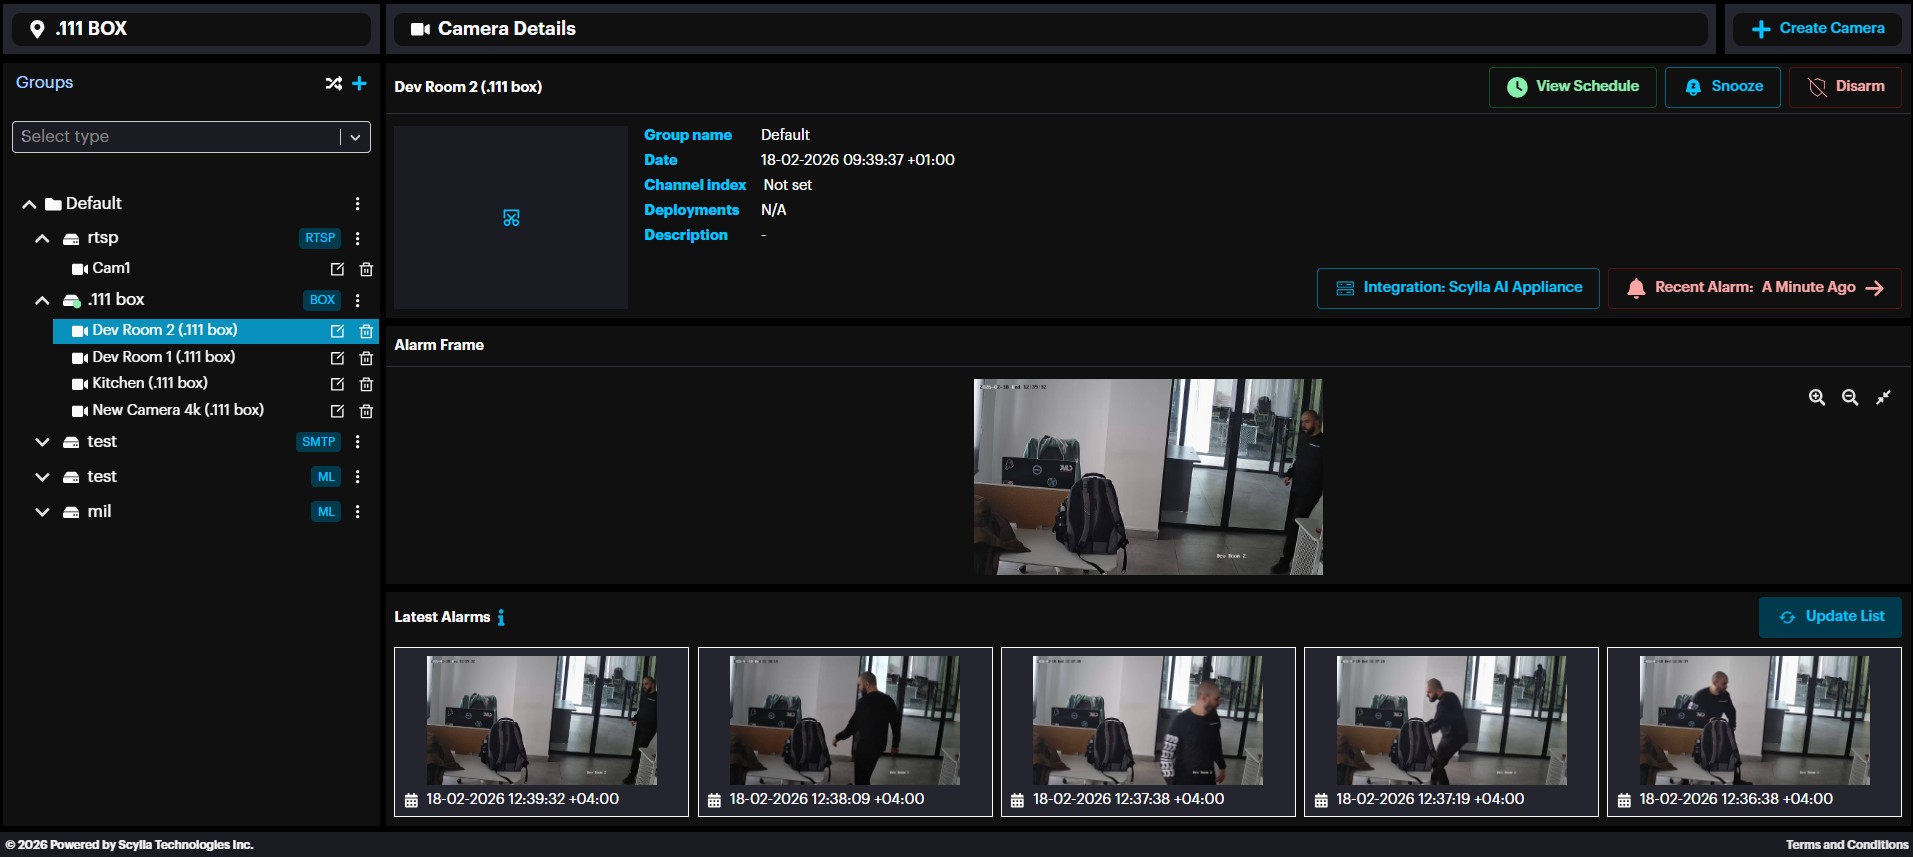
Camera Settings
To set up the settings of a specific camera, click on the desired camera.
Here you can see camera details, View Schedule of the camera (if it is scheduled), Snooze the camera, Create Camera as well as the time of the most recent alarms, and five latest alarms.
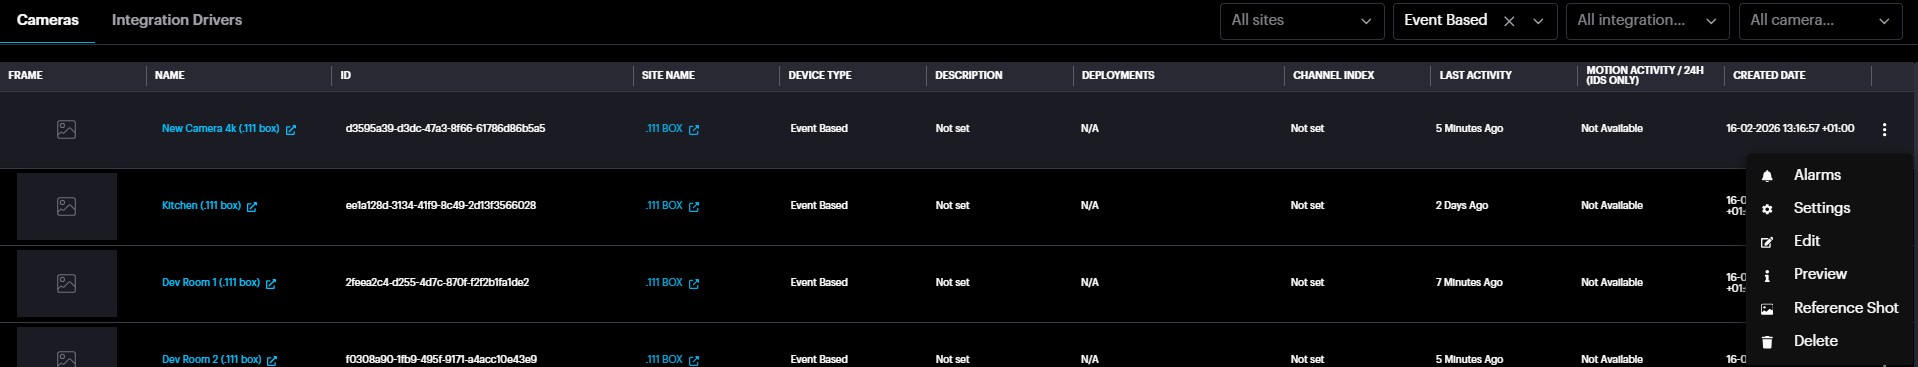
Hardware
This page displays a list of all connected devices, including cameras, NVRs, and Asteria boxes.
From here, you can manage each device and configure various settings, such as:
- Drawing active areas for motion or event detection
- Editing camera information
- Configuring AI-related settings for individual cameras
- Setting up remote access for Asteria devices
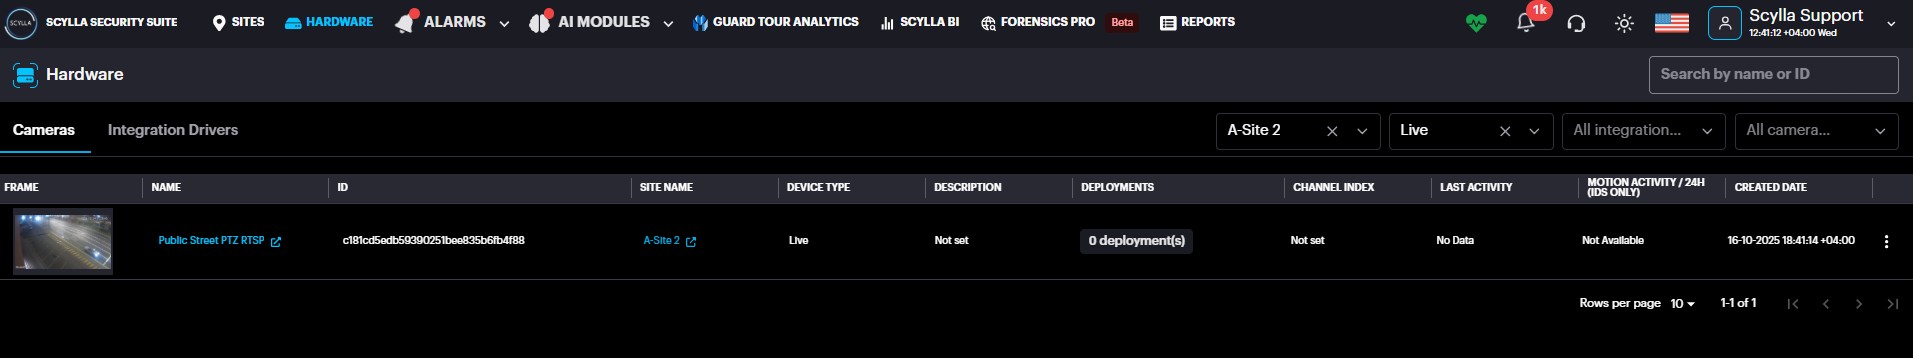
And more
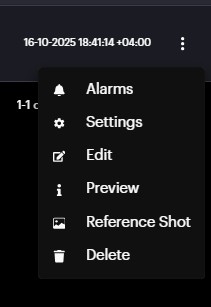
Each camera record has three-dots on the right side which allows to navigate to Alarms of this camera, Edit the camera (name, rtsp url , description …), draw Areas/zones, specify False alarm filtering settings, or delete the camera.
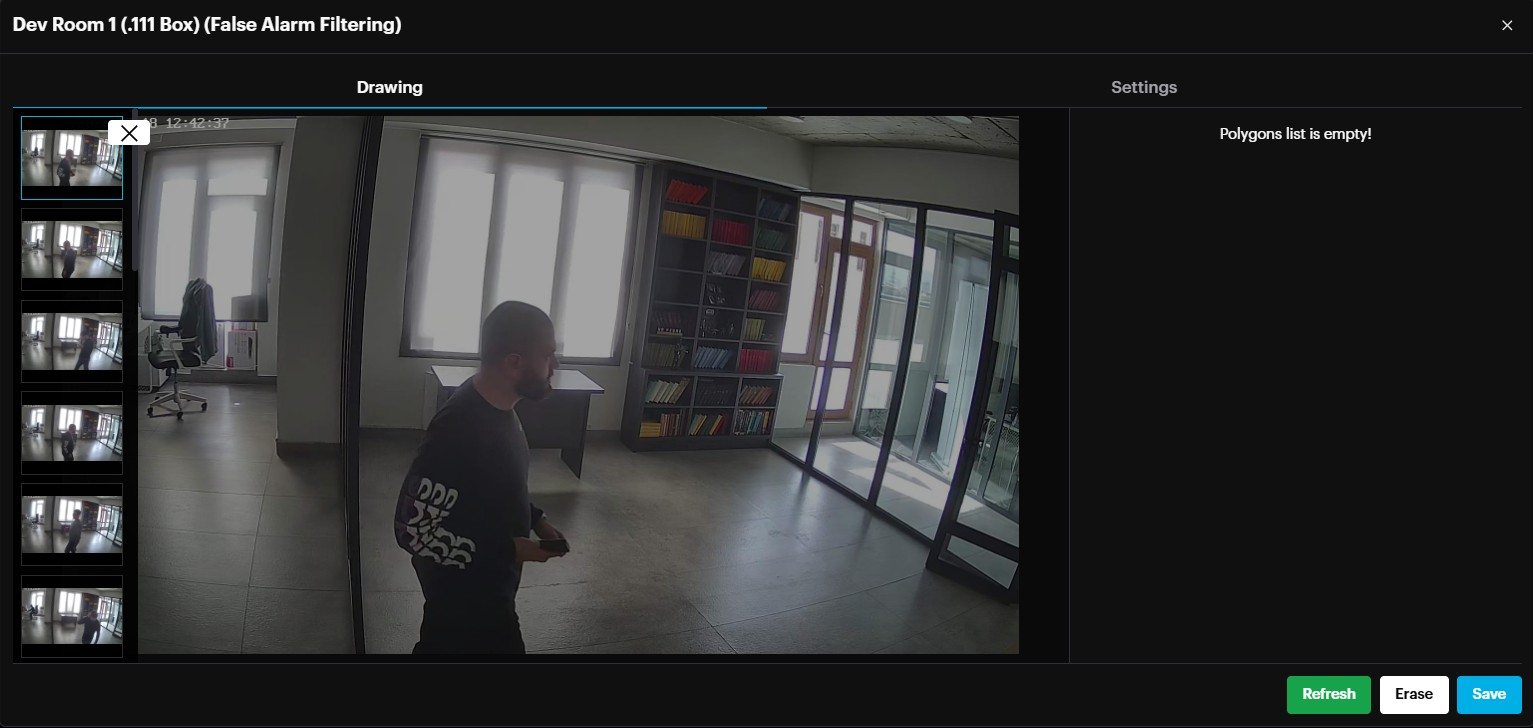
Coordinates
Here you can Draw coordinates for your cameras, which means you will receive the alarms from the zone which you drew for the camera.
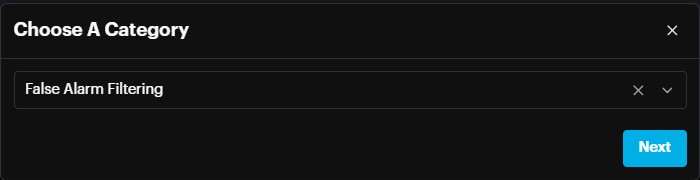
Choose the desirable camera click on three-dots button and click Settings.
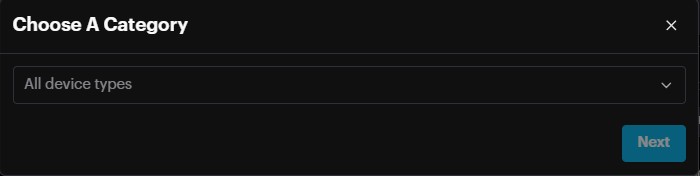
Choose the Category and click Next.
Left-click on the desired starting point for one line, then hover your mouse to the desired ending point and left-click. Now you have drawn one line. Repeat this process to create detection zones in your camera’s frame. Click Erase to delete all zones. Click Refresh to refresh the stream.
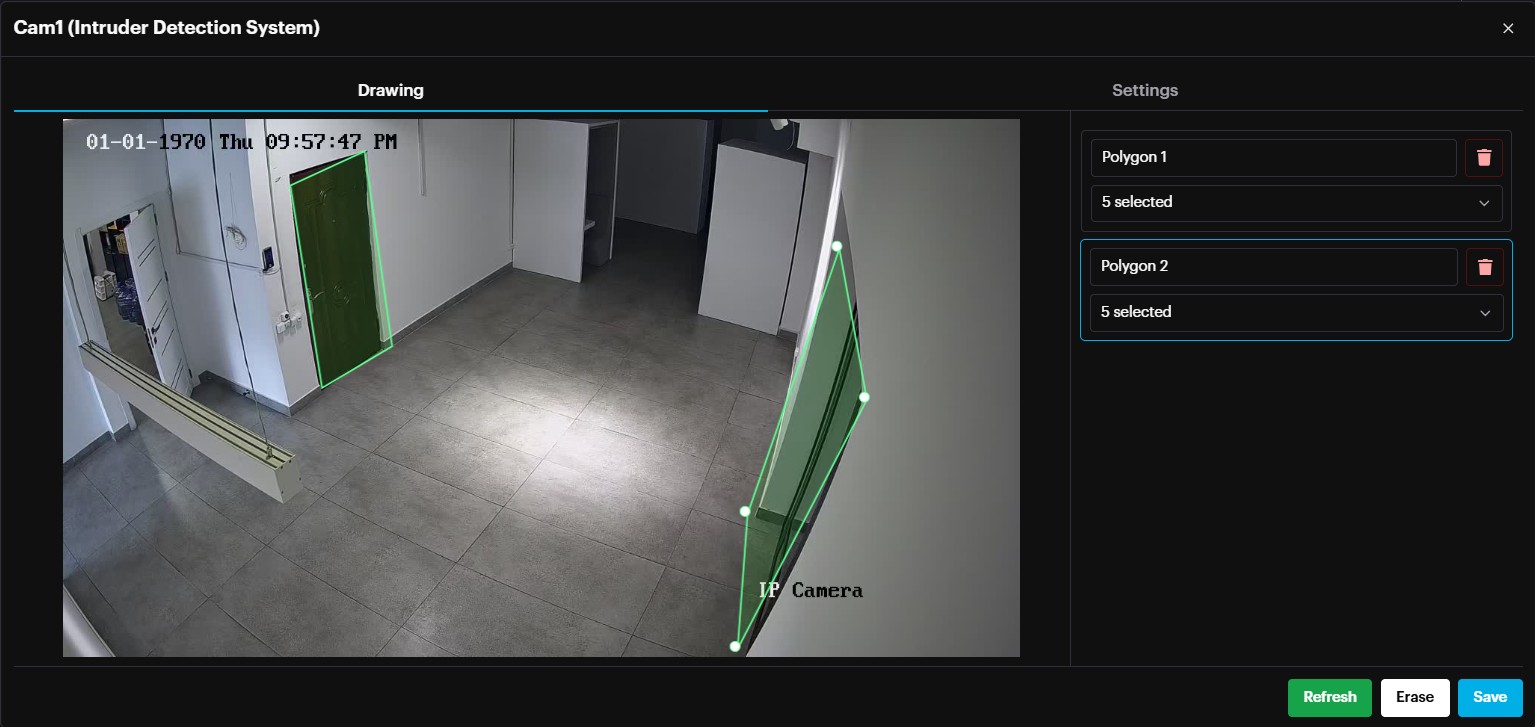
On the right side, the drawn zones (polygons) appear. It is possible to name the zones(polygon) and delete.
Click Save to save all drawn zones.
If the displayed frame is unclear or too dark (e.g., captured at night), click the Select Frame button. This will show a list of previously detected frames. Choose a clearer frame from the list to define the active area.
False Alarm Filtering
Residential Setting per Camera
A new "Residential" setting has been added to optimize detection accuracy and reduce false positives.
Navigate to the Hardware page and click on More Options then Settings.
Select the False Alarm Filtering module
A window will appear. Go to the Settings tab, where you will find the Residential Setting option
By default, this setting is OFF to maintain high sensitivity for long-range detection, but users can toggle it based on the following scenarios:
Outdoor Monitoring
Long-range monitoring (small intruders, 30-45 pixels): Keep the Residential setting OFF to detect distant objects.
Close-range monitoring (larger intruders, 50+ pixels): Turn the Residential setting ON to minimize false positives.
Indoor Monitoring
For indoor environments with generally larger objects, it is recommended to turn the Residential setting ON.
Summary:
Outdoor Long-range/Small objects: Residential = OFF
Outdoor Close-range/Large objects: Residential = ON
Indoor Monitoring: Residential = ON
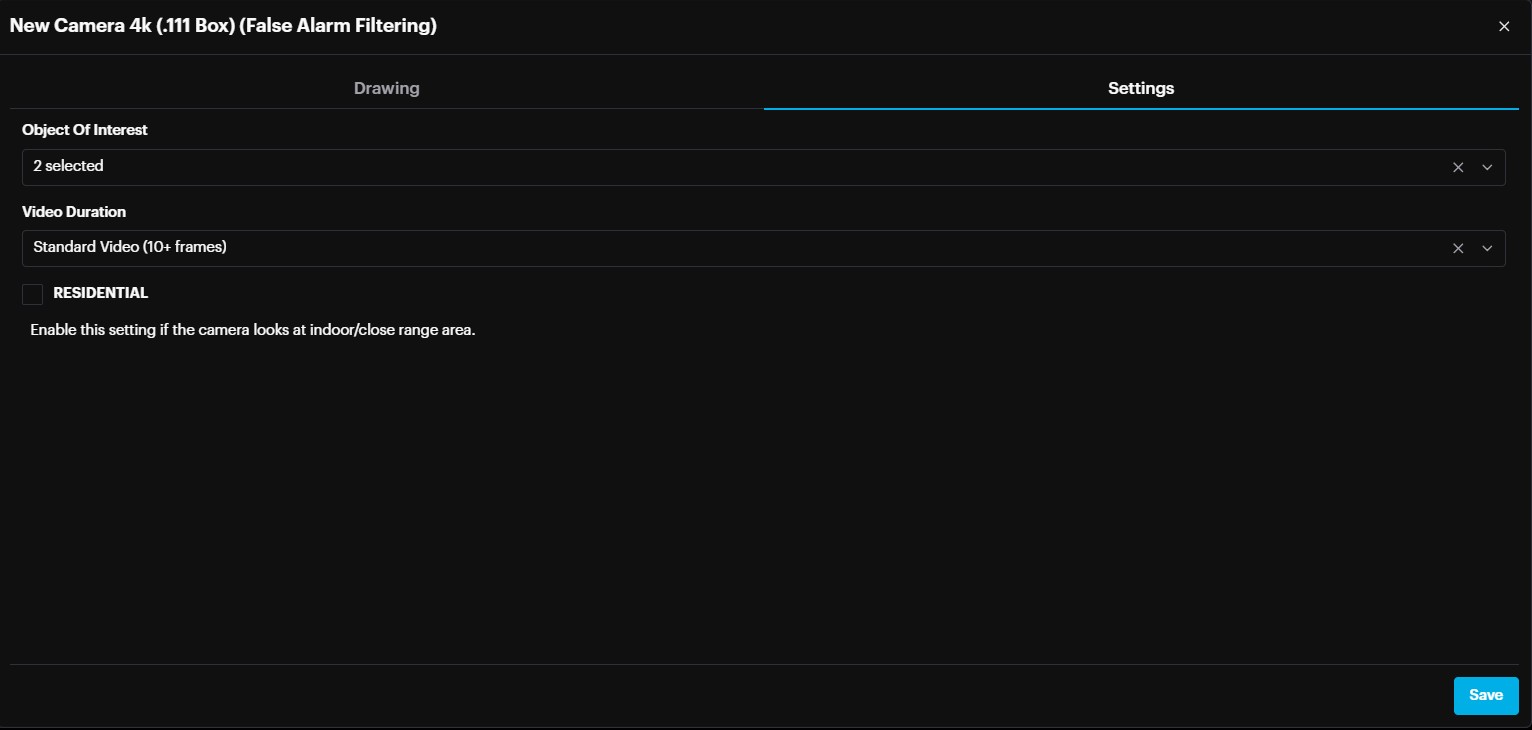
Source Type Specification Based on Video Duration
Users now need to specify the video source type based on its length per camera.
Navigate to the Hardware page and click on More Options
Select the False Alarm Filtering module
A window will appear. Go to the Settings tab, where you will find the Residential Setting option.
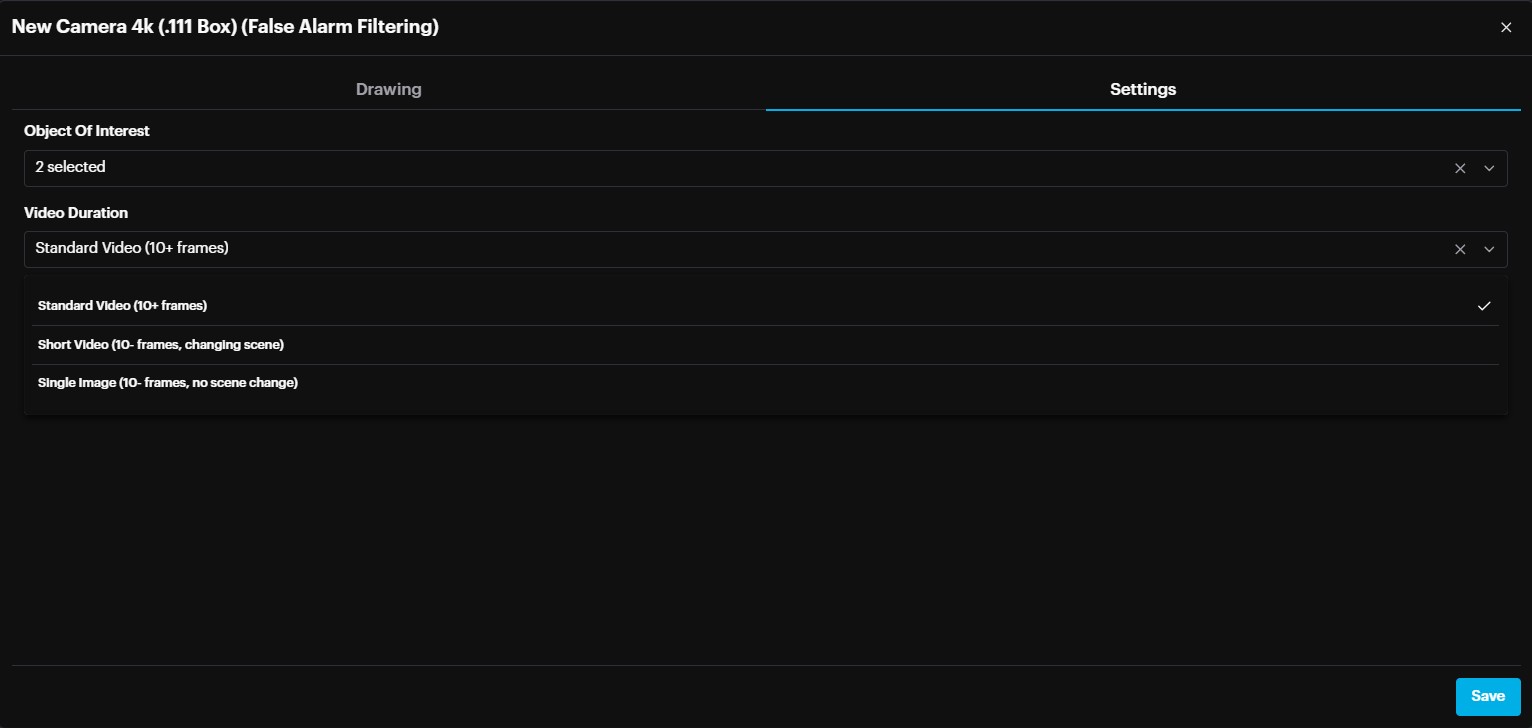
The options are:
- Standard (10+ frames): Offers the highest accuracy for motion detection and tracking. Recommended for NVR integrations and immix.
- Short video (2-9 frames): Motion detection and tracking are slightly less accurate but suitable for SMTP or Sentinel integrations.
- Single Image (1 frame or repeated frame): Motion detection is disabled, and only objects in the first frame are detected.
For Standard and Short video durations, the person's height should be at least 4% of the frame height (in pixels).
For single images, since there is no motion detection and the accuracy is lower compared to the other modes (Standard and Short), the person's height should be at least 8.3% of the frame height (in pixels).
Multizone OOI for IDS
For Intrusion detection module it is possible to select different Object of Interest(s) (person, car, truck, motorcycle, bus) for each zone/area/polygon drawn (e.g. zone1 to detect person only whereas zone2 to detect car only).
To do this, click the zone/area/polygon drawn on the left side and on the right side this polygon setting is marked. Now choose the required Object of Interest(s) from the drop-down list.

Each area/zone/polygon can trigger a different external endpoint in the event rules.
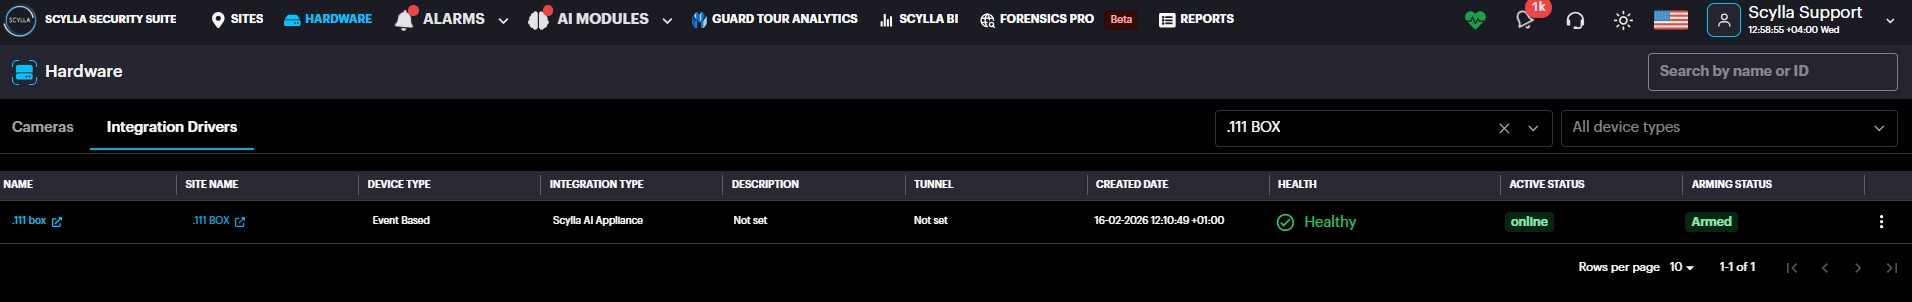
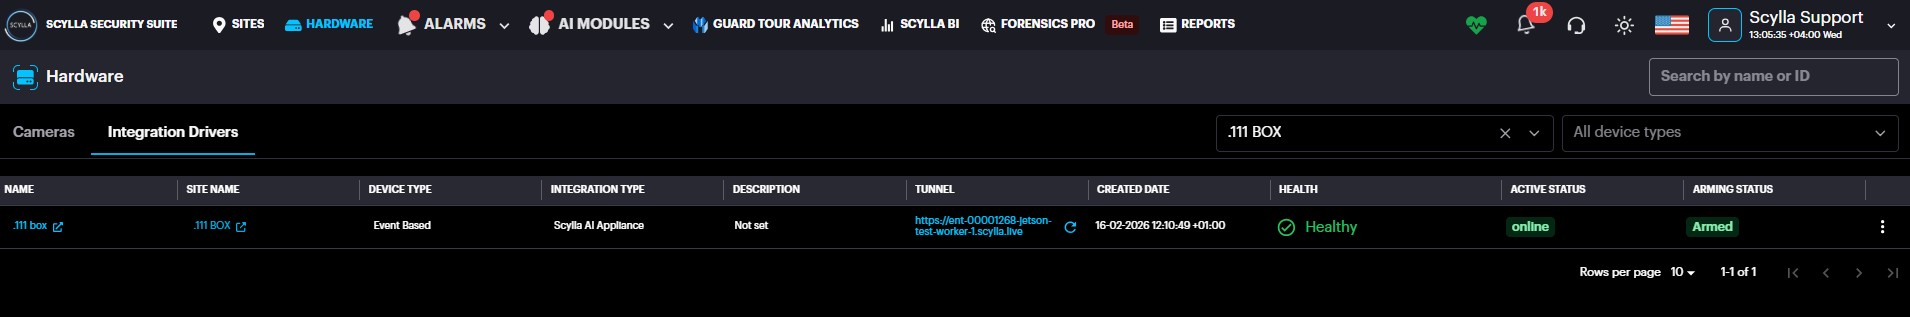
Scylla Asteria Box Remote Access
It is possible to remotely access the Asteria box and manage it through the cloud dashboard. Moreover , the current active and arming statuses of the Asteria are also displayed on this page.
Navigate to Integration Drivers tab and the record related to Scylla Asteria Box will display the active status (online, offline) and Arming status (armed, disarmed).
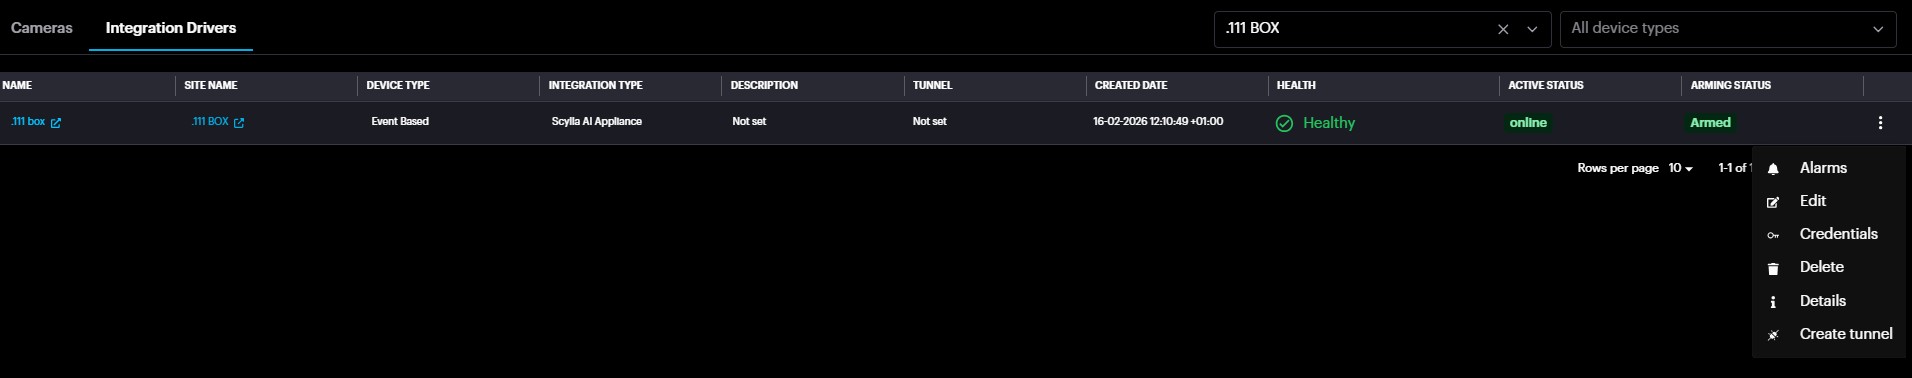
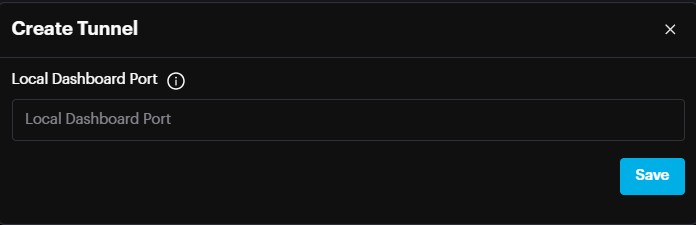
To manage Asteria devices directly from your cloud account ,click on the three-dot menu and select Create Tunnel.
A window will appear prompting you to enter the port number for tunnel creation. By default, port 80 is used. If the port has been changed on the Asteria device, you must enter the same port here. If left blank, port 80 will be used automatically.
This action will create a tunnel, and the corresponding URL will appear under the Tunnel column.
Please note that the tunnel will remain active for 1 hour.
When you hover your mouse over the tunnel URL, a message appears indicating the expiration time.
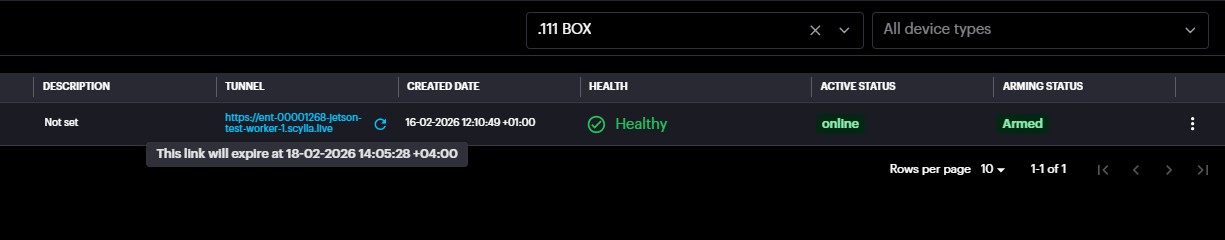
Click on the Tunnel URL to open the Asteria Dashboard.
Alarms
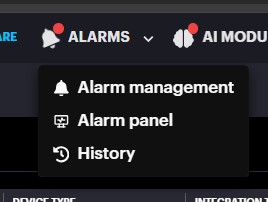
Alarm Management
Alarm Management dashboard allows to:
● see all alarms from all integrated devices with detailed information;
● see the snapshot of the detection occurrence;
● see the recording of the alarm (if available);
● acknowledge, Dismiss, Marks as False and Share the alarm;
● search by alarm ID, Event Type and Labels;
● sort alarms by date or a period of time.
Select the desired alarm. You can see the snapshot of detection occurrence, and a recording (if available).
In the Details section you can Acknowledge, Dismiss, Mark as False and Delete, the detection occurrence by clicking on the corresponding buttons. You also can disarm the camera or site for detections by clicking icon and share the alarm by clicking icon.
To filter alarms by date/time, site, label, or camera, click the Filter button.

Select the filters and click Apply Filters.
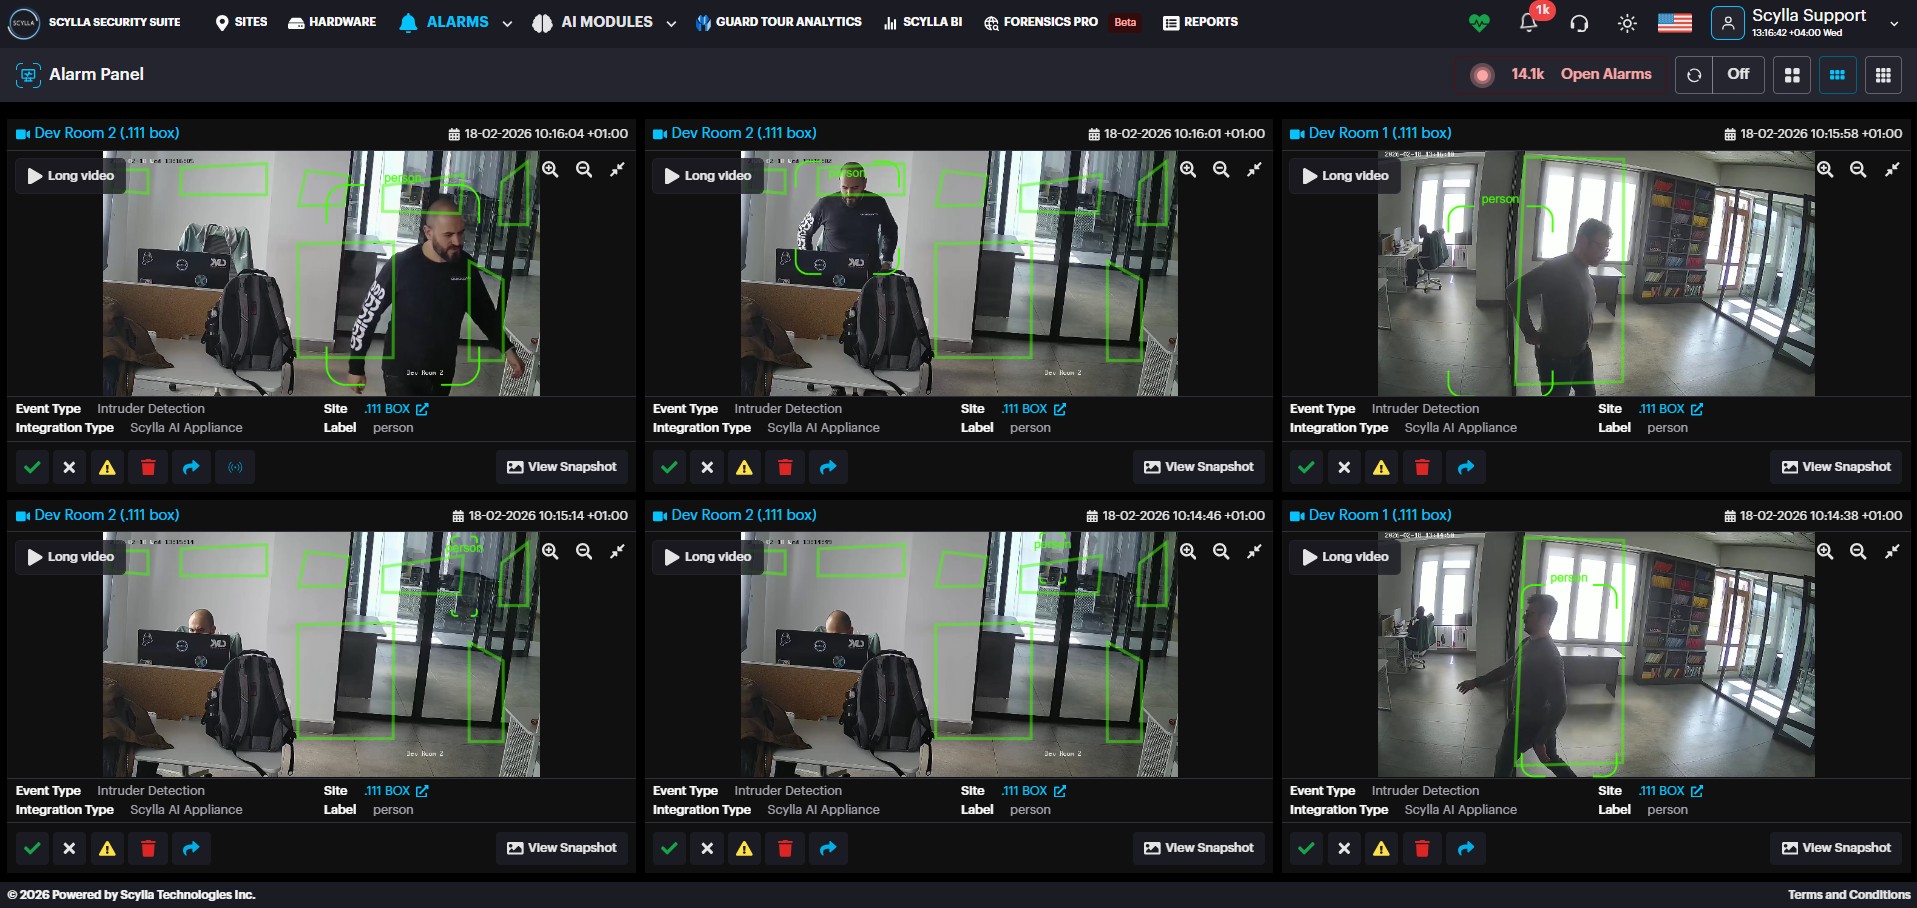
Alarm Panel
Alarm Panel allows you to check up for the incoming alerts in real time, the new alarm(s) will flash red once it comes into Alarm panel. Here you also can Acknowledge , Dismiss , Mark as False , Delete or Share the detection by clicking on the corresponding buttons underneath the alarm.
History
Click on the History button to open the Browse Alarms History page but without having a specific site’s alarms history preselected in the Quick Filters menu.
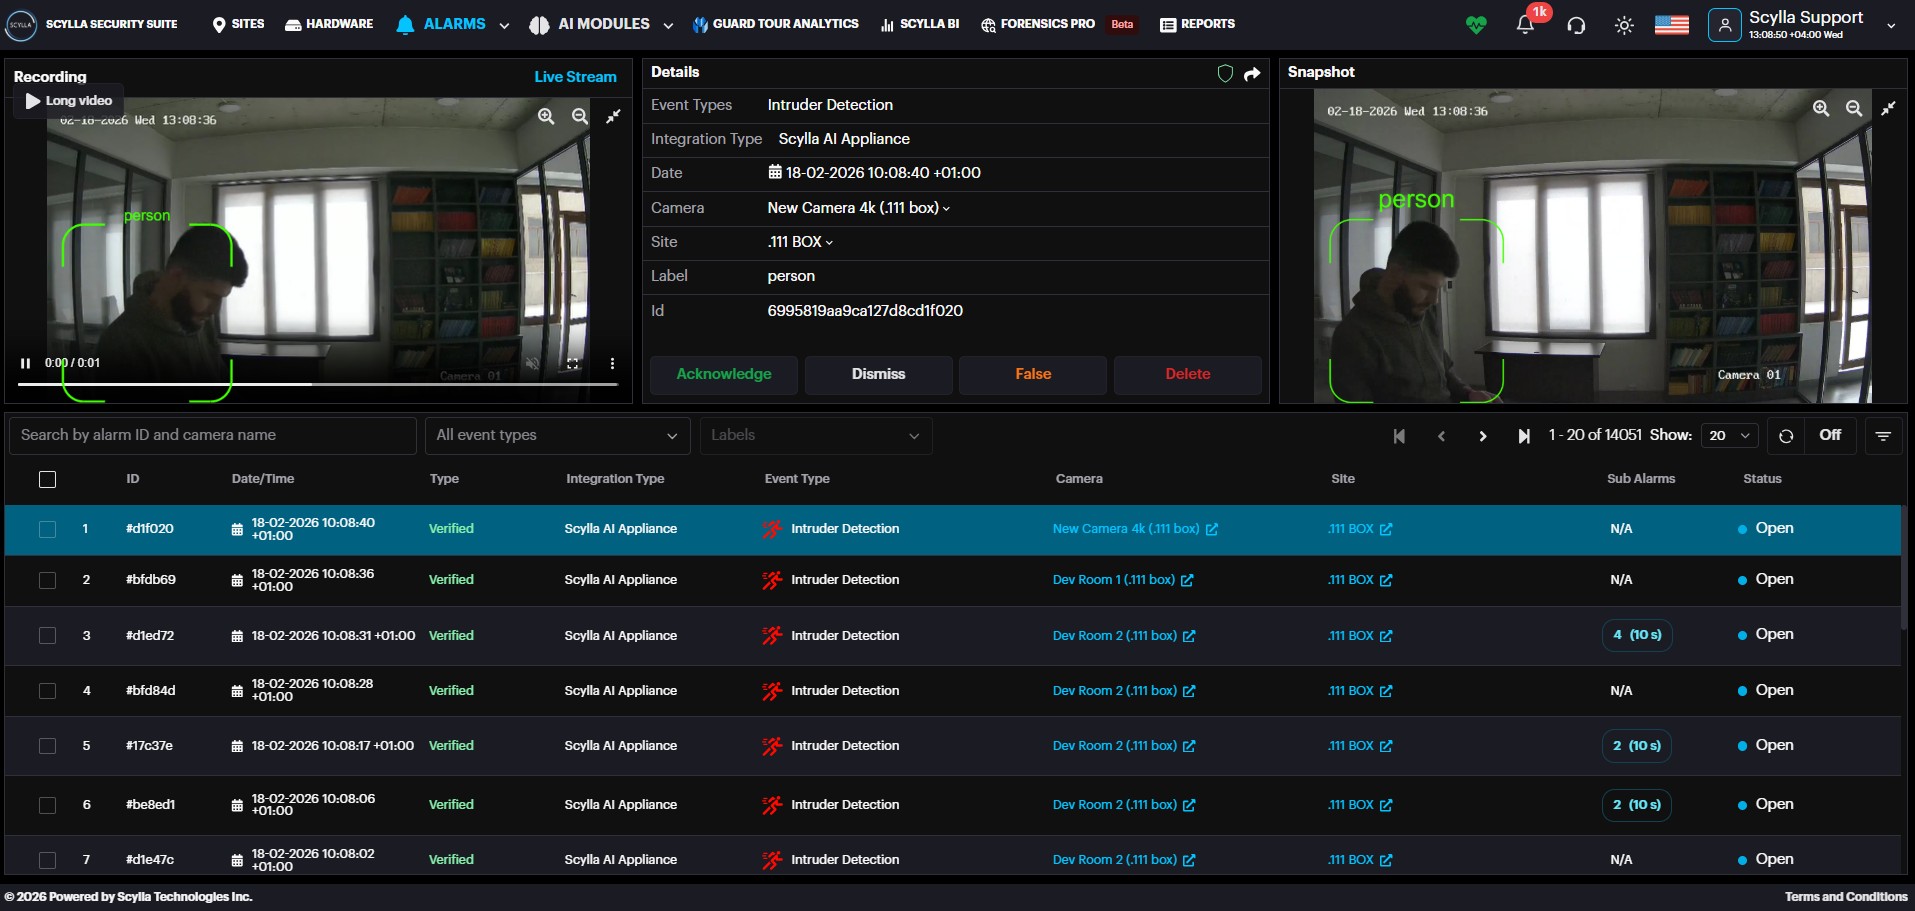
Vanguard Alarm Management on Cloud
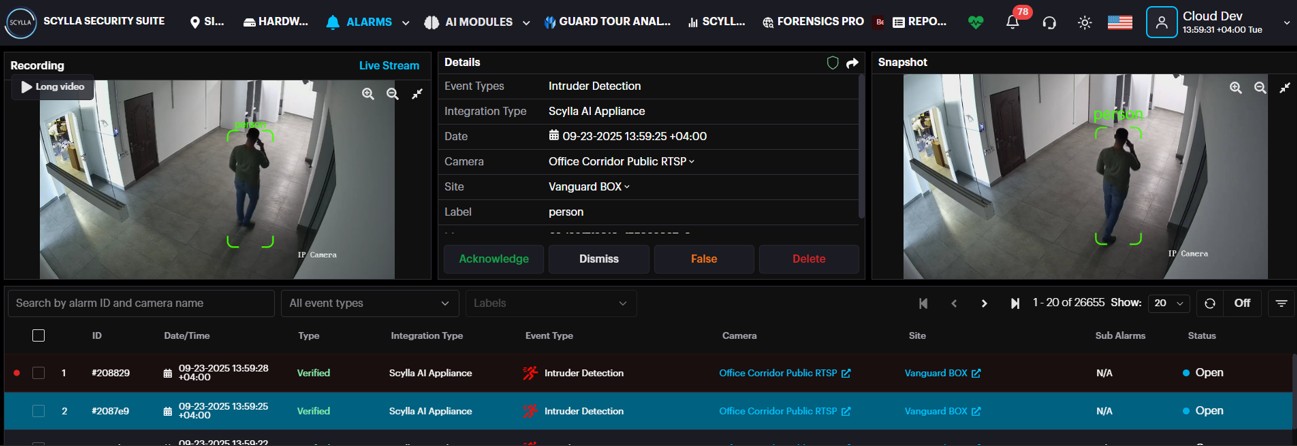
On the Alarm Management page, you'll see alarms from your Vanguard box.
When an alarm is triggered, the left window will display a video of the detection and right window the snapshot of the detection, with the middle window displaying the alarm information.
Live Stream with Instant playback
To view the camera's live stream, click the Live stream button in the left Recording window.
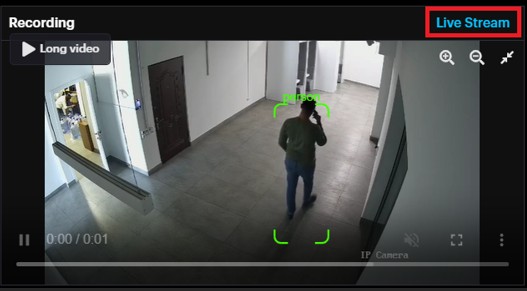
Live Stream window is displayed.
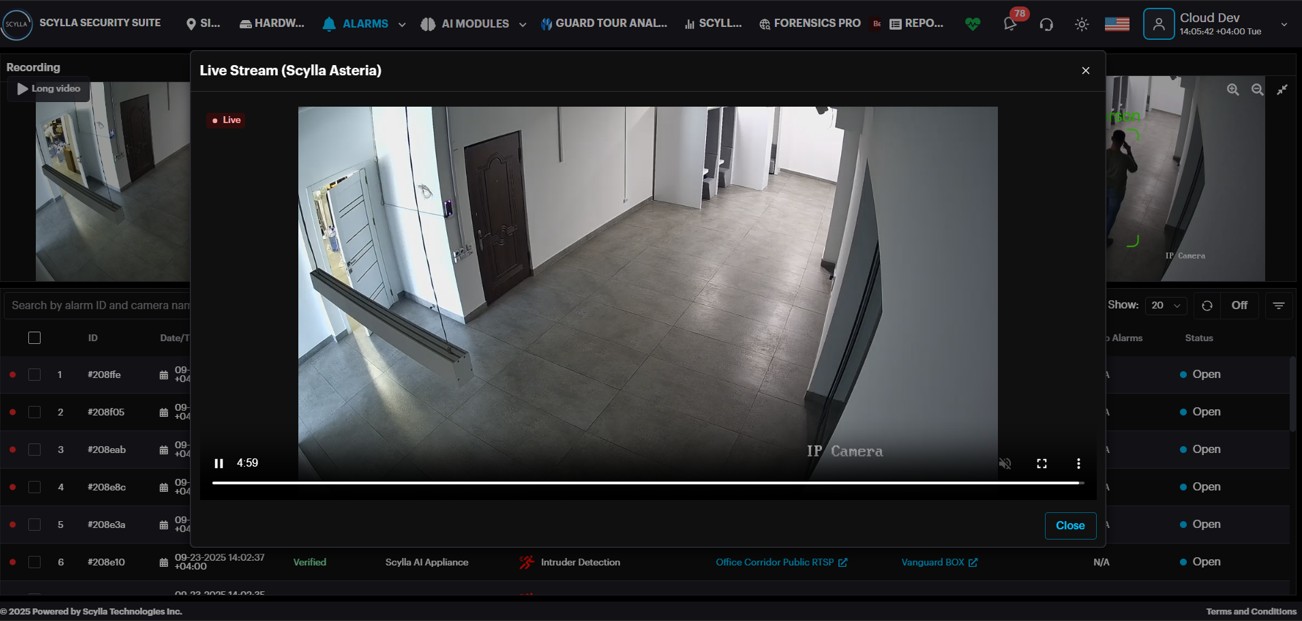
View the live stream with a timeline of the last five minutes recording, allowing you to quickly review recent activity. It is possible to display the stream in full screen mode.
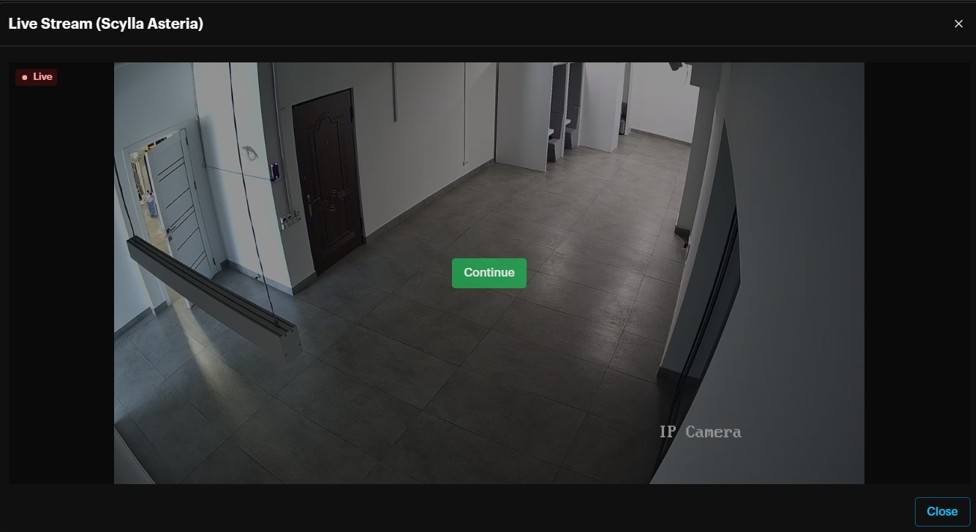
To save resources, the live stream will pause after 30 seconds of inactivity. You'll see a notification asking if you want to continue.
Click "Continue" to keep watching the live stream.
If there is no response after 10 seconds, the stream will automatically close.
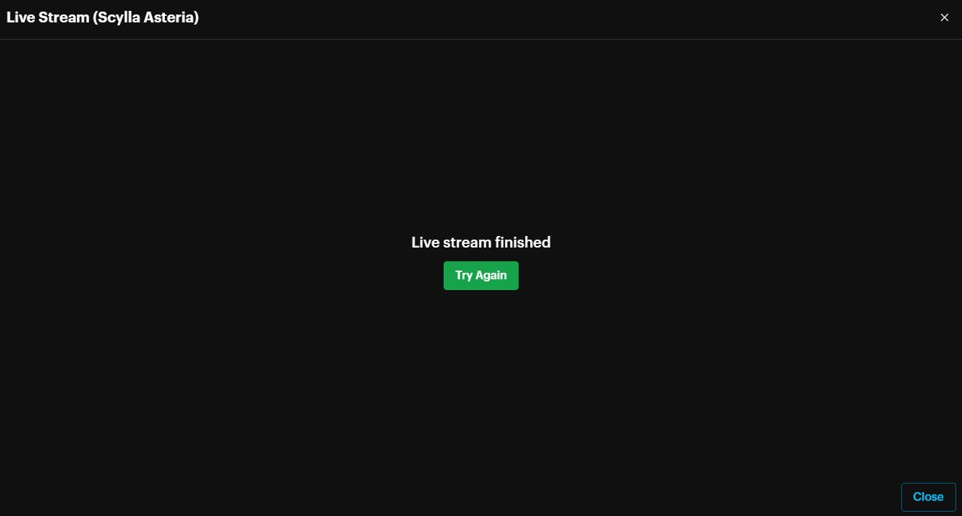
Clicking Try again will start live stream again.
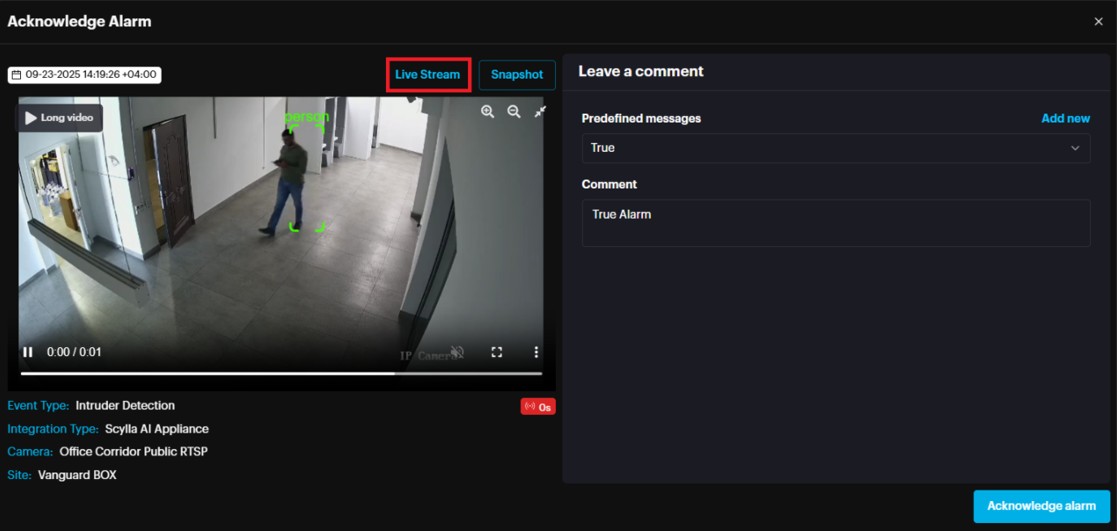
Live stream with instant playback is also displayed in the acknowledge alarm window.
Once the user clicks the acknowledge alarm button , in the acknowledge alarm window there will be the option to view the live stream with instant playback to check before acknowledging the alarm
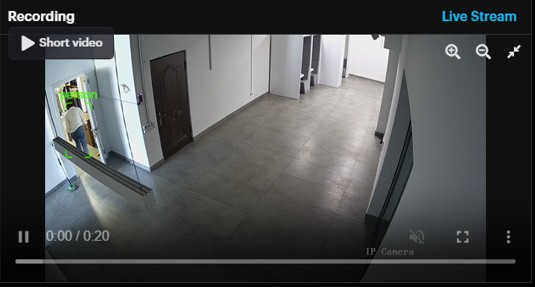
Pre/Post event alarm recording
In addition to the short detection video and snapshot, the alarm includes a longer detection video clip. This is the pre- and post-detection footage, with the length determined by your settings.
Pre- and post-detection video duration is determined from Profile à PreferencesàExtended alarm clip duration.
Clicking the long video button displays the pre- and post-detection video.
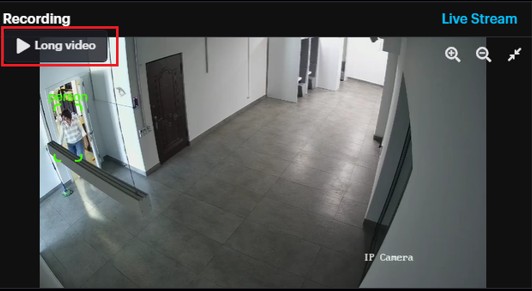
Long video can be accessed from the Alarm History page too.
Alarm Limit & Alarm Rate for False Alarm Filtering
Alarm Limit
Alarm Limit is determined by the subscription Tier, which specifies the maximum number of alarms allowed per camera per day for a normal system operation.
Scylla alerts when the alarm count for camera(s) exceeds 75% of the limit , enabling the user to take action to reduce the number of alarms and prevent reaching the 100% limit.
Once 75% of limit is reached , a red banner is displayed on the dashboard.

To view the camera(s) that have exceeded 75% of the limit, click on the View Report.
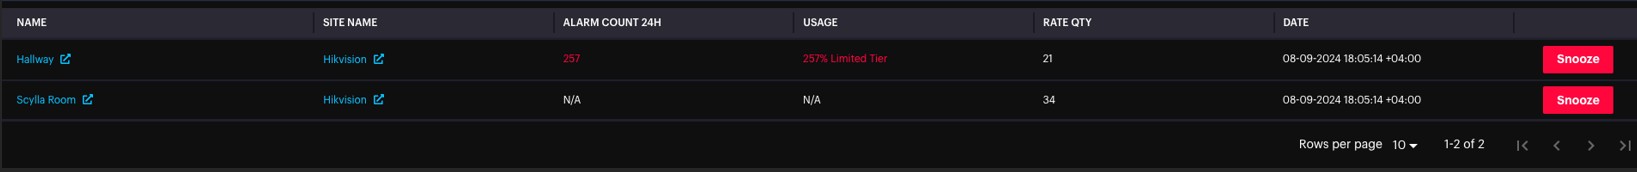
Under “Alarm count 24h” the user can see the alarm count of the camera for that day and “Usage” which is the rate of alarms based on the limit tier.
To activate auto-snooze , click the Activate auto-snooze button which will auto-snooze these cameras for 3 hours.
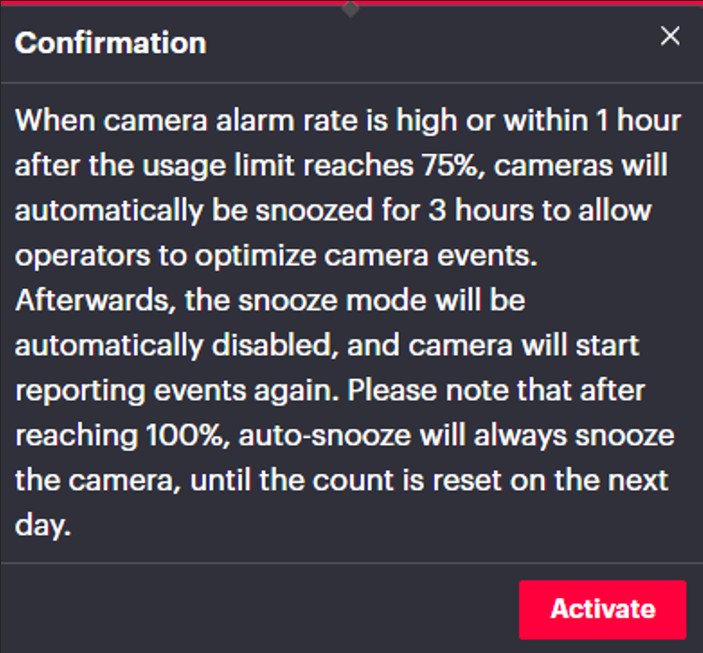
If auto-snooze is not activated, there is the possibility to manually snooze camera(s) within the report page and take actions to reduce alarms from these cameras by checking the active zones, motion sensitivity or creating schedules.
Alarm Rate
Alarm Rate is a feature that provides early notifications of abnormal alarm count from camera(s), helping users to take actions as early as possible to prevent the system from reaching its limit and causing a queue.
Alarm Rate is checked every 5 minutes by the system and once the rate passes a specific value calculated by the system, a red banner is displayed.

To activate auto-snooze, click the Activate auto-snooze button which will auto-snooze these cameras for 3 hours.
View Report displays the top 5 cameras at most that have exceeded the rate value.
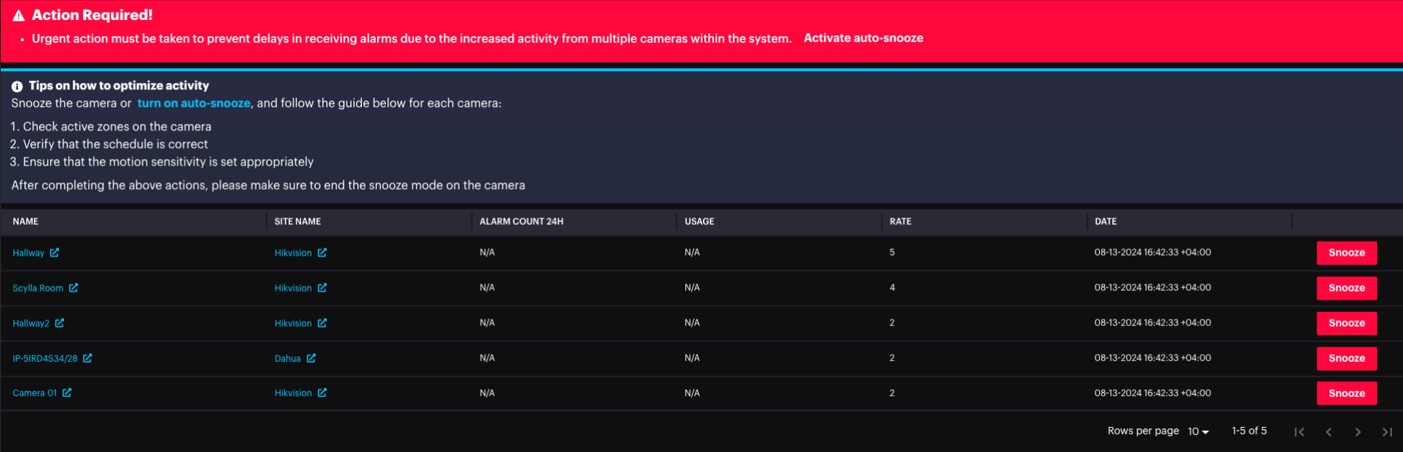
Under “RATE” column the last 5-minute alarm count from the camera is displayed.
Users can manually snooze the camera and follow instructions mentioned on top of the page to reduce alarm count such as Check activity zone on the camera etc.
It is possible to hide the banner by clicking the X button.
Once closed an icon will be added on top . Clicking the button will make the banner re-appear.

Boost
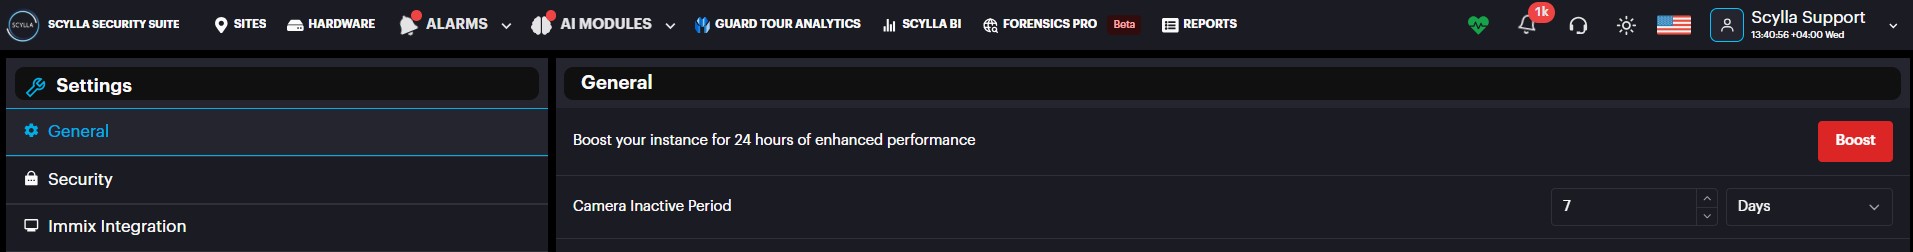
If there is a delay in receiving alarms on the dashboard due to an alarm queue, a BOOST option is available on the Settings page. Use this option only when necessary, as activating it will book additional instances for 24 hours, which will result in extra charges.
To activate Boost, go to the Account menu, select Settings, and then navigate to the General tab.
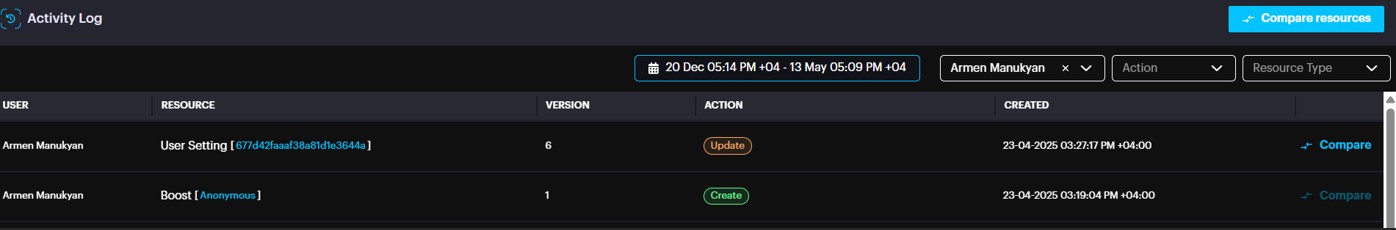
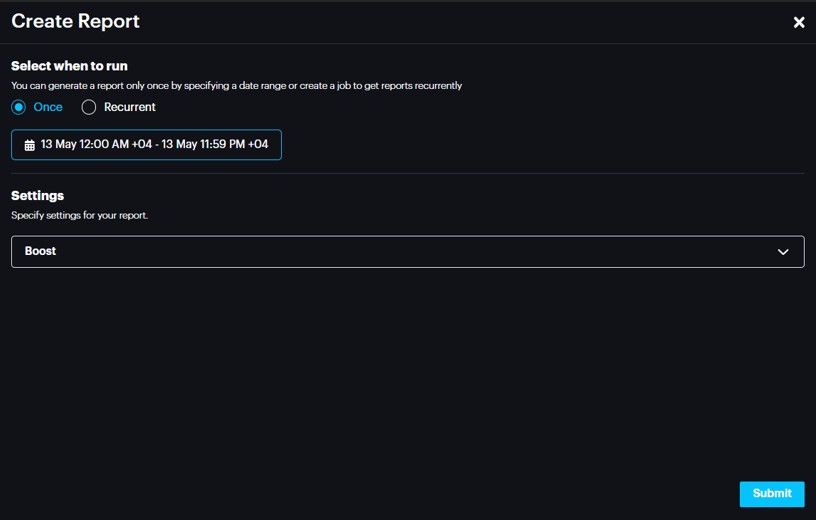
All Boost actions are recorded in the Activity Log, including the user who initiated the Boost and the exact date and time. Additionally, a Boost Report is available on the Reports page, detailing the number of instances booked and their corresponding timestamps.
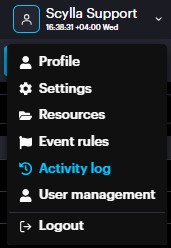
Navigate to the Account menu and select Activity Log
Go to the Report menu, click on Create Report, then choose Boost as the report type.
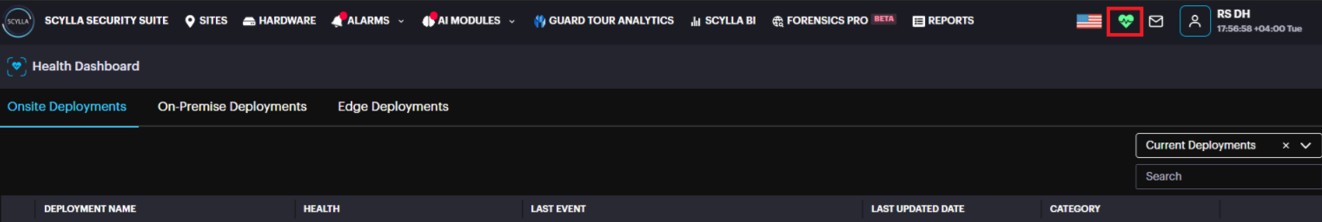
Healthcheck
Scylla's health check feature is a useful tool for monitoring the status and performance of devices that are connected to the cloud account.
The system provides comprehensive Healthchecks across multiple levels to ensure optimal performance:
- Camera level
- NVR (Network Video Recorder) level
- On-premise Server or Edge Device level
Camera Health check
You can enable the health check feature for all event type cameras connected to your system.
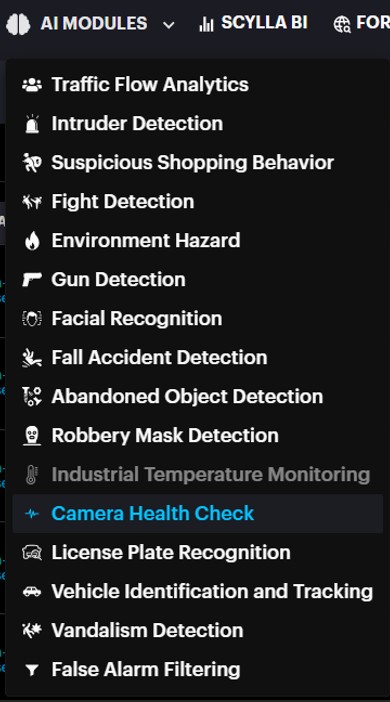
To enable Camera Healthcheck:
- Navigate to AI Modules.
- Select Camera health check.
Camera level health check includes Tampering & Scene change detection.
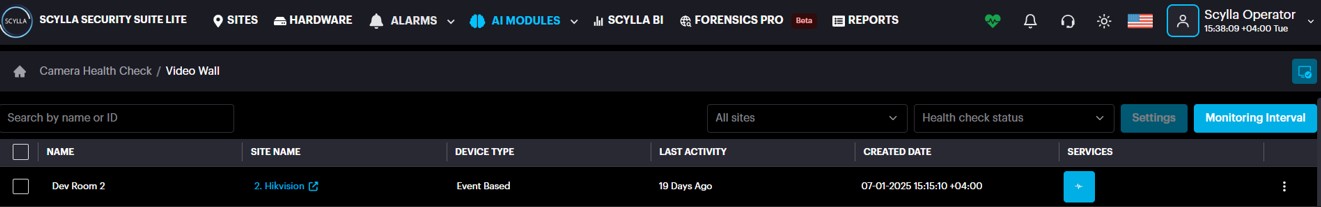
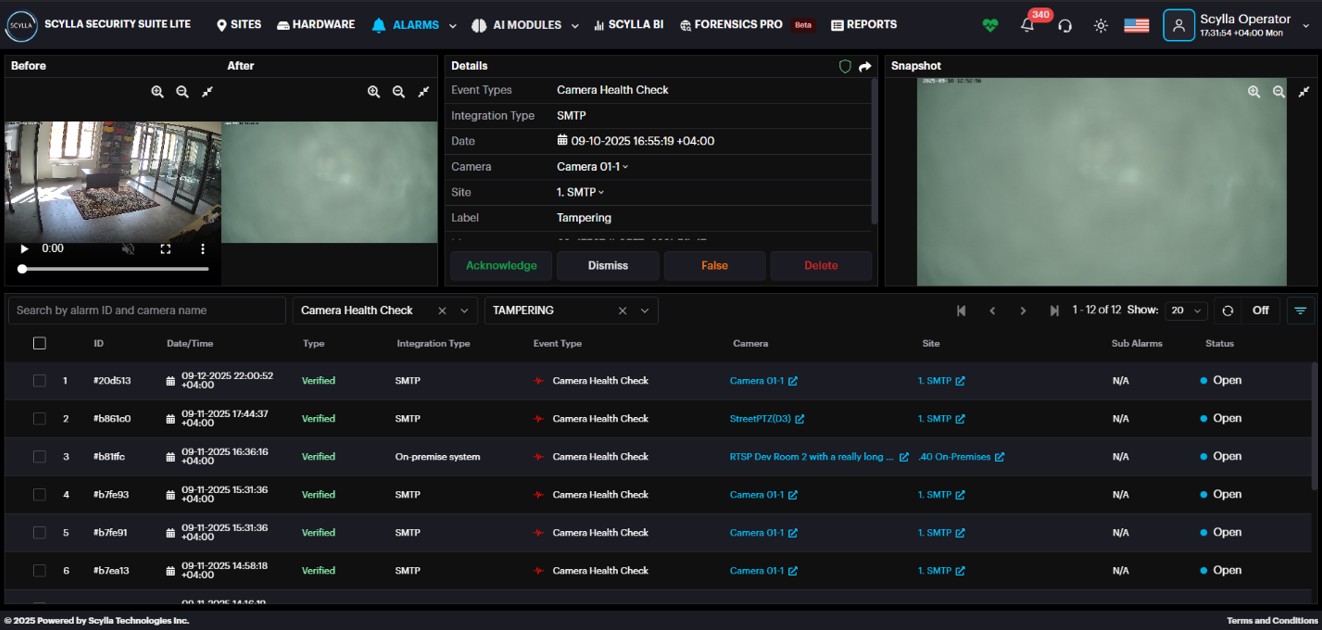
The list on this page displays all Event Type cameras currently integrated into the system. An Event Type camera is defined as any camera connected using specific integration methods, which include SMTP, a VMS plugin, NVR SDK, or one that is synced via an On-premise server or Edge device, in addition to other supported methods.
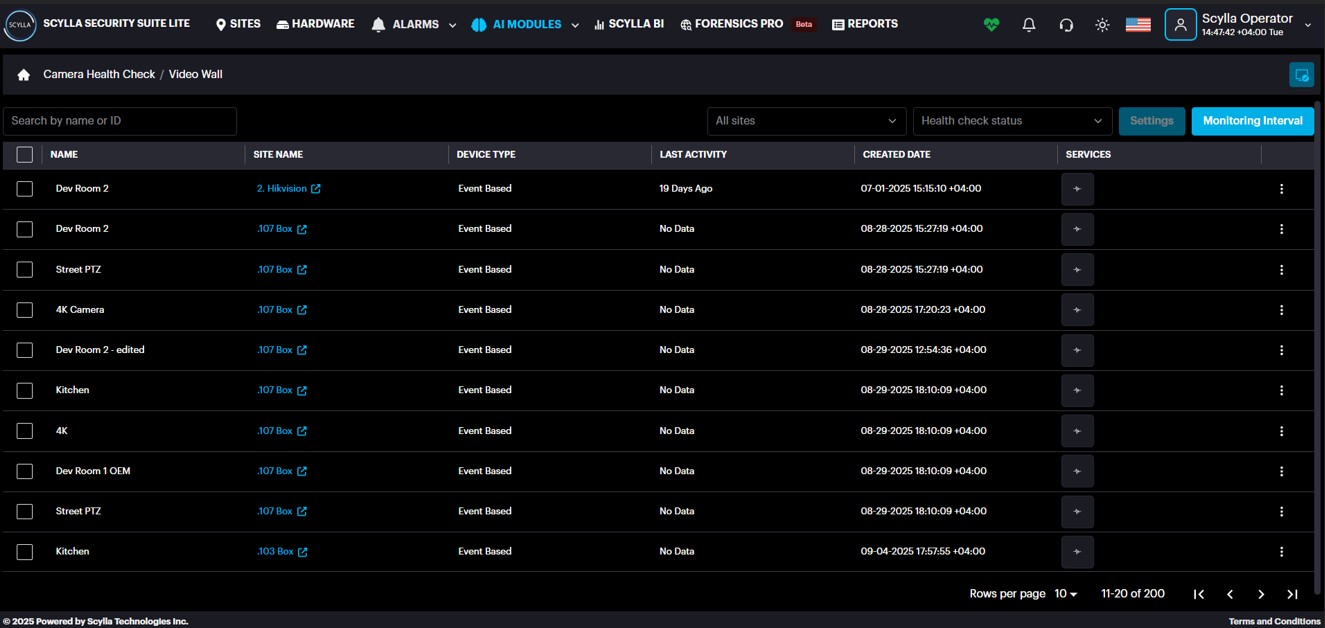
You must first enable the camera's services before accessing its settings. Click the Services icon (it will turn blue) which means enabled.
Now click the three dots and Settings.
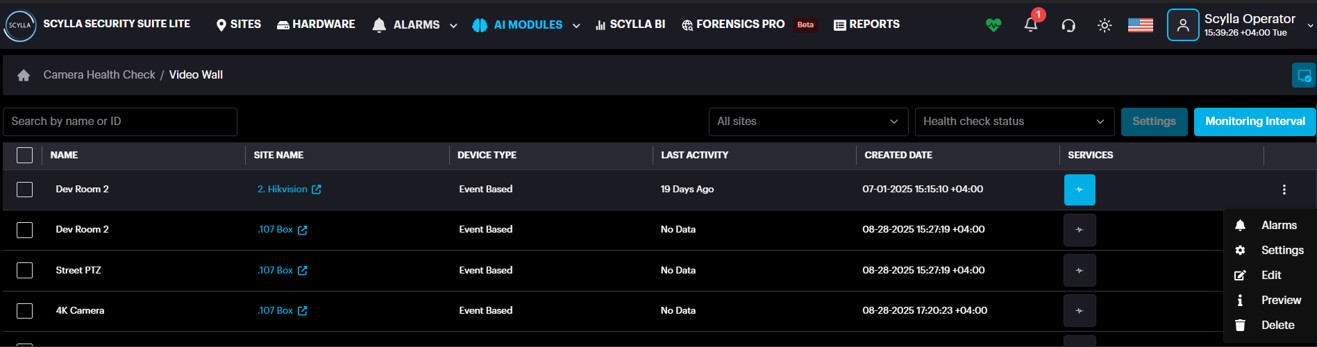
In the Settings window , enable the desired health check(s) .
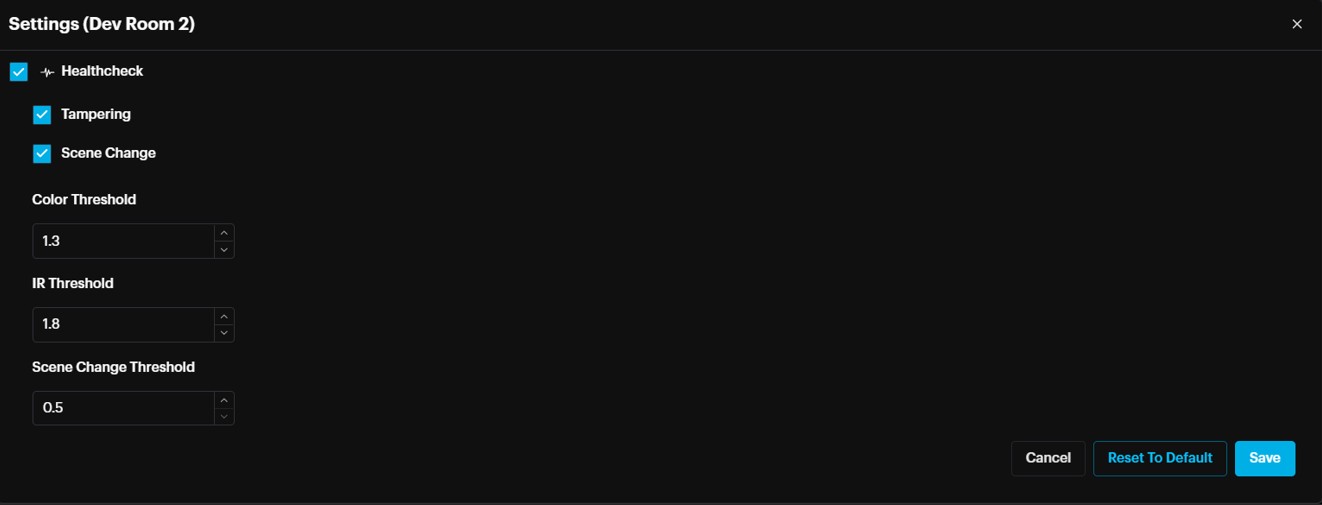
It is recommended to use the default threshold settings.
Click Save.
Final step is to set the monitoring interval . This value determines how frequently the system compares frames to detect scene change or tampering. If its set to 5 minutes , the new alarm frame will be compared with frame received 5 minutes ago.
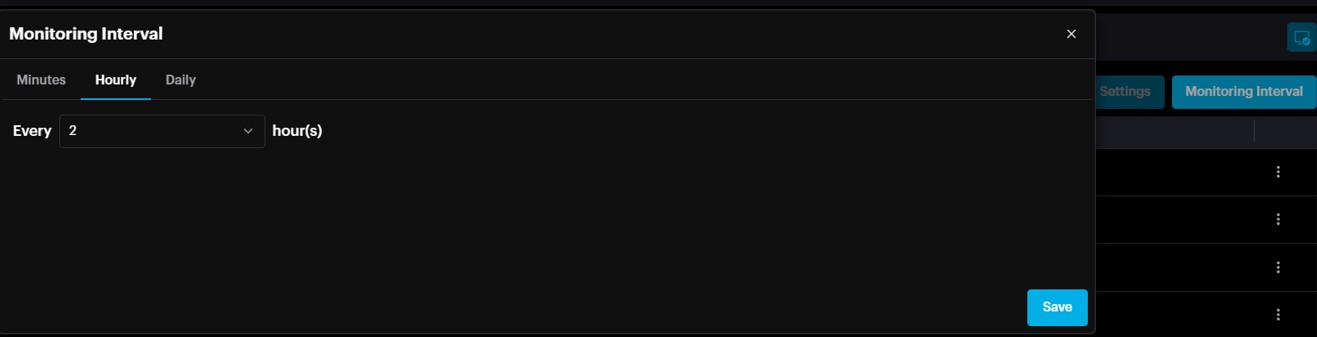
To set monitoring interval , click the Monitoring interval button and select the desired interval.
Alarms are rejected if no scene change or tampering is detected. If detection occurs, the alarm status is Verified.
Alarms will be triggered once there is a detection.
NVR Level Health check
Your NVR deployment appears on the Health Check page and can be expanded to show all connected cameras. The overall NVR health status is displayed at the top, next to the NVR record.
This top-level display highlights critical events such as a mismatched camera quantity , connection issues and more.
When you expand the NVR record, the list of connected cameras appears. Any specific camera health issues—including connection lost ,motion disabled and more—will be noted next to the respective camera.
In the absence of any issues, the health status will show as Healthy and OK.
For a complete list of all NVR and camera-related health events, refer to the dedicated reference manual.
On-premise and Edge Device Health check
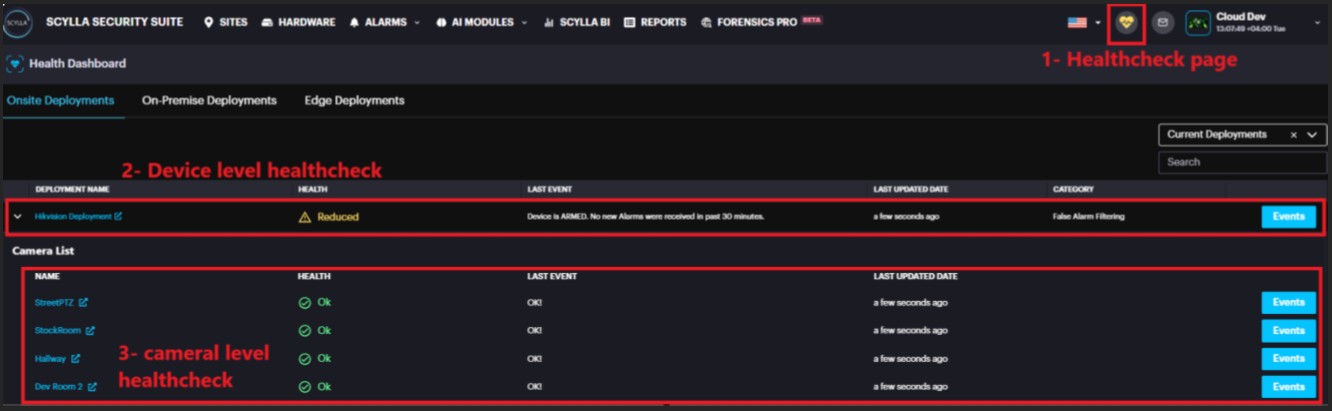
Onsite Deployments provide a health check overview of Hikvision and Dahua NVRs, along with their connected cameras that have been added to Scylla via SDK integration.
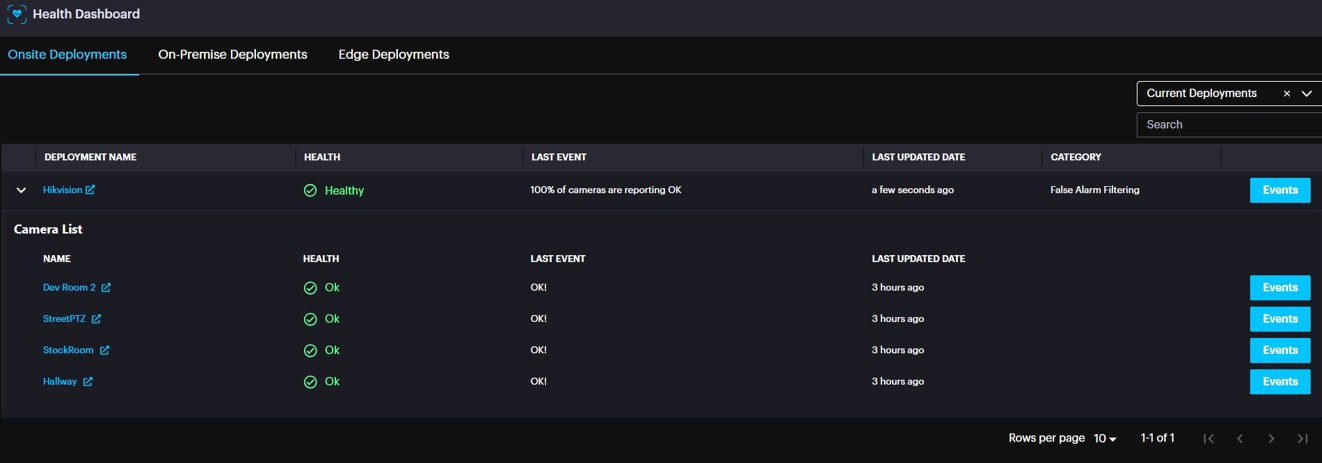
Detailed information about the types of events and messages displayed is available in a separate document.
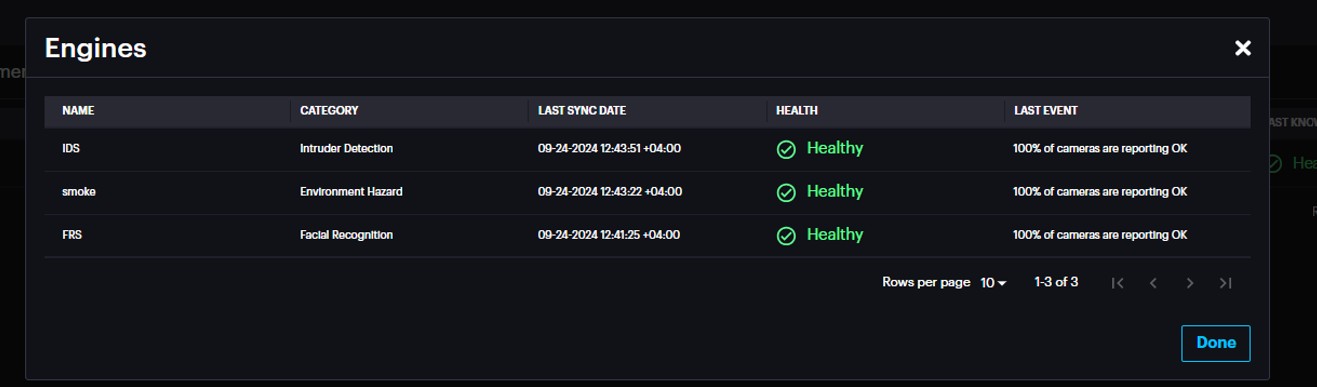
On-Premise Deployments health check page include details such as Last sync date, Active status, last known health status of On-premise servers synced with the cloud.
It also displays the health status of the Engines running on the server by clicking the Details button.
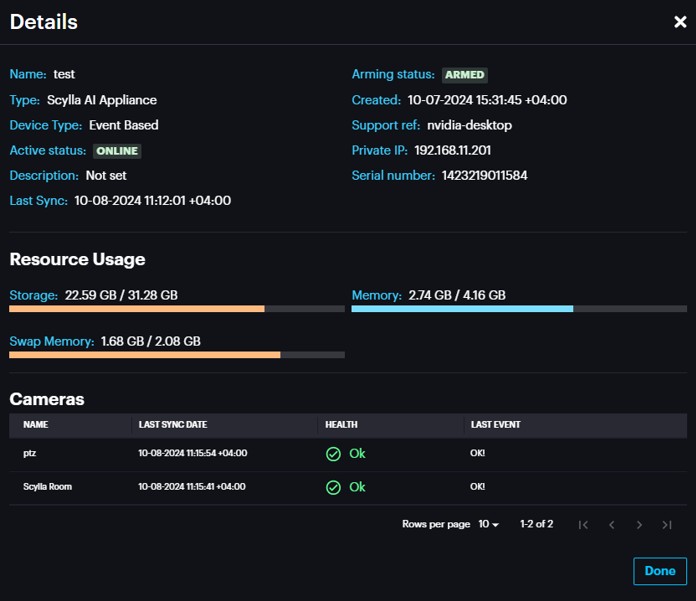
Edge Deployments health check page include Asteria device details such as Support Ref, Serial number, Private IP address, Health Status, Active status, Last synced date, arming status and resources status (memory, storage).
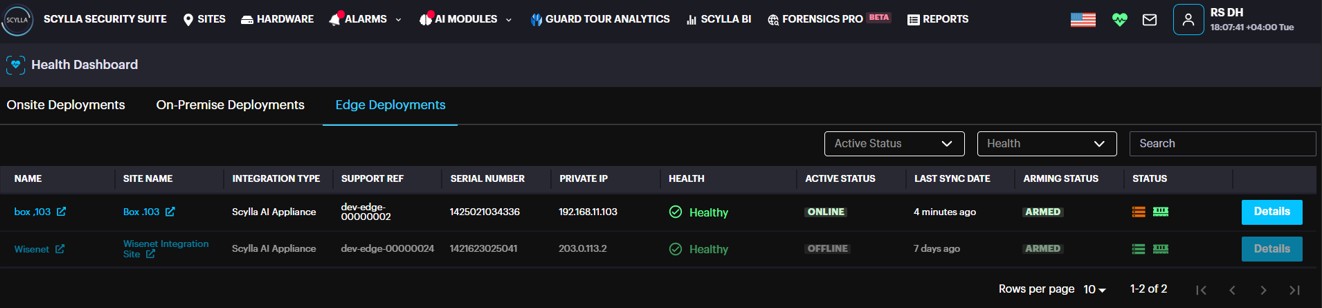
Clicking on the Details button provides further info about the device including Resource Usage and Camera health status.
Scylla BI
On the Scylla BI page you can see the amount of:
● Verified alarms
● Rejected alarms
● Acknowledged alarms
● Dismissed alarms
● Alarms
● Open alarms
On Totals windows you can see the amount of
● Sites
● Groups
● Integration Options
● Cameras
● Limited Tier (FAF Only)
● Top Tier (FAF Only)
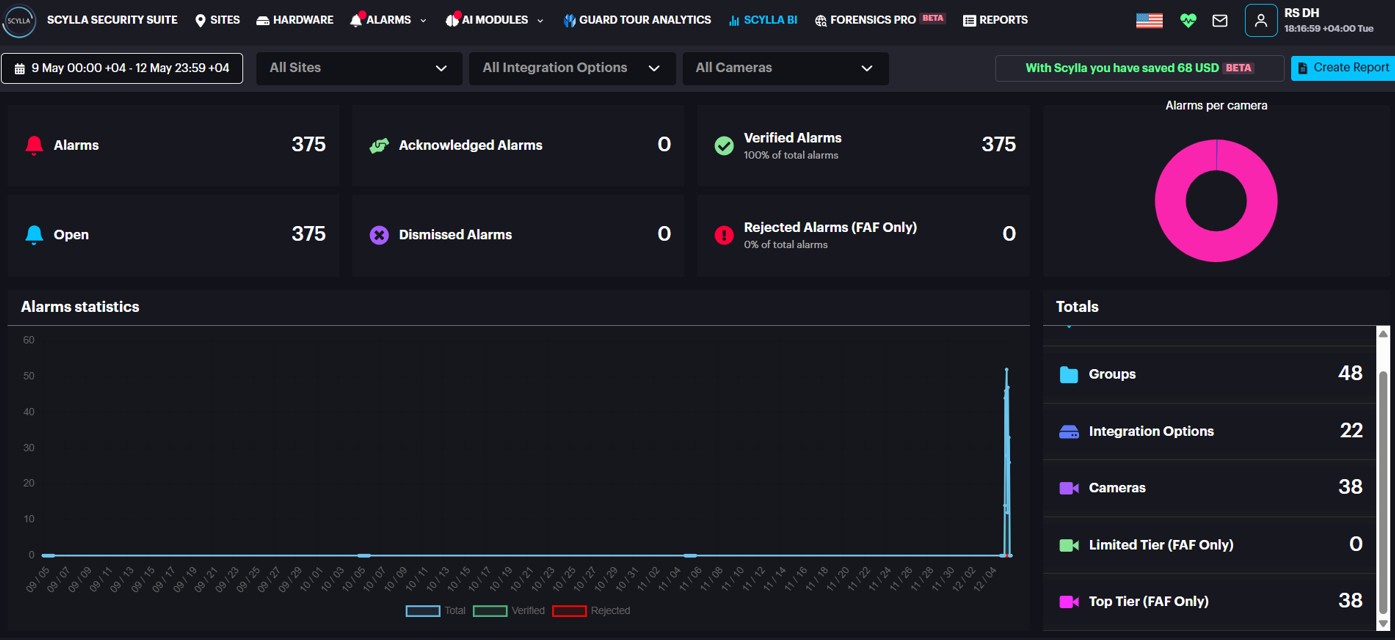
Limited and Top Tier modes are used exclusively for False Alarm Filtering and differ based on the number of events Scylla is set to process per camera each day based on Customer request. This page displays the number of cameras assigned to the Limited Tier and the Top Tier.
You can filter statistics by selecting a specific site, group, integration option, camera, and a time range (Today, Yesterday, This Week, Last Week, This Month, Last Month) or specify a Custom time range.
Graph displays a total number of alarms (blue), number of confirmed alarms (green), and number of rejected alarms (red).
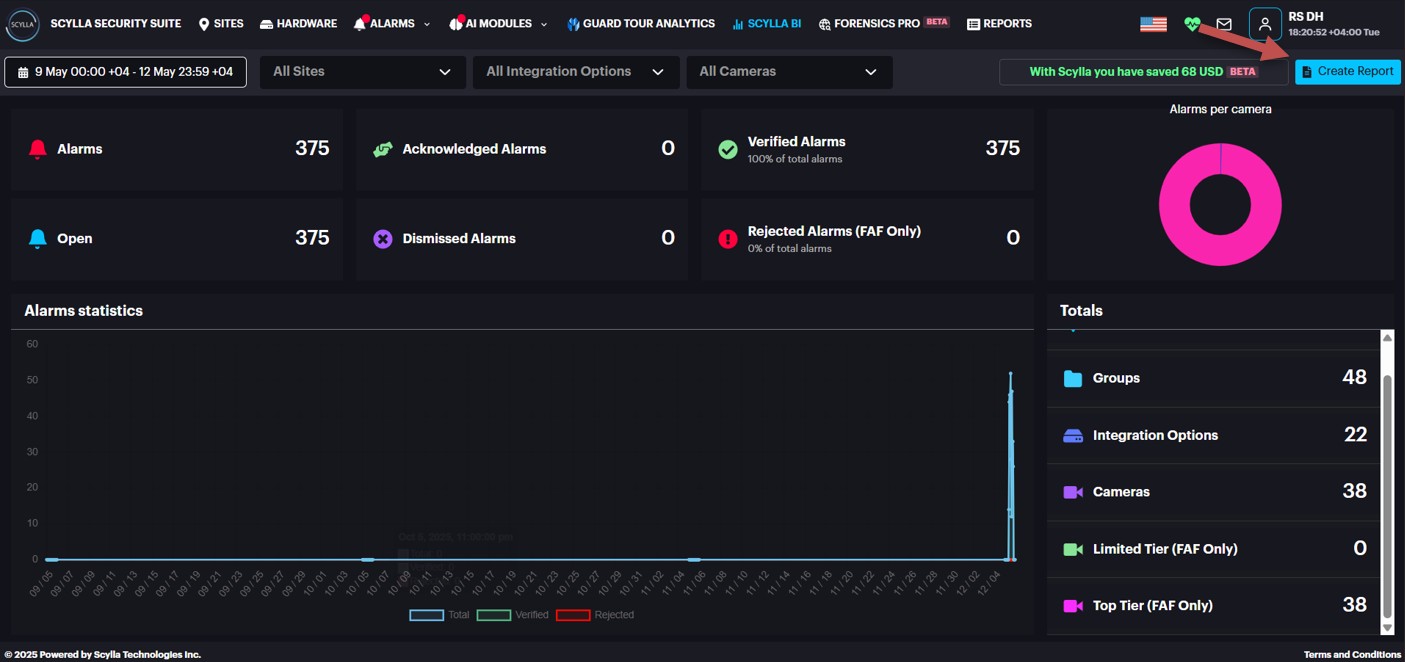
Reports
To create a report, go to the Statistics page and click Create Report.
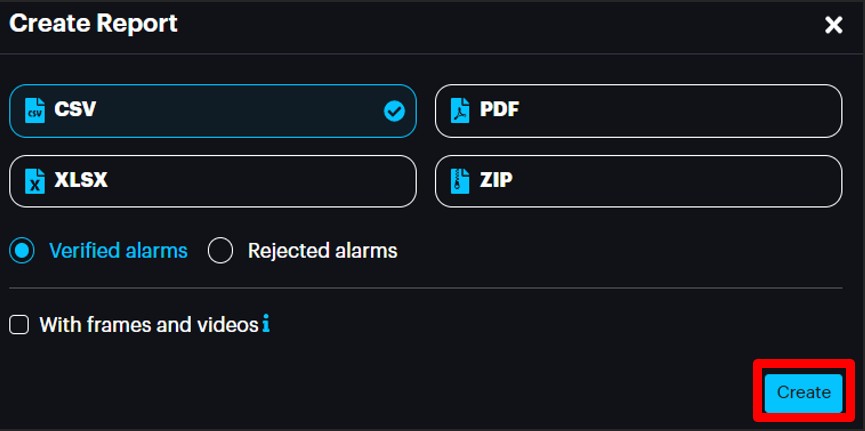
Then, in the Create Report pop-up menu, select the desired report format (CSV, XLSX, PDF, or ZIP).
Select the with frames and videos checkbox if you want to have alert frames and videos of detection occurrences in addition to the report file.
Select either the Rejected alarms or Verified alarms radio button if you want to have rejected alarms or confirmed alarms in addition to the report file.
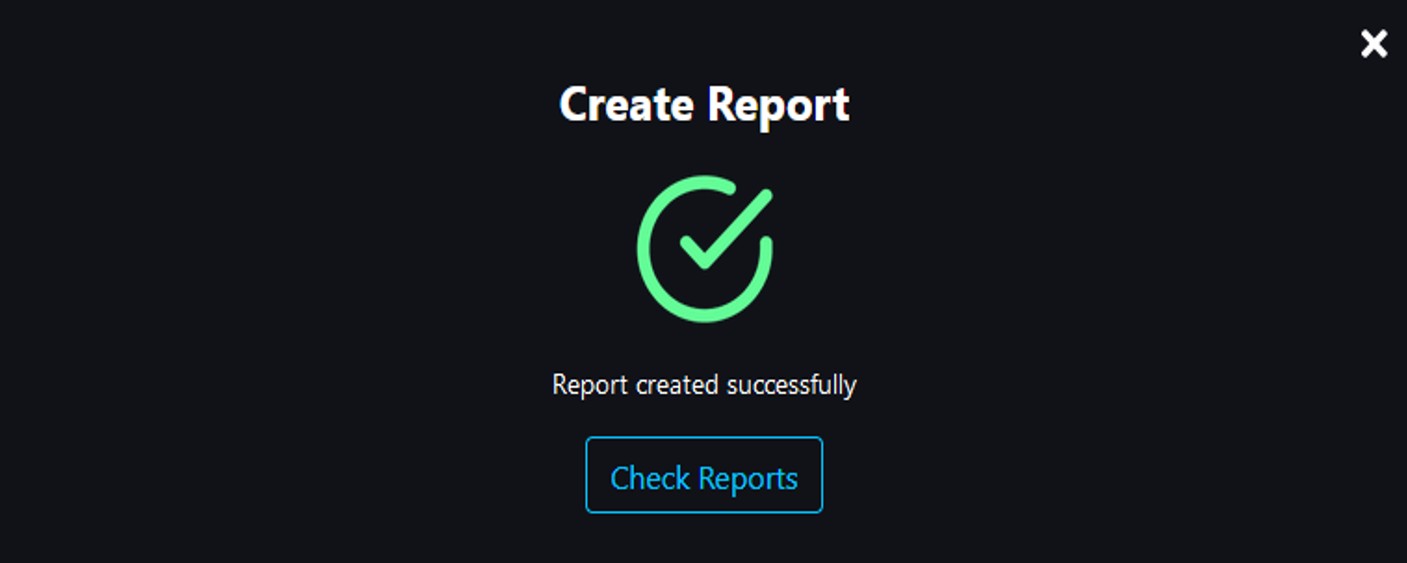
Click Create.
After the report was created successfully, click Check Reports.
Or go to the Reports page. Here you can see all your generated reports.
You can filter your reports by Type (format: JSON, XLSX, CSV, PDF), Date/Time, Status (Processing, Done, or Failed), and sort by presence of absence of alert frames of detection occurrences and rejected alerts.
Click the Download button to download the required report.
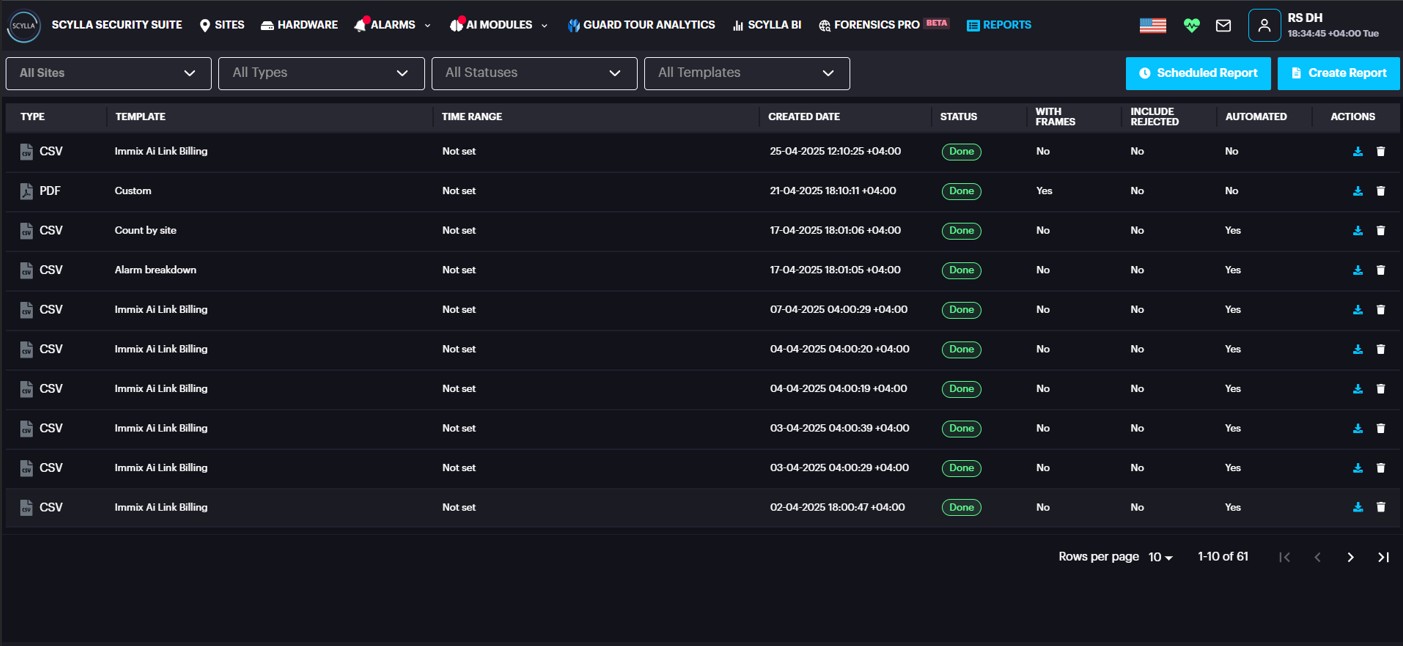
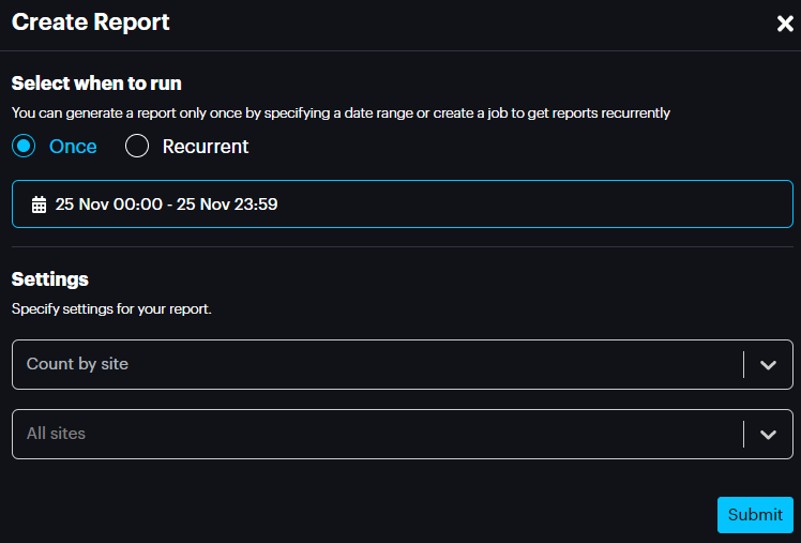
You can also create a report from this page by clicking the Create Report button.
On the Create Report pop-up select the report generation type (once or recurrently), desired date or a period specify settings for your report and click Submit
You will find your report on the list when you can Download it.
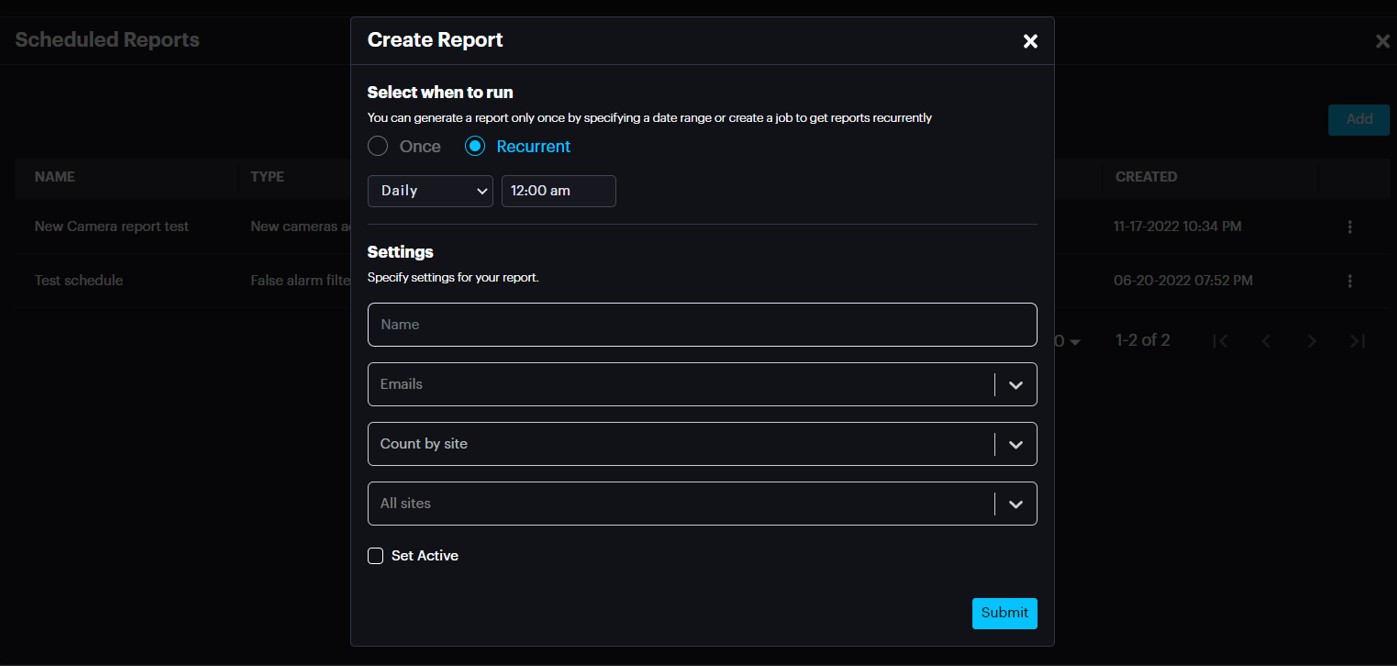
You can also check for the scheduled reports and add a new one by clicking the Scheduled Reports button.
On the Scheduled Reports pop-up click on Add button, then on Create Report page select the report generation type (once or recurrently), settings for your report and click Submit
AI Modules
Hover your mouse cursor over the AI Modules button to see the list of activated modules.
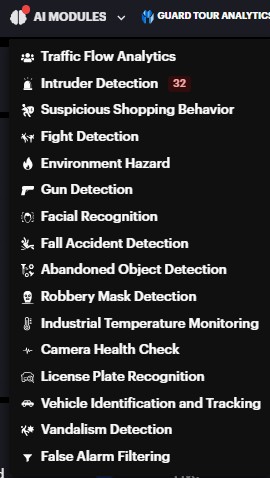
Click on the desired module to be directed to TOOLBAR page. There are two sections in Toolbar Views and Cameras.
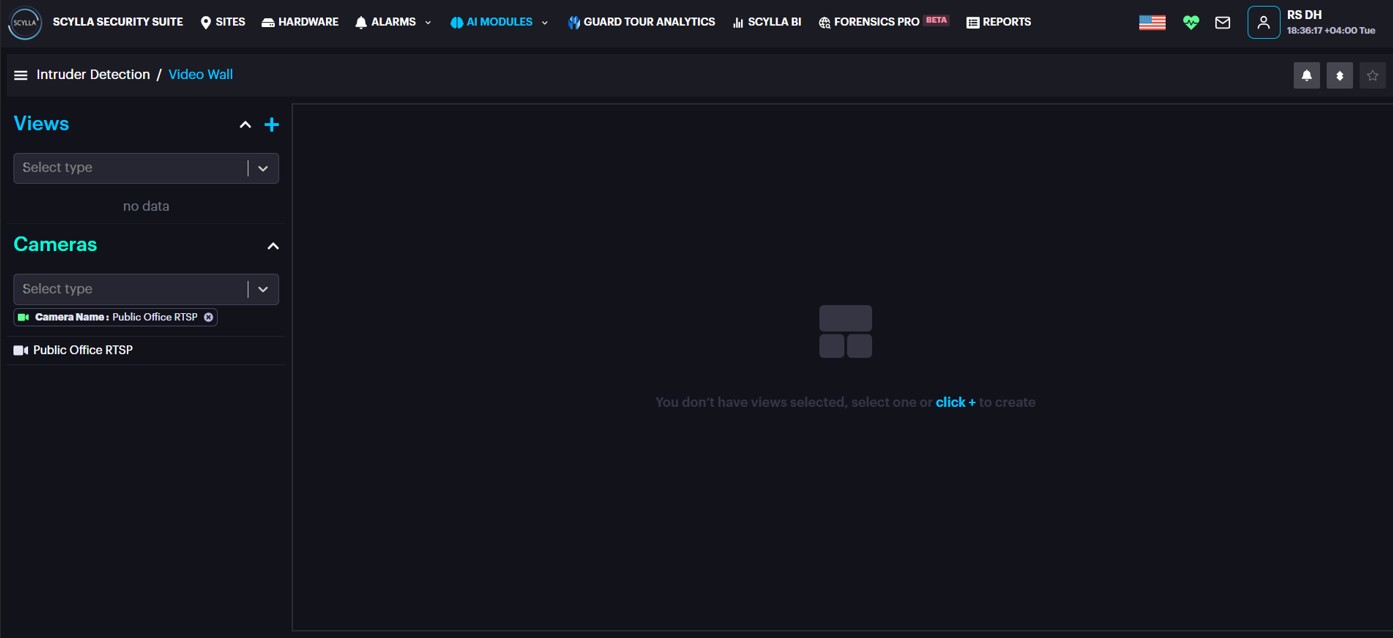
Views
Here you can create Group of Views with customized group of cameras of your choice.
To create the Group, click on the Add new Group button.
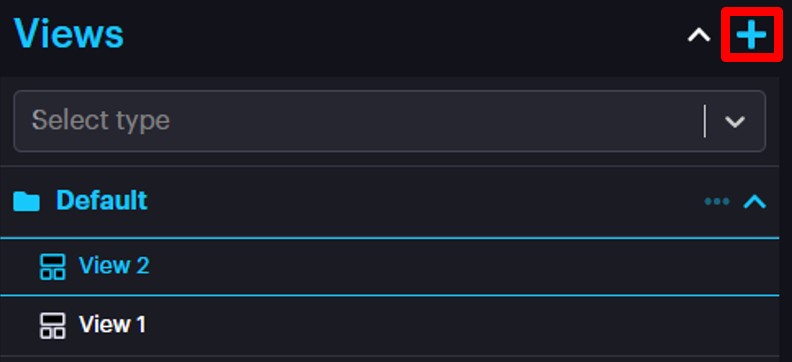
Name the group and click save.
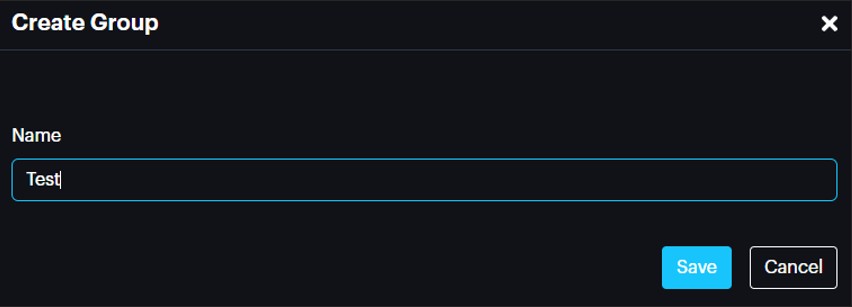
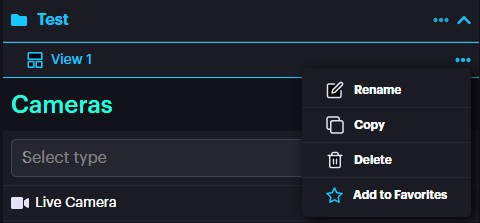
Then you need to add the View in the Created group. To add View, click on the More Options button on the desired group and click New View. You also can Rename, Copy and Delete the group by clicking the corresponding button.
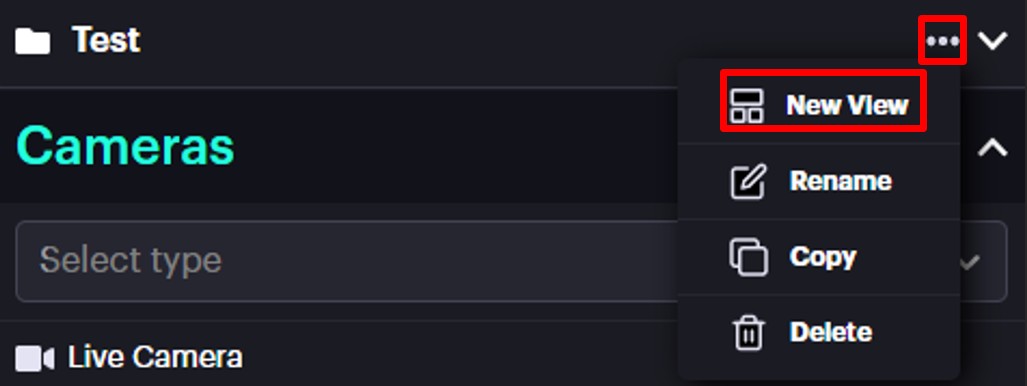
You will see the added View inside the group, which you can Rename, Copy, Delete and Add to Favorite by clicking the corresponding button.
After creating a View, you need to add cameras to customize your view with the cameras needed. Drag and drop your cameras from Cameras section and create custom layout, or you can use predefined ones after adding the cameras click save button.
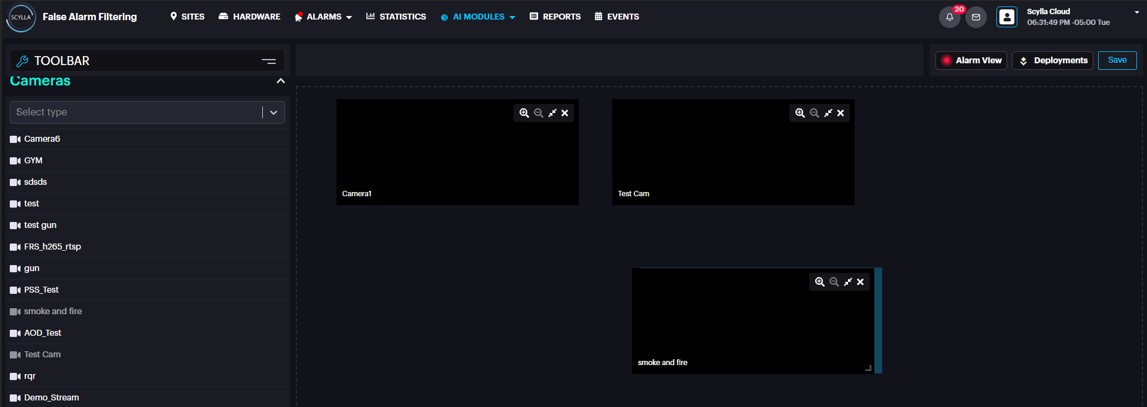
Cameras
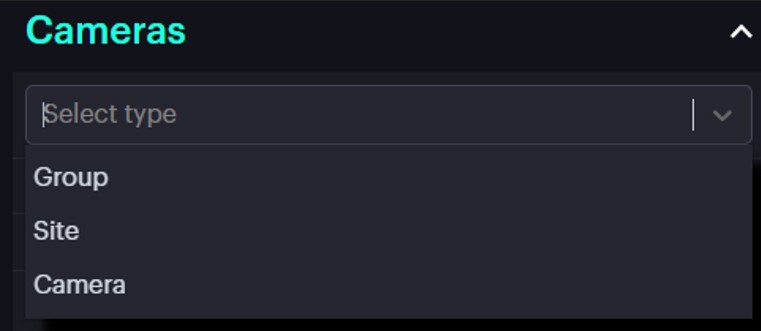
On the Cameras section, you can select existing cameras from the list to add them into Views, you even have option to select cameras by Group, Site and Camera.
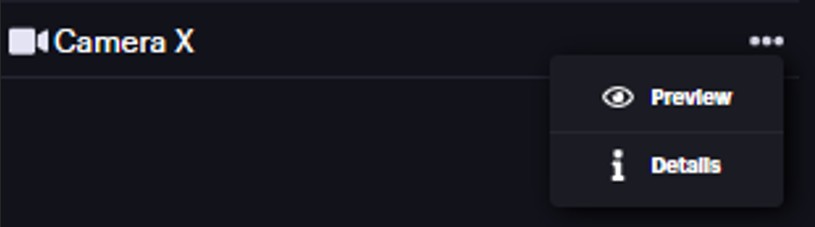
You can Preview the camera or check Details.
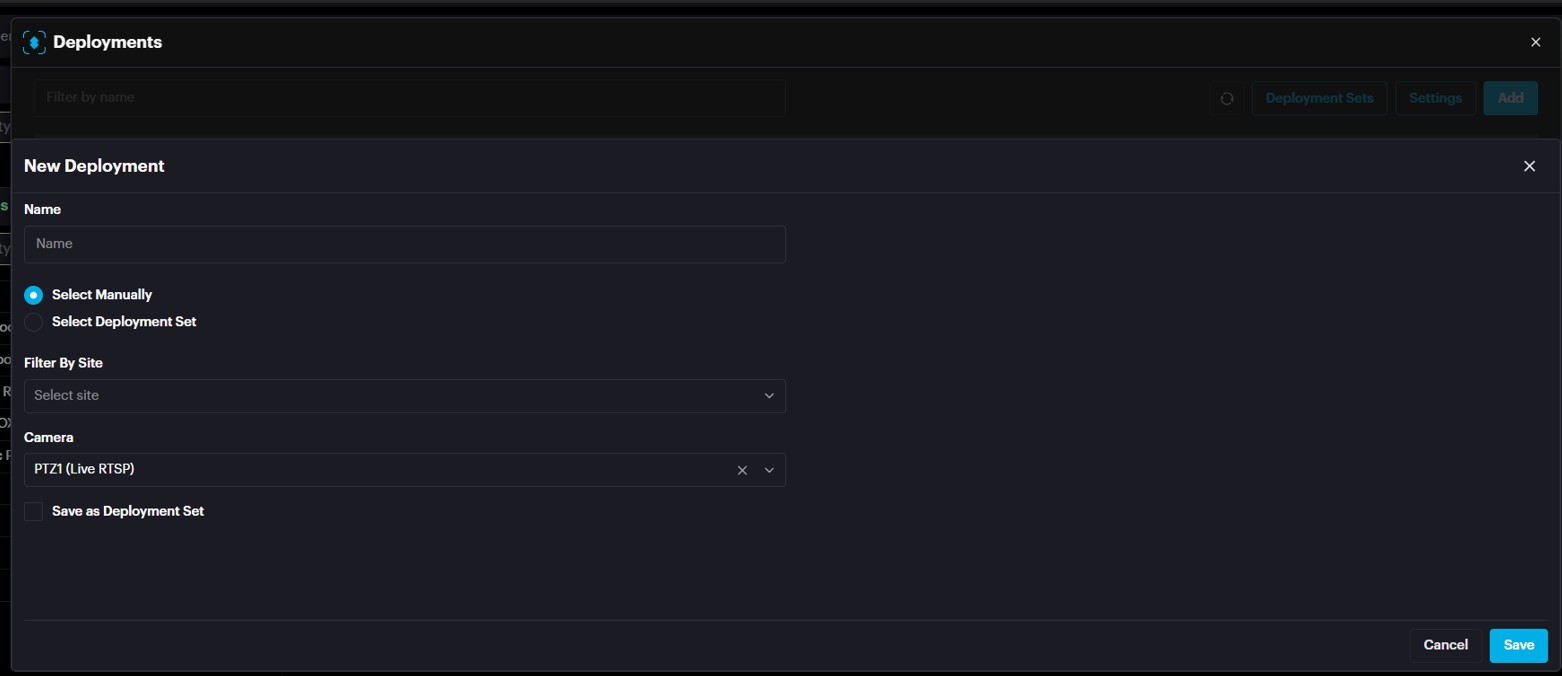
To integrate RTSP with Scylla Cloud, you first need to create a deployment.
Creating a Camera Deployment
- Click the Deployments button.
- Click the Add button.
- Select the cameras you wish to deploy for your specific module.
- Click Save.
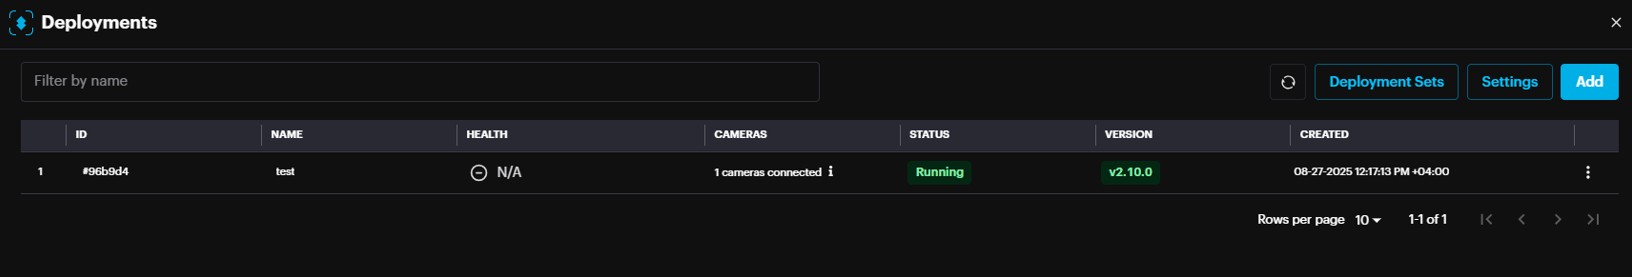
Deployment status shows Running meaning the engine is running and system is ready.
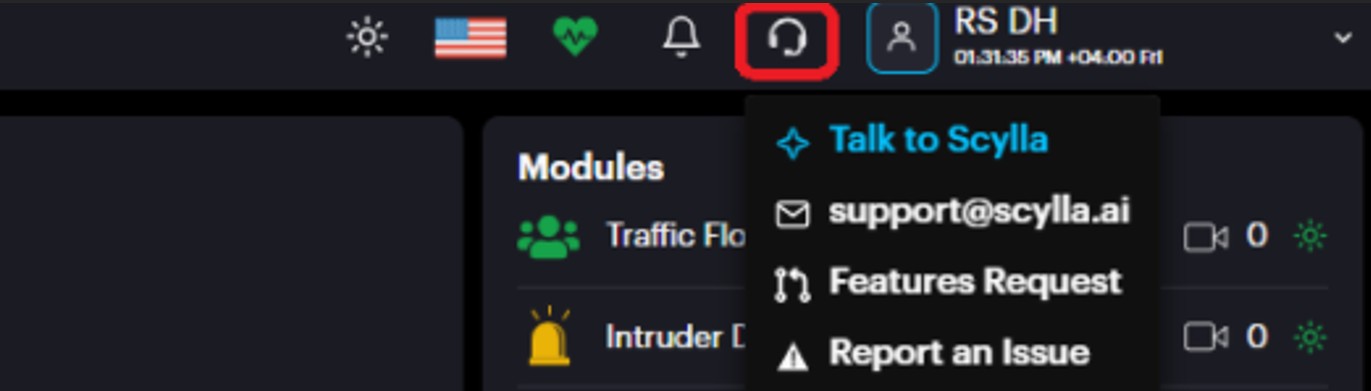
Scylla AI Assistant
To get instant assistance, follow these steps to use the Scylla assistant:
Dark/Light Mode
The User Interface includes a Dark/Light mode feature, allowing users to choose their preferred display mode.
To switch between Dark and Light modes, simply click the mode button located in the top menu bar.

Clicking the mode toggle button in the top menu bar will switch the interface to Light mode (if currently in Dark mode), or to Dark mode (if currently in Light mode).
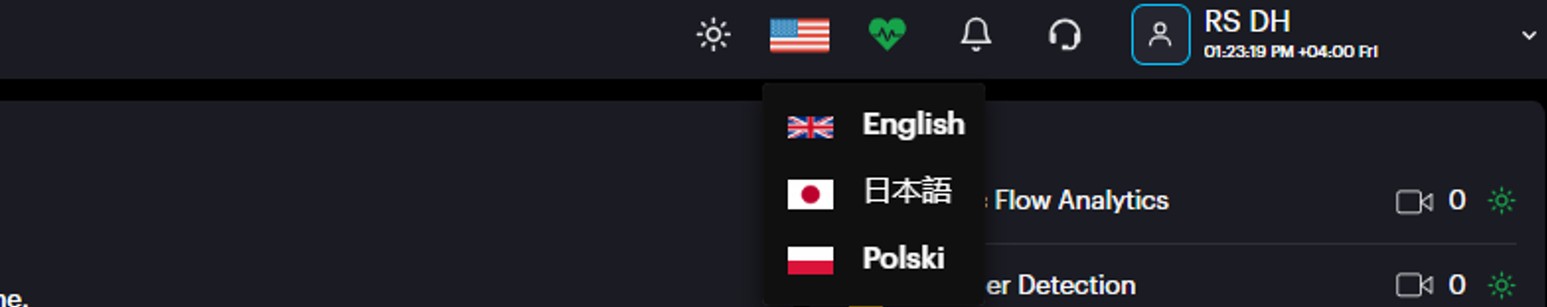
Language
Users can select their preferred language for the interface.
Scylla currently supports the following languages:
- English (default)
- Polish
- Japanese
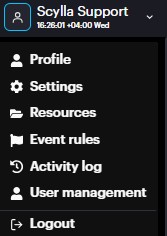
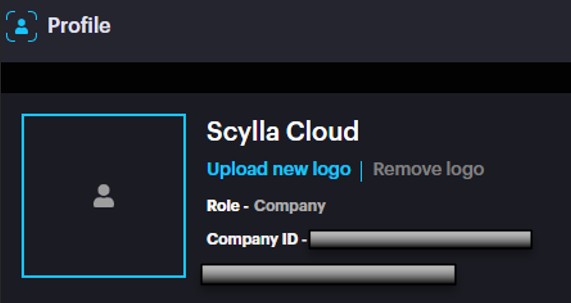
Profile
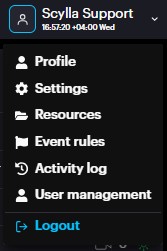
To open the Profile page, click on the username and click Profile.
The Profile page displays the logged in Username, Role and Company ID.
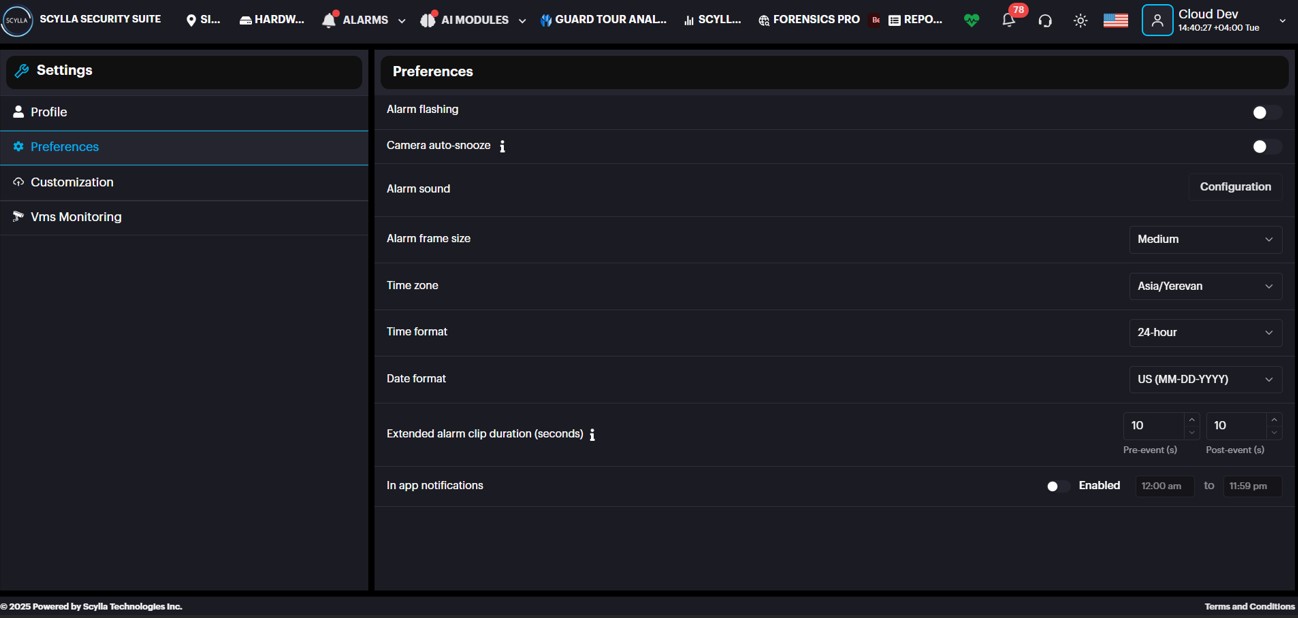
On the Preferences section you can switch the Alert flashing toggle to on/off to enable/disable the red flashes and blinks during the new detection occurrence. Camera auto-snooze , if enabled , will auto snooze the cameras for 3 hours when alarm limit/rate exceeds 75% to allow operators to optimize camera events . Alarm sound allows to configure the duration and repeat frequency of the alarm sound that plays when an alarm is triggered. Each AI module can have its own unique alarm sound settings. Time zone an Time Format allow you to configure the dashboard’s time according to your region, ensuring accurate time display .
Extended Alarm Clip Duration: Set the desired duration (in seconds) for event clips. This setting allows you to view a longer video that includes the footage captured both before and after an event.
In-App Notifications: Manage your app notifications here. You can enable or disable them completely, or set a specific schedule for when you want to receive them.
On the Customization section you can upload a custom logo and edit the logo name.
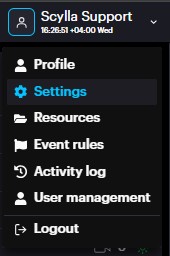
Settings
To open the Settings page, click on the account menu and click Settings.
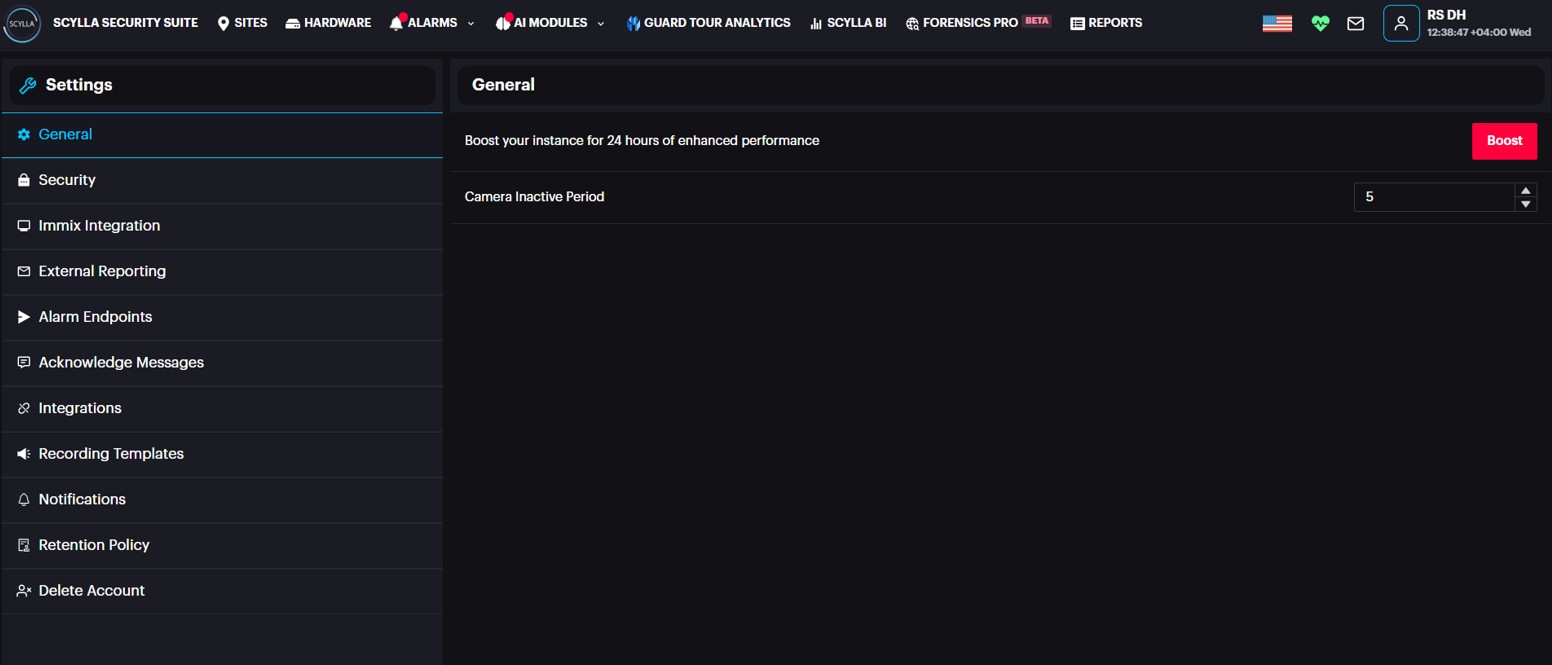
In the General section, you have the option to Boost the system to address alarm delays caused by event queues, as explained in the Boost section. Please note that enabling Boost may incur additional charges, so it should be used with caution. You can configure a Camera Inactive period, which automatically sets a camera's status to inactive if no alarms have been received from it within the specified number of days.
In the Security section, you can enable two-factor authentication (2FA). After you enable 2FA, you can link a third-party authenticator app to your account. To do this, either scan the provided QR code or manually enter the code into the app.
Once linked, you'll be required to enter a code from the authenticator app each time you log in, adding an extra layer of security to your account.
Select Immix Integration section if you need to set up Immix Plugin integration.More details are found in a separate document.
In case you would like to add email account(s) to receive alarms with snapshot attached and meta information you can select the External Reporting section.
Click on Alarm endpoints section if you want to check existing endpoints or add new one or edit/delete existing one.
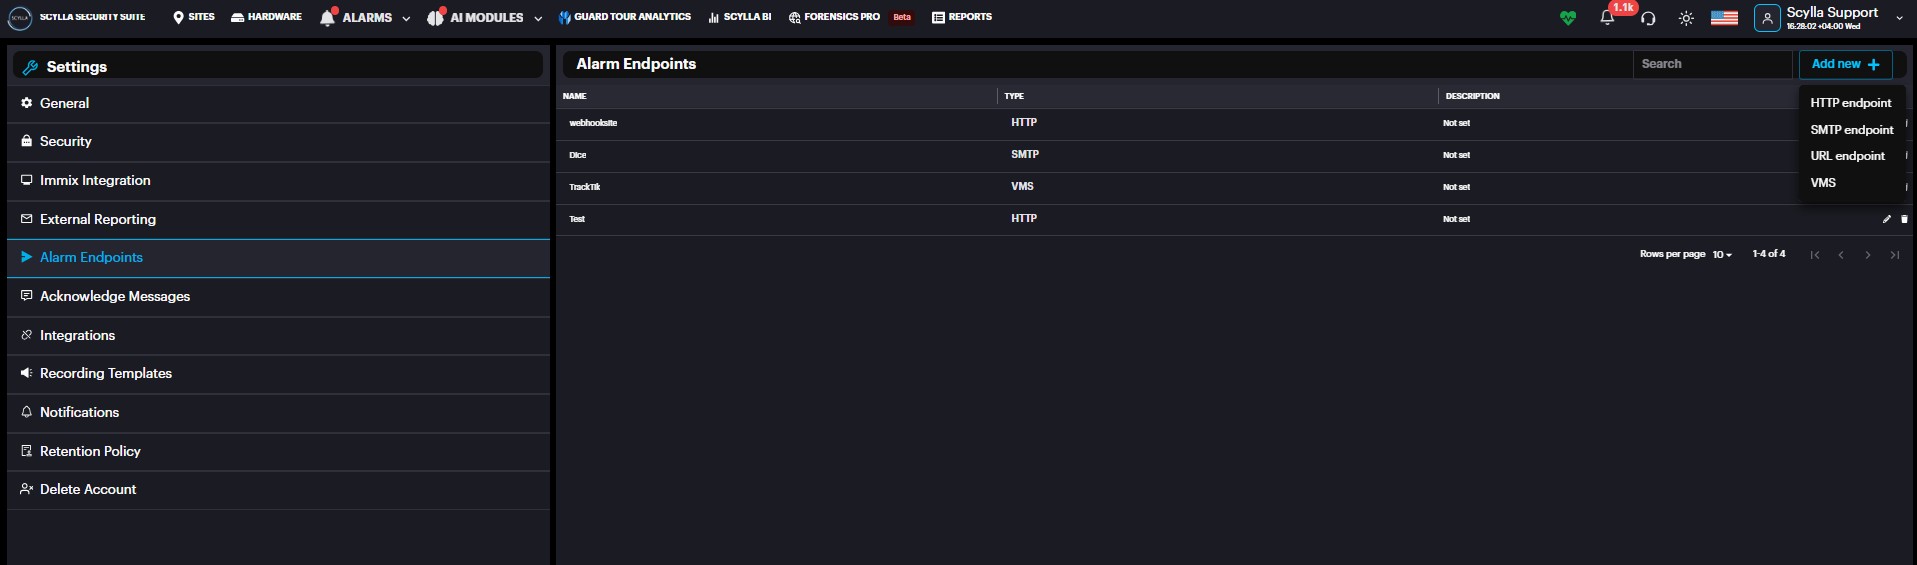
Click on Add new + icon to add endpoints such as HTTP endpoint , SMTP endpoint, URL endpoint or Patriot Systems.
In the Acknowledge Messages it is possible to create an acknowledge message that can be selected when acknowledging an alarm to avoid typing the acknowledge message every time acknowledging an alarm.
In the Integrations section, you can initiate integration with systems such as Patriot System, TrackTik, or Immix AI Link. To set up the integration, enter the required information including Server IP/Hostname, port number, and credentials.
Select Notification section to activate notifications and configure schedule for notifications. To activate an email notification, click on the activate symbol to turn green.
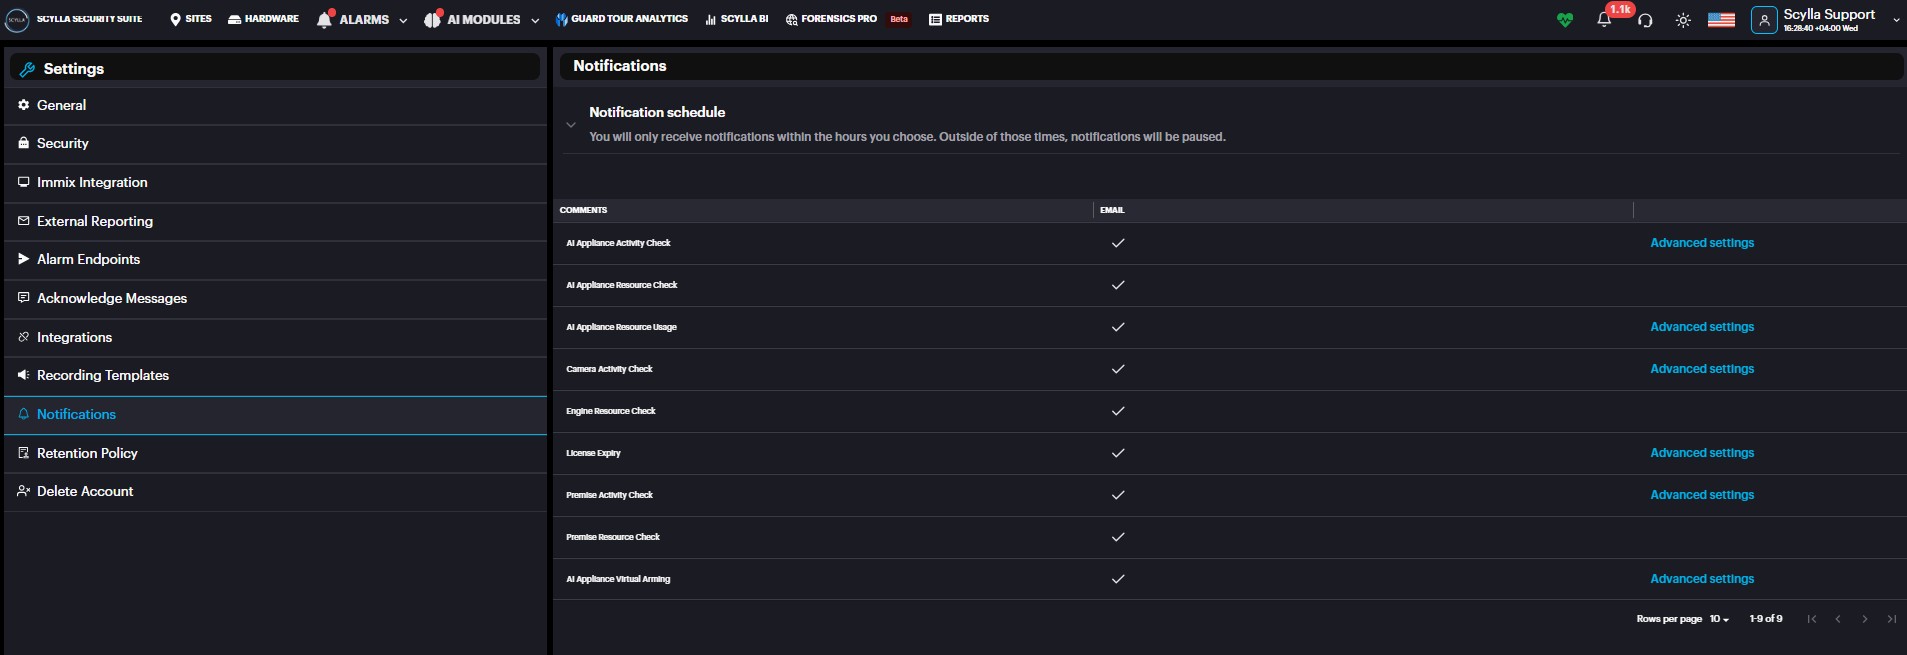
AI Appliance Activity checks the status of the Asteria device every specified time interval configured in the advanced settings and if it's offline it sends an email to the user.
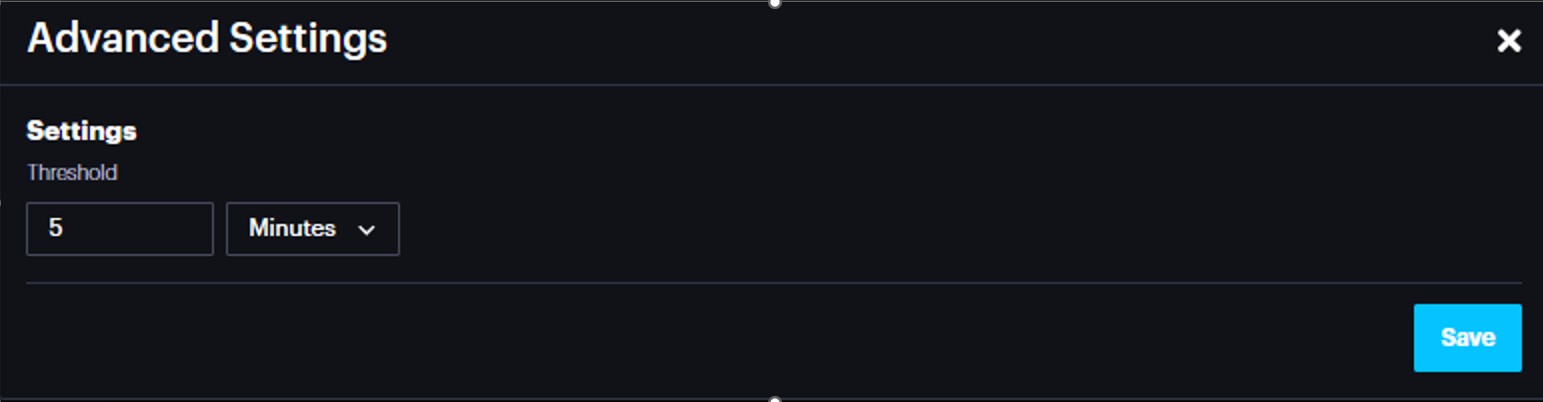
License Expiry sends email notification before the license is expired before specified time interval in the advanced settings.
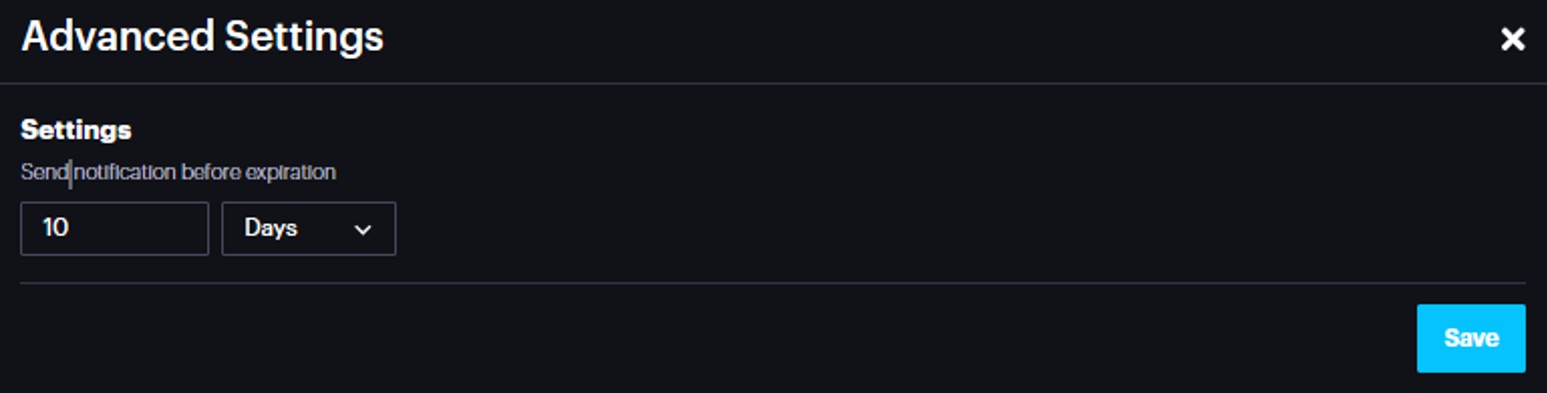
Camera Activity Check checks if there is an alarm from the selected camera(s) within the specified time interval and if not, it sends a notification.
In the Retention Policy you can find the information about the Verified alarm and Data Retention Periods.
In Delete account you can delete and remove your account from Scylla Cloud.
Resources
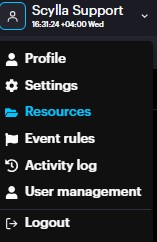
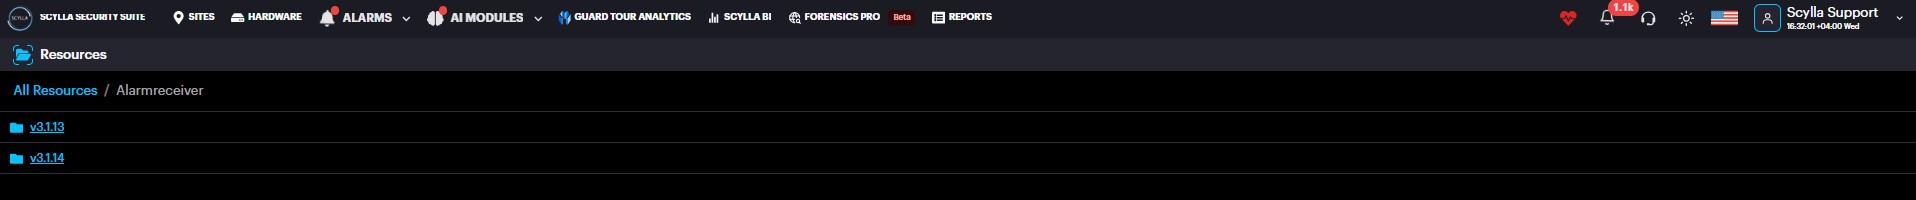
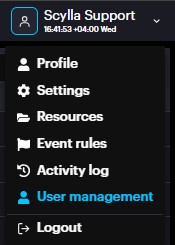
To open the Resources page, click on the username and click Resources.
On the Resources page you can find manuals and installation files for better understanding and easier use of the Scylla Security Suite.
You can go to the desired folder and its subfolders and download the required file by clicking the Download button near the corresponding file.
Event Rules
Event rules allow you to define specific conditions that, when met, will trigger predefined actions. They are essential for activating responses such as HTTP endpoints, SMTP notifications, or sending alarms to the dashboard.
Even if you have configured alarm endpoints in the Alarm Endpoints section, event rules are necessary to trigger those endpoints.
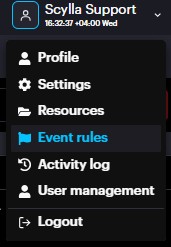
To open the Even Rules page, click on the username and click Event Rules.
On the Event Rules page, you can create a schedule, as well as event rules, where you can Name them, specify them with Integration types, sites, cameras and
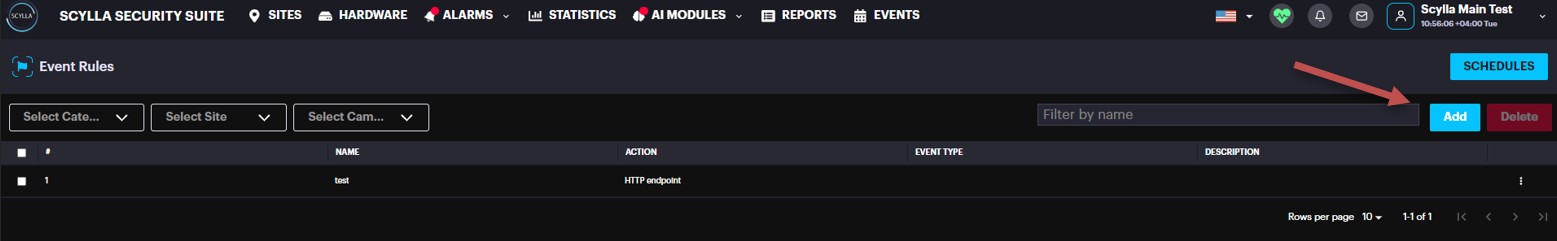
schedules, add description if it's needed, choose action and click Save.
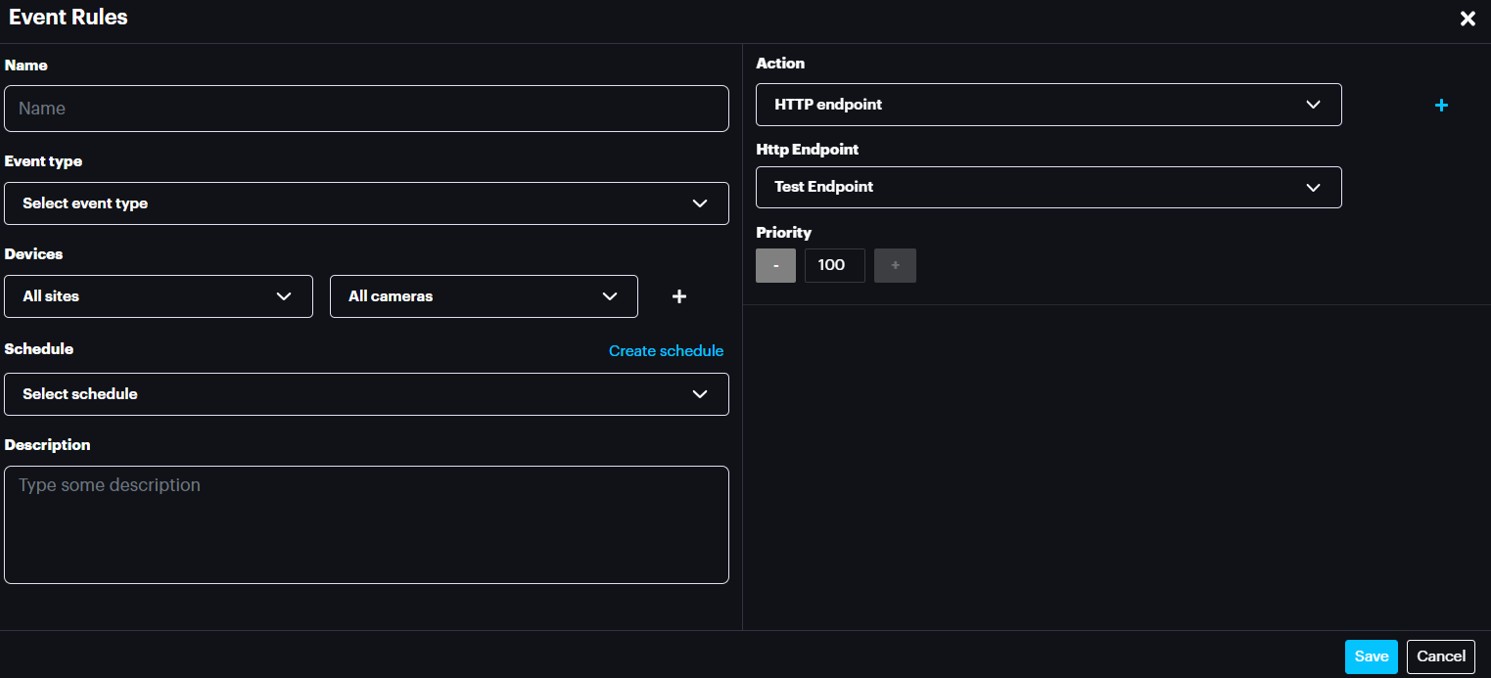
Event rule will work only when it is in schedule and satisfies the selected conditions.
Multiple External endpoints per camera zone for IDS
If a camera has several active areas/zones/polygons , it is possible to trigger multiple external endpoints per camera area/zones/polygon.
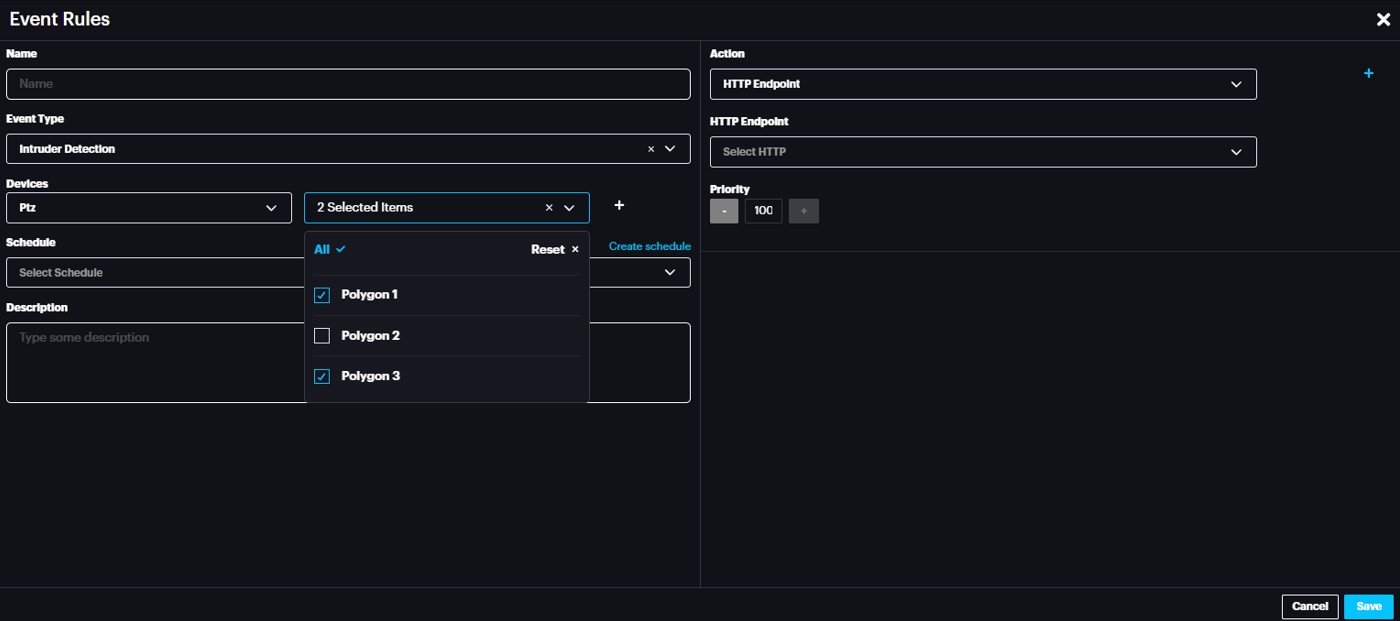
To trigger different endpoint per area/zone/polygon, select the camera under Devices and select the required area/zone/polygon under the Areas. Then, in the action tab select the required action to external endpoints (HTTP, SMTP etc.)
Holidays
Holidays can be configured to define the special days that can adopt different schedules with priority over the existing schedules.
Go to Event Rules -> Schedules -> Holidays
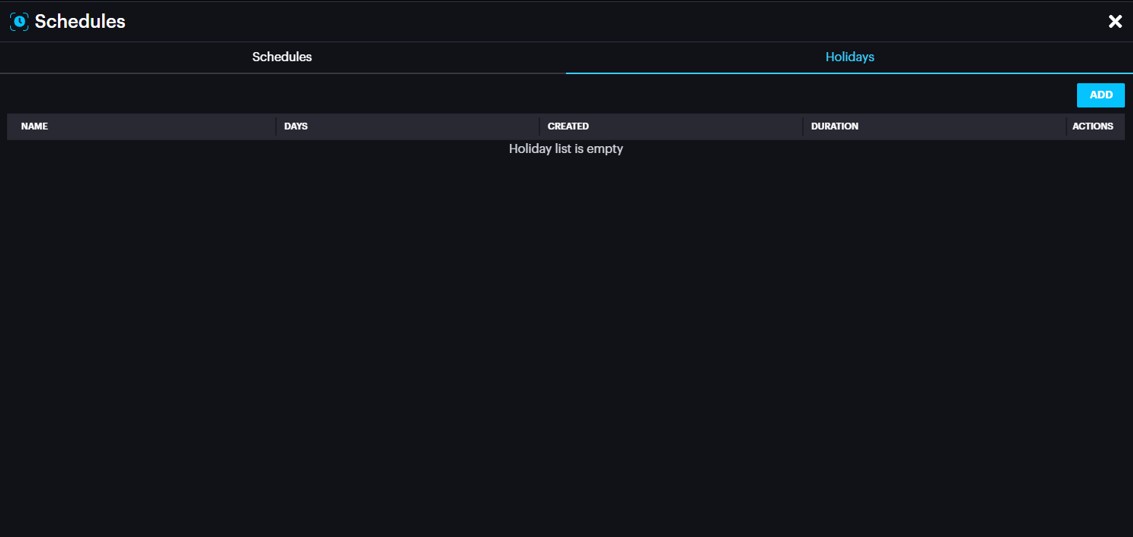
Click ADD to add a holiday
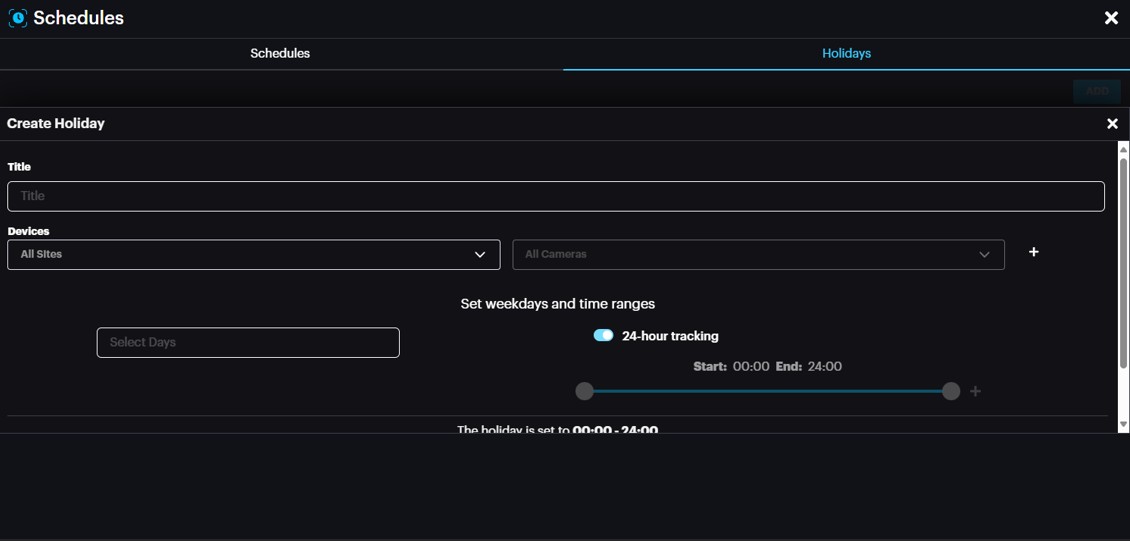
Title: Name of holiday
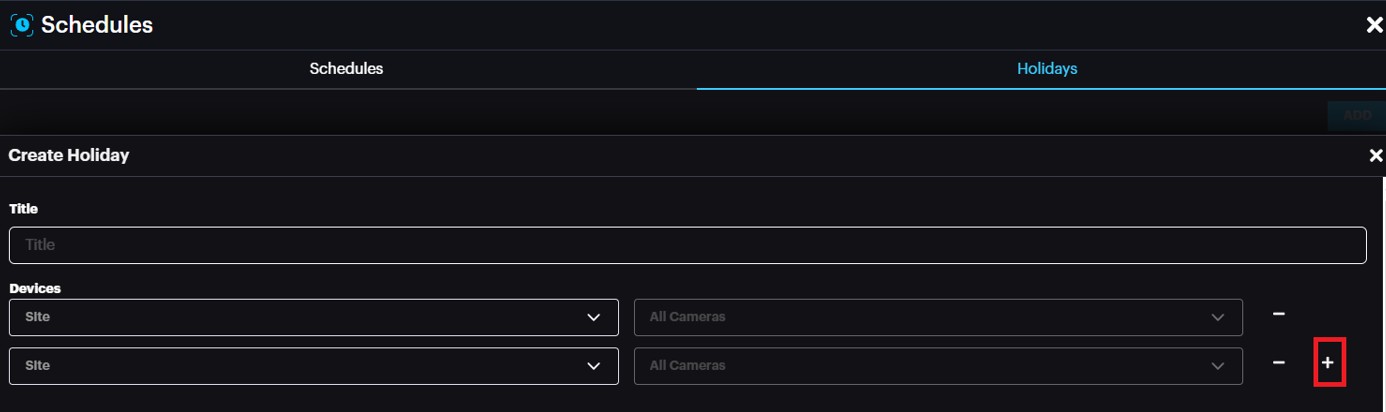
Devices: Site(s) and camera(s) that will work based on the holiday schedule
It is possible to add multiple sites/cameras by clicking the +
Select Days: Specify Holiday date(s)
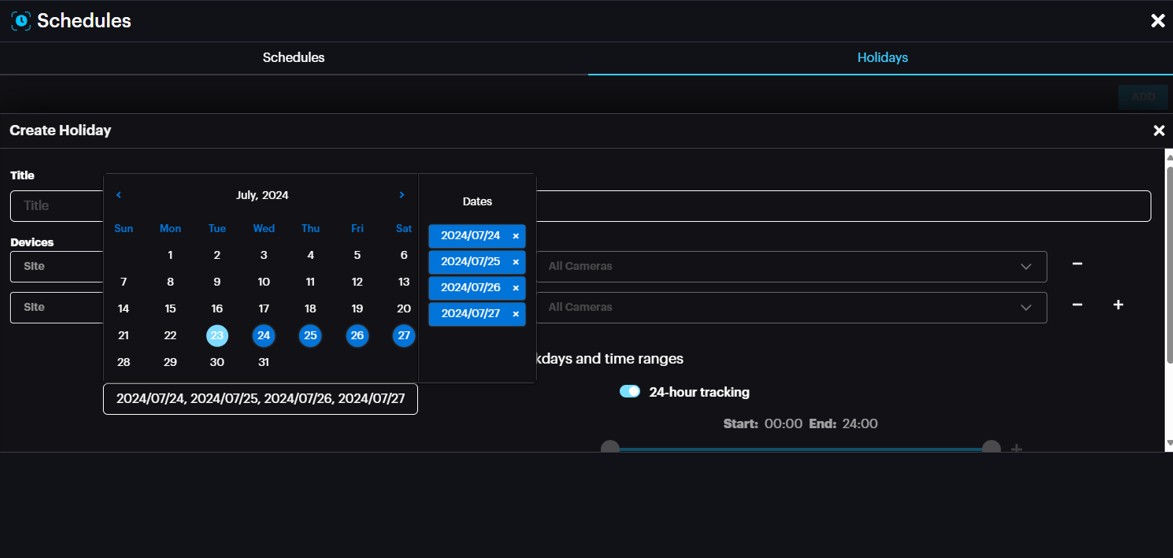
Set Weekdays and Time Ranges: Set the time ranges for Holiday schedule
In the above example, for the specified devices (sites/cameras), the schedule to be considered is 24 hours for July 24,25,26 & 27 regardless of existing schedules bound to these devices.
Once done, click Submit.
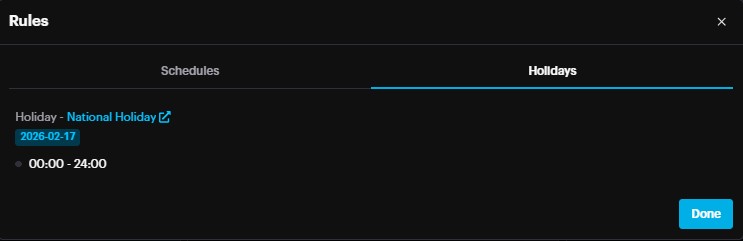
To check Holiday for a specific site or camera, select the site or camera -> view schedule
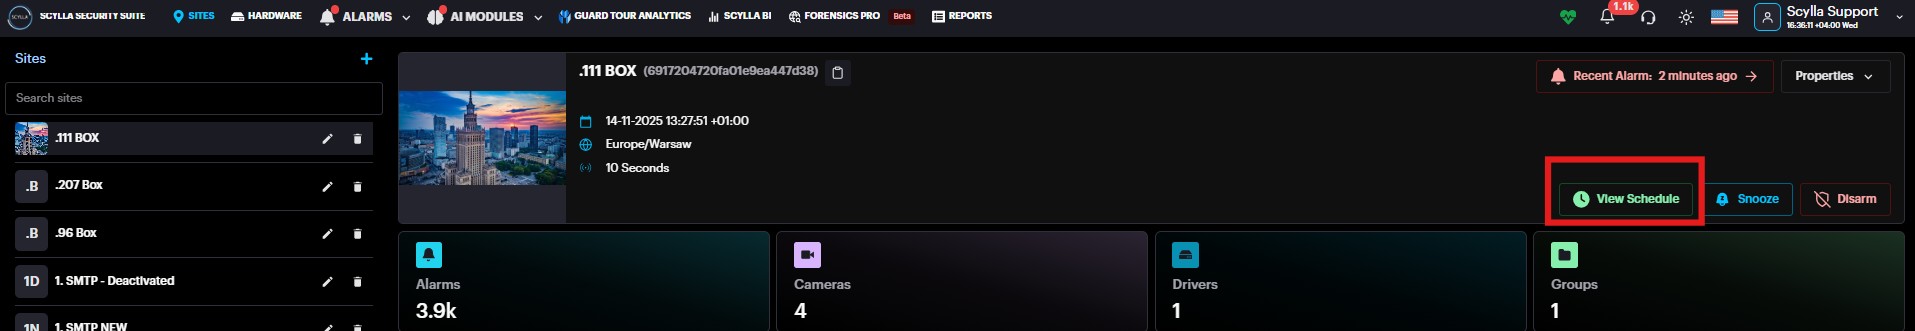
Go to Holidays tab
Activity Log
In this page you can follow up for the last activities (create, update, delete) on dashboard made by Users
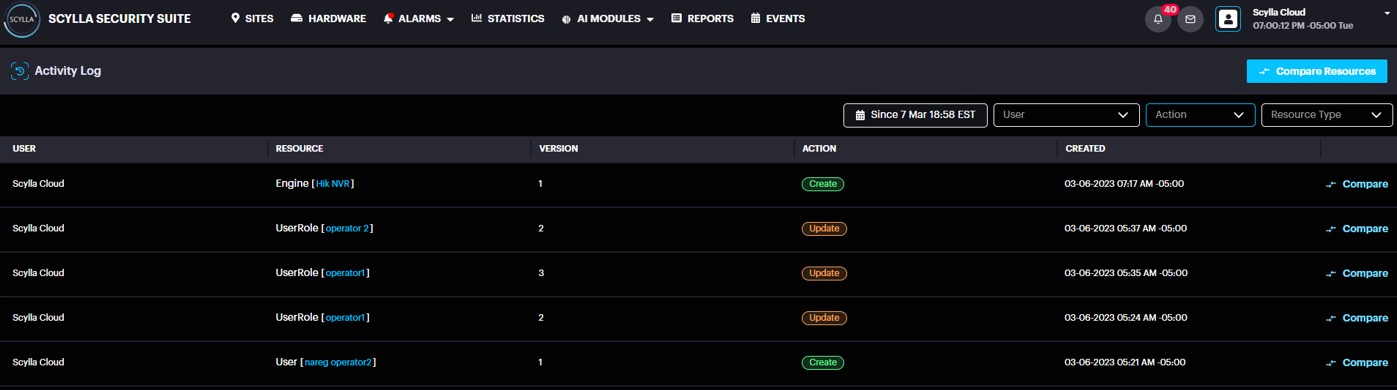
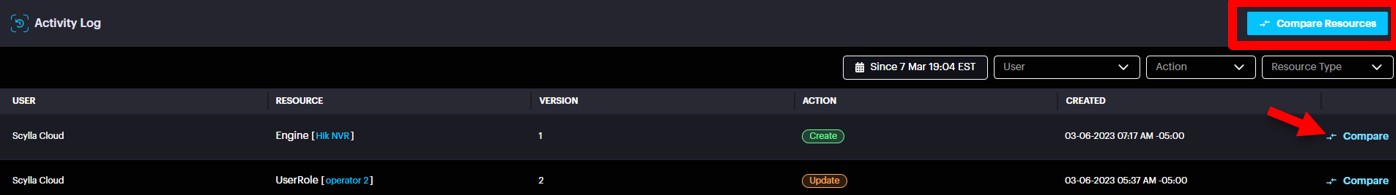
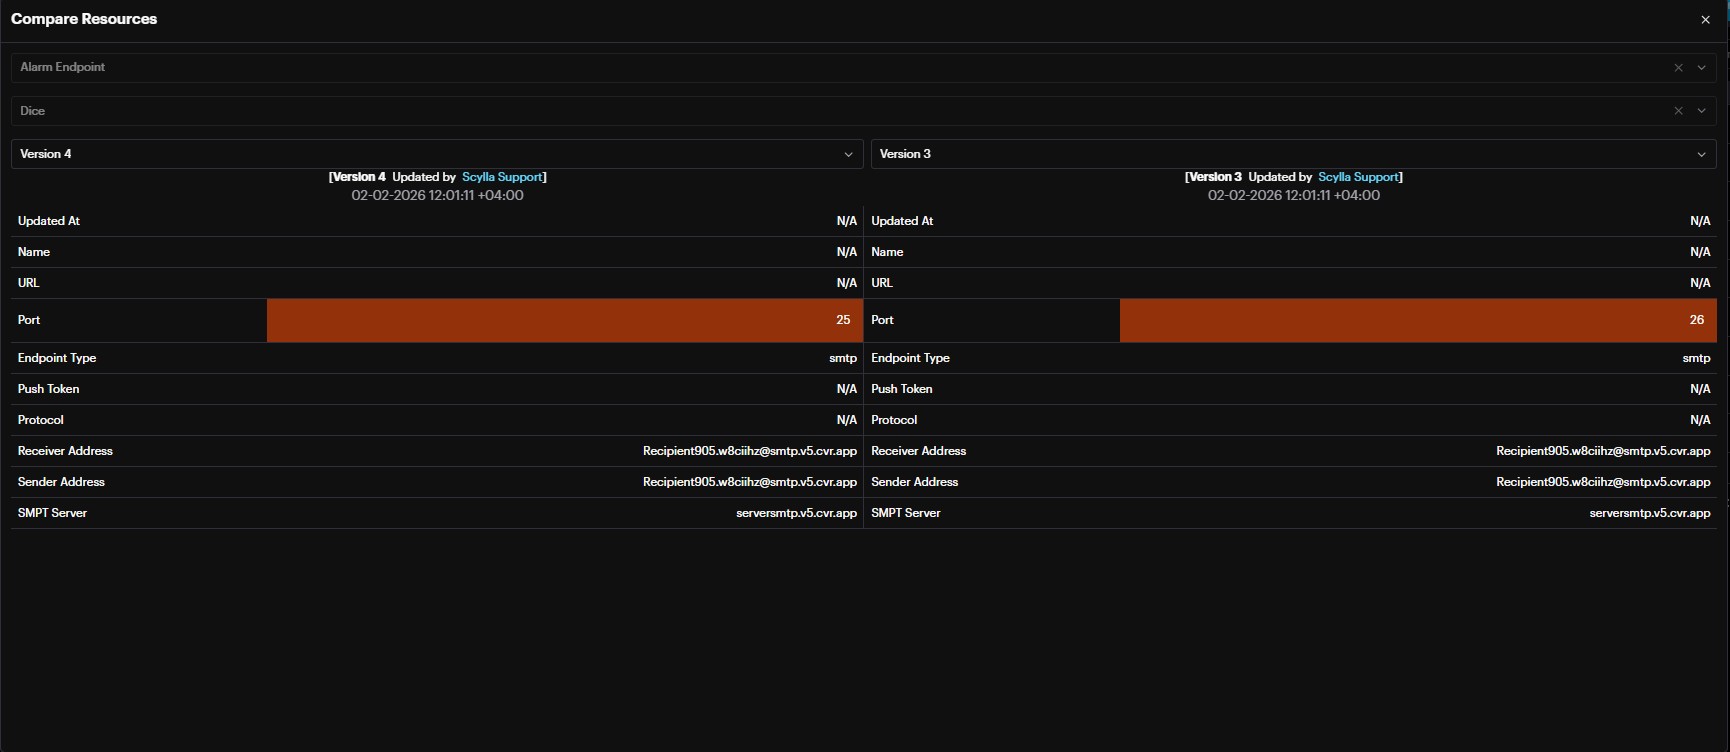
You can also compare the versions, after an update just by clicking to compare button and choosing the versions that need to be compared.
User Management
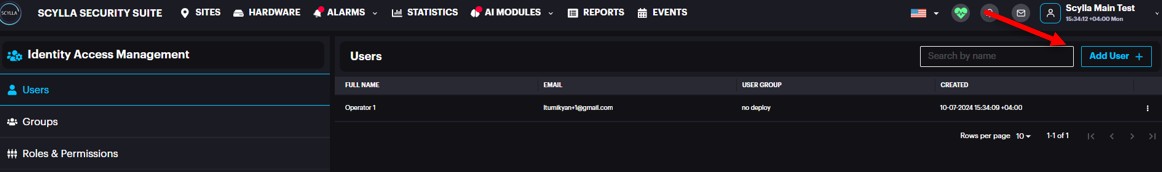
Users
Users' subsection allows users to add, delete, or edit.
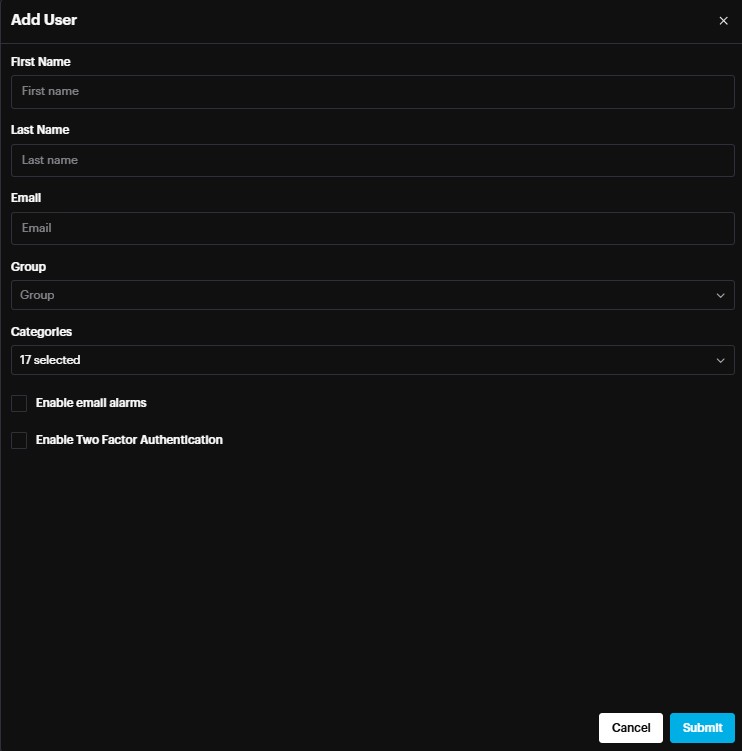
To add a new user, click on the Add User button.
On the Add User popup menu enter the First Name, Last Name, Email, and select the Group, and Categories of Scylla modules for the user. Select the Enable email alarms if you want this user to receive alarms via email too and Select Enable Two Factor Authentication if needed for this user. Click Submit.
To edit an existing user, go to More Options→ Edit.

And edit the information in the popup menu.
Groups
Groups subsection allows to add, delete, or edit groups.
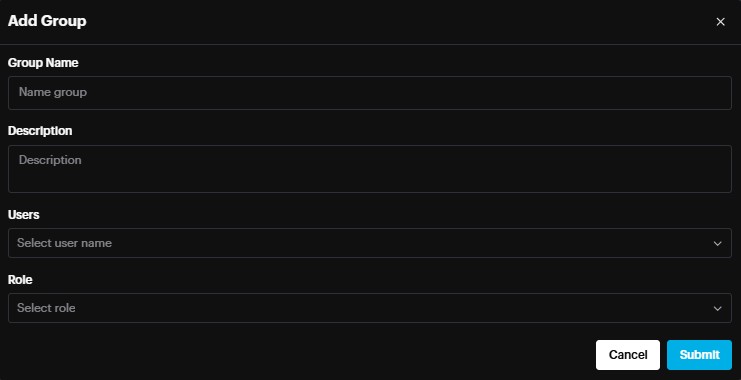
To add a new group, click on the Add Group button.
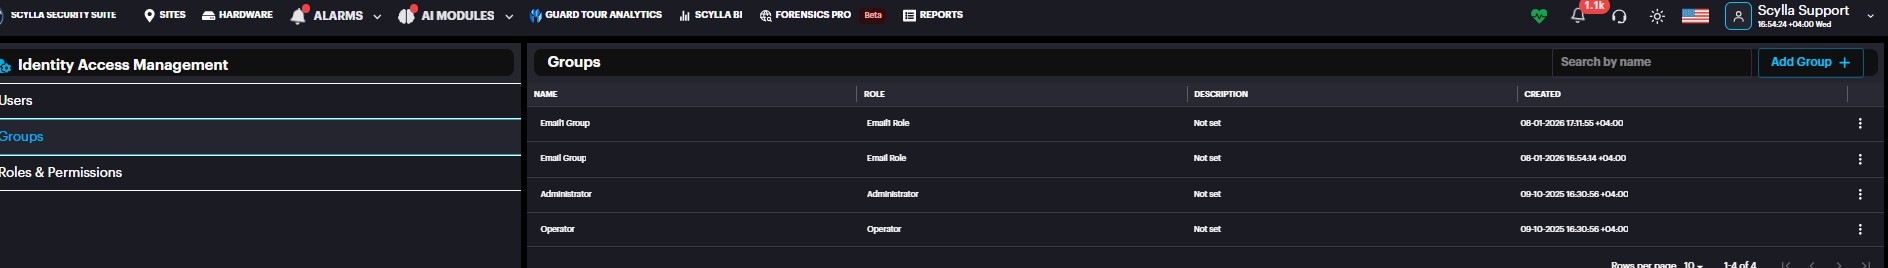
On the Add group popup menu enter the Group Name, Description, and select the Users who will be included in this group**,** and Roles. Click Submit.
To edit an existing group, go to More Options→ Edit.
And edit the information in the popup menu.
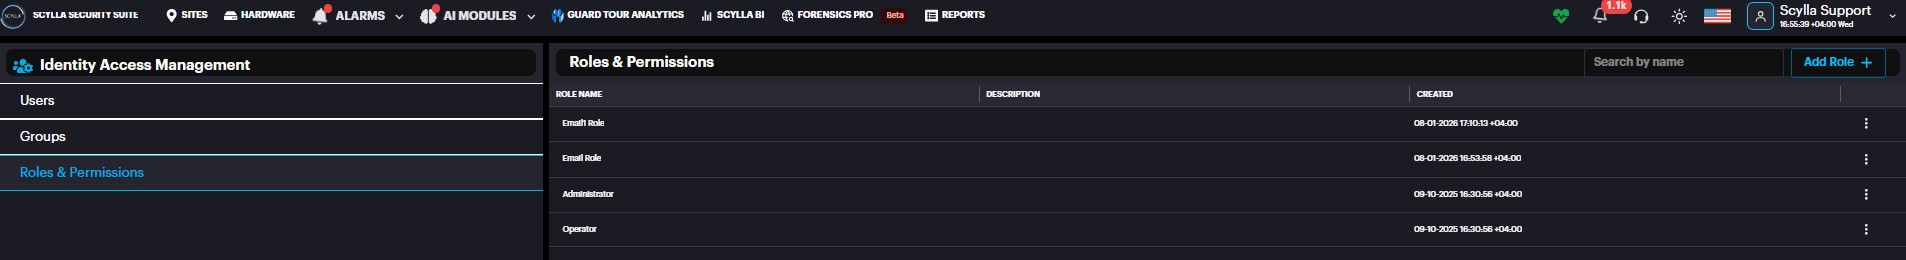
Roles
Role's subsection allows to add, delete, or edit roles.
To add a new role, click on the Add Role button.
On the Add role popup menu enter the Role Name and Role Description.
Then assign abilities to View, Create, Update, and Delete to different users for specific policies by selecting the corresponding checkbox.
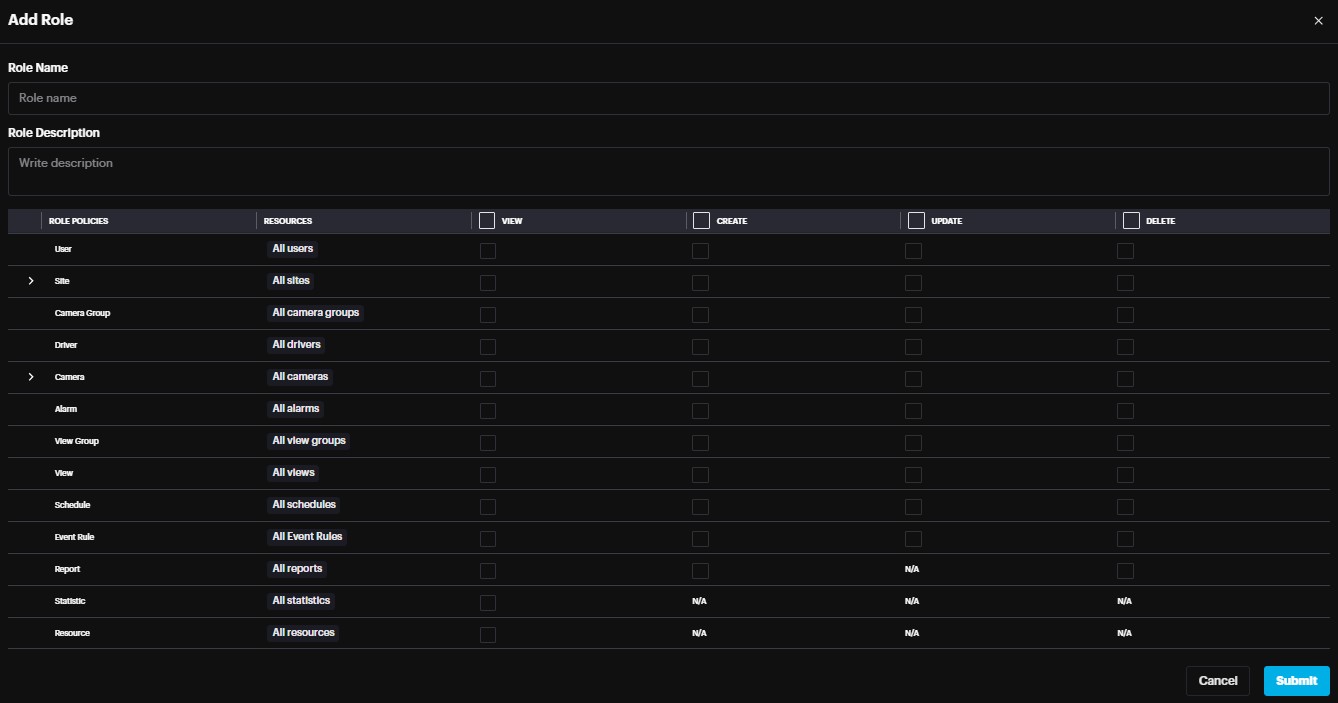
Click on the Open button on the Sites and Camera Role Policies sections to reveal more options. Then specify resources in the corresponding dropdown list, and then select the View, Update, and Delete checkboxes only for the desirable site/camera.
Click on the and buttons to add another site/camera.
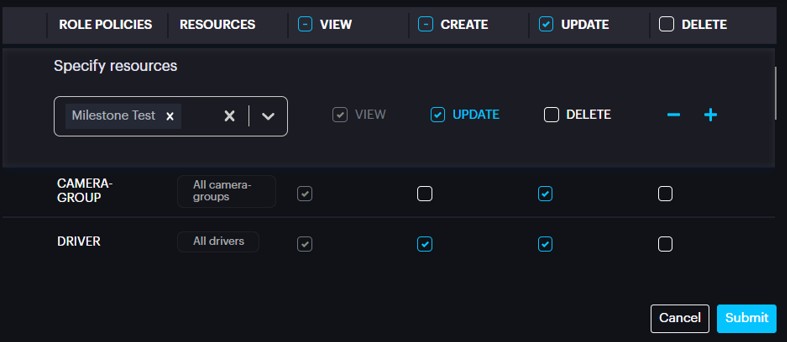
Click Submit.
To edit an existing role, go to More Options→ Edit.
And edit the information in the popup menu
Logout
To log out from your user account, click on the username and click Logout.
In the top right corner, there are shortcuts for language, events and email.

Language: English, Japanese or Polish
Events: Notifications of new events
Email: Send an email to Scylla support
We value and appreciate your feedback. If you have any questions or suggestions, please contact support@scylla.ai or submit a request to the Scylla Help Center at https://support.scylla.ai/portal/en/home.